Not able to use sheet name when calling add_series #449
Comments
|
That bold text was a line with a #as the first character? That's how I got Sheet2 as a name. It was commented out. |
|
Hi,
I fixed that in your post.
Unfortunately if you don't post a small complete working example then I can't reproduce the error which means I can't help you. From the sample of code above I can't see anything wrong. You wil have to submit a small complete working example that demonstrates the issue. John |
|
I converted your sample code into a small program and I don't see any issue: import xlsxwriter
class MyTest:
def __init__(self):
self.VregText = 'test'
self.excelFileName = self.VregText + ".xlsx"
self.workBook = xlsxwriter.Workbook(self.excelFileName)
self.scopeSheet = self.workBook.add_worksheet(self.VregText)
self.summarySheet = self.workBook.add_worksheet("Summary")
def startTimer(self):
data = [
[2, 3, 4, 5, 6, 7],
[10, 40, 50, 20, 10, 50],
]
self.summarySheet.write_column('A2', data[0])
self.summarySheet.write_column('B2', data[1])
def stopTimer(self):
self.startStop = False
resultsChart = self.workBook.add_chart({'type': 'scatter'})
tempSheetName = self.summarySheet.get_name()
print("summary sheet name " + tempSheetName)
resultsChart.add_series({'categories': "=Summary!$A$2:$A$5",
'values': "=Summary!$B$2:$B$5"})
# Add a chart title and some axis labels.
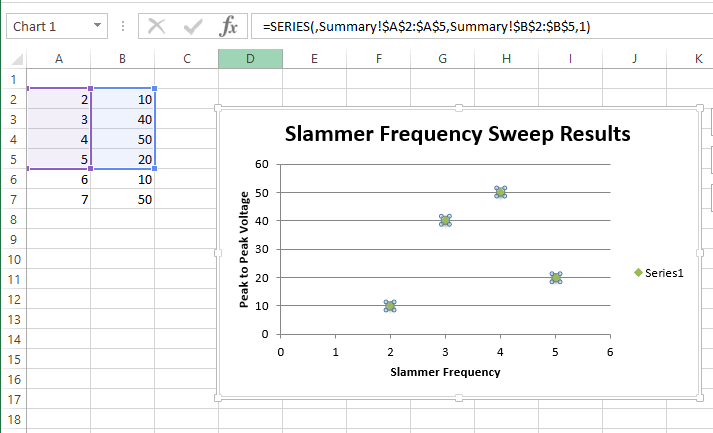
resultsChart.set_title({'name': 'Slammer Frequency Sweep Results'})
resultsChart.set_x_axis({'name': 'Slammer Frequency'})
resultsChart.set_y_axis({'name': 'Peak to Peak Voltage'})
# Set an Excel chart style.
resultsChart.set_style(13)
# Insert the chart into the worksheet (with an offset).
self.summarySheet.insert_chart('D3', resultsChart)
self.workBook.close()
runner = MyTest()
runner.startTimer()
runner.stopTimer()The output looks correct:
Note that the tempSheetName = self.summarySheet.get_name()
print("summary sheet name " + tempSheetName)
resultsChart.add_series({'categories': [tempSheetName, 1, 0, 4, 0],
'values': [tempSheetName, 1, 1, 4, 1]}) |
|
Closing since there isn't a reproducible issue here. If you find one please resubmit it as a small working example. |
|
I created a sequential version of what I'm trying to do and it works fine. Code is pasted below. I'm using PyQt5 and multithreading in the original so there's too much code to post all of it. I'm trying to pare this down to the minimum that will show the issue without using PyQt. I'll post that if I can make it happen. Thanks. import xlsxwriter workBook = xlsxwriter.Workbook("sheetNameIssue.xlsx") summarySheet.write(1, 0, 0) summarySheet.write(1, 1, 0) resultsChart = workBook.add_chart({'type': 'scatter'}) Add a chart title and some axis labels.resultsChart.set_title ({'name': 'Slammer Frequency Sweep Results'}) Set an Excel chart style.resultsChart.set_style(13) Insert the chart into the worksheet (with an offset).summarySheet.insert_chart('D3', resultsChart) workBook.close() |
|
Thanks for the effort you've put into this and for xlsxwriter. I created a bare minimum PyQt5 program and it works fine. Apparently whatever my original problem is it's more subtle than I anticipated. I'm posting this code here because I've gotten it all on-line and there's some useful stuff distilled down into one bare bones dialog. Perhaps it's useful to others. import sys import xlsxwriter class TimerThread(QObject): class MainWindow(QWidget): if name == 'main': |
|
Sorry about the formatting stuff. Thought it would post Ok as long as no #'s in first column? |
|
My floats were not being written to the spreadsheet as floats. Doh! It's always the simple things. I guess I'm used to C++ and having error codes that can give me clues. That's my excuse anyway. Thanks again xlsxwriter is a great tool for what I'm doing. |
Hi, I've run the sample code for creating a scatter chart with xlsxwriter and it's working fine.
But in my code I want to pass the name of the sheet rather than using Sheet1 as in the examples.
In the code below if I use the name 'Summary' the call fails and I get an error message when trying to open the file: "We found a problem with some content in 'V_NBCORE.xlsx. Do you want us to try and recover...."
If I put in 'Sheet1' instead of 'Summary' the code runs but I get a message that Sheet1 doesn't exist (I renamed it). In this case I can open the file and see the chart there but with no data. If I create an extra blank sheet which comes out as 'Sheet3' in my program and then use that name it works and doesn't give the error but of course there is no data.
If I leave my summary sheet with the default name which would be 'Sheet2' and then try to use Sheet2 here I get the same failure mode as using my chosen name of 'Summary'.
As you see I also tried getting the sheet name and using that but it behaves the same as using my name directly. I've tried double quotes, single quotes and single quotes around the name, all of which I've seen on-line.
I've pasted the relevant bits of code here. This is part of a much larger program and not meant to be stand alone.
The text was updated successfully, but these errors were encountered: