Skip to content
New issue

Have a question about this project? Sign up for a free GitHub account to open an issue and contact its maintainers and the community.

By clicking “Sign up for GitHub”, you agree to our terms of service and privacy statement. We’ll occasionally send you account related emails.

Already on GitHub? Sign in to your account

Apply customized dendrogram to heatmap #305

Closed
stingo93 opened this issue Apr 30, 2019 · 16 comments
Closed

Apply customized dendrogram to heatmap #305

stingo93 opened this issue Apr 30, 2019 · 16 comments

Comments

@stingo93
Copy link

Hey,
I was wondering how to apply my customized dendrogram to the heatmap. I first generated a heatmap with specified clustering method in Heatmap commend:

Heatmap(matrix_new, cluster_columns =T, cluster_rows=F, clustering_distance_columns = "pearson", clustering_method_columns = "ward.D")

Then, I customized the dendrogram using the following codes

hc <- hclust(as.dist(1-cor(t(sample.norm[,1:18]),method="pearson")),method="ward.D")
dd <- as.dendrogram(hc)
dd.reorder = reorder(dd, c(rep(10, 22),rep(9,27),rep(1,49)), agglo.FUN = mean)

When I plot the customized dendrogram, it did changed into the way I want. And I assigned the customized dendrogram to the heatmap I created at the first:

Heatmap(matrix_new, cluster_columns = dd.reorder, cluster_rows=F)

However, the dendrograms in two heatmaps did not change. I am not sure what went wrong, and come here for some help. Any advise?

Thanks,
Stingo

@stingo93 stingo93 changed the title Apply custom dendrogram to heatmap Apply customized dendrogram to heatmap Apr 30, 2019
@jokergoo
Copy link
Owner

jokergoo commented May 2, 2019

Hi, can you send me all these R objects that you use in your code (e.g. matrix_new, matrix_norm, ...) so that I can have a test?

@GScala
Copy link

GScala commented Jun 11, 2019

Hi, I'm experiencing a similiar (if not the same) problem here.
When I pass a custom dendrogram using the cluster_columns arguments to the Heatmap function, the ordering of the columns does not change at all.
Here is some code that reproduces my issue:

mat <- matrix(c(5, 2.28, 2.06, -3.53,-3.53,-3.53, -5,-3,-2.3,3,3.82, 3.82,-5,-2.36,-3.23,3.82,-3.53,-3.53, -5,-1.15,-2,0, 0.92,-0.92, -5,-2.54,-2.30,0, -3.53,-3.53,5,3, 2.37, -3.53, -3.53,-3.53), nrow = 6, ncol = 6, byrow = T, dimnames = list(paste0("row_",c("A","B","C","D","E","F")), paste0("col_",c("A","B","C","D","E","F"))))

#reorder the dendrogram with rotate from dendextend package
col_order = 1:6
column_dend = as.dendrogram(hclust(dist(t(mat))))
column_dend = dendextend::rotate(column_dend,col_order)

plot(column_dend)

cluster_columns = column_dend
#cluster_columns is of class dendrogram as required by the function
class(cluster_columns)

ht1 <- Heatmap(mat, cluster_rows = F, cluster_columns = cluster_columns, show_heatmap_legend = TRUE)

draw(ht1, heatmap_legend_side = "top")

Here I was expecting in the heatmap the same column order as in plot(column_dend).
Do you have any suggestion?

Thanks very much for the help.
Giovanni.

@jokergoo
Copy link
Owner

@GScala I tried your code and they look the same:

image

Maybe you need to try the newest version of the package, or at least >= 1.99.0

@GScala
Copy link

GScala commented Jun 11, 2019

Hi,
it was actually a package version problem.
I upgraded the package to the latest version and now it works.
Thank you very much for your help!

@alimayy
Copy link

alimayy commented Jun 24, 2022

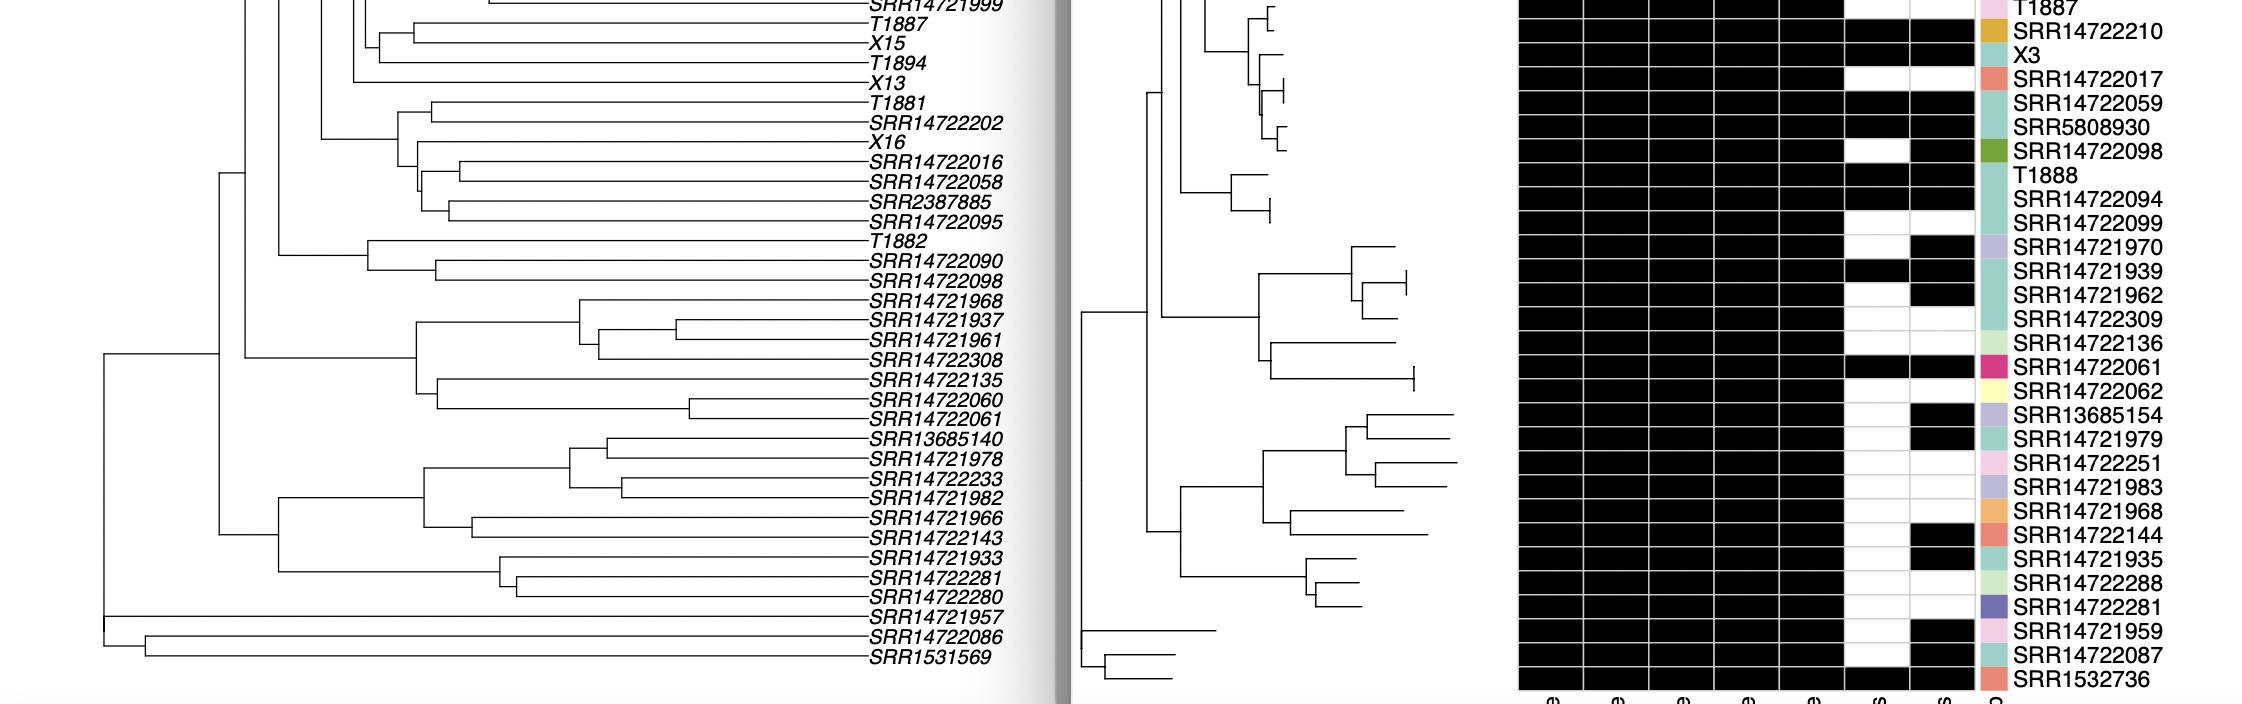
hi @jokergoo , I cannot get this to work. My situation:

I have a matrix composed of m rows (assume they're strains) and n columns (assume they're genes). Assume I have gene presence absence data for samples (m x n matrix). Assume also that I have a clustering (dendrogram) of strains (m) based on another dataset than the gene absence/presence matrix. Assume that for the genes (n) I have a separate clustering (dendrogram) too, generated using by a third, separate dataset (e.g. gene similarity).

First I sort the matrix I want to plot as a heatmap based on the dendrogram labels

strain_order <- row.names(t(sample_dataframe))[rev(order.hclust(samples.dist.clus))]
gene_order <- labels(gene_clustering)

mat_to_plot <- mydataframe[strain_order, gene_order]


The gene presence/absence data where the rows and columns sorted with respect to the order in the dendrograms mentioned above looks like this

ComplexHeatmap::Heatmap(as.matrix(mat_to_plot),
                           show_row_names = F,
                           show_column_names = F,
                           cluster_rows = F,
                           cluster_columns = F,
                           name="Phage-host interactions",
                           col = colorRampPalette(c('black', 'green'))(2),
                           show_column_dend = F,
                           show_row_dend = F )

image
Note that it starts with sample ST-21 and ends with ST-139, which is the correct order given the sample dendrogram mentioned above.

When I include the dendrograms in the plot:

ComplexHeatmap::Heatmap(as.matrix(mat_to_plot),
                        show_row_names = T,
                        show_column_names = F,
                        cluster_columns = as.dendrogram(gene_clustering_based_on_prank_alignment),
                        cluster_rows = as.dendrogram(sample_hclust_clustering),
                        name="Phage-host interactions",
                        col = colorRampPalette(c('black', 'green'))(2),
                        show_column_dend = T,
                        show_row_dend = T )

I get a dendrogram where the columns and rows are sorted differently (note that the first now now is ST-182 and the last row is ST-247)
image

so the dendrograms are correctly plotted, but the order of rows and columns are wrong, resulting in a different heatmap than the first one.

Is there a way I can plot the dendrograms and still get the first heatmap?

@jokergoo
Copy link
Owner

In the first heatmap, you didn't apply clustering, and in the second heatmap, you applied clustering. Clustering changes the row orders and columns. It is expected the order your rows change accordingly.

@alimayy
Copy link

alimayy commented Aug 15, 2022

@jokergoo I don't get it. In the first heatmap above, the rows and columns are pre-sorted based on the order of labels of the dendrograms plotted in the second heatmap (see the variables strain_order and gene_order first code block). That's why the unclustered heatmap of mat_to_plot (the first heatmap) shows some clustering (green blocks).

In the second heatmap where the dendrograms are plotted, although the dendrograms themselves are plotted correctly, the order of rows and columns shown don't match the order obtained by

strain_order <- row.names(t(sample_dataframe))[rev(order.hclust(samples.dist.clus))]
gene_order <- labels(gene_clustering)

and therefore the clusters in the first heatmap aren't observed anymore. I don't think this is expected behavior?

@metalichen
Copy link

metalichen commented Aug 25, 2022

Hi @jokergoo,
I have the same problem. The dendrogram is plotted correctly, but the row order doesn't match it. On the screen grab, the left part is the same dendrogram plotted via plot(as.phylo(as.hclust(row_clust))), and the right part is the heatmap. The dendrogram topology is the same, but the row labels are off. And it seems that the heatmap row labels are like one position off on the alphabetized list? For example, 'T1882' on the left becomes 'T1888' on the right, and 'SRR14722090' -> 'SRR14722094'.
The command I used was

Heatmap(M2, show_row_names = T, show_column_names = T, name = " ",
                      column_order = column_order_vector,
                     cluster_rows = row_clust,
                      right_annotation = ra)

Screen Shot 2022-08-24 at 10 33 57 PM

I'd appreciate any help. Thanks!

@jokergoo
Copy link
Owner

jokergoo commented Sep 1, 2022

@alimayy sorry I didn't read your replies carefully.

In your code:

ComplexHeatmap::Heatmap(as.matrix(mat_to_plot),
                        show_row_names = T,
                        show_column_names = F,
                        cluster_columns = as.dendrogram(gene_clustering_based_on_prank_alignment),
                        cluster_rows = as.dendrogram(sample_hclust_clustering),
                        name="Phage-host interactions",
                        col = colorRampPalette(c('black', 'green'))(2),
                        show_column_dend = T,
                        show_row_dend = T )

mat_to_plot has already been sorted, but you also provide gene_clustering_based_on_prank_alignment and sample_hclust_clustering again. And actually the mat_to_plot will be sorted again.

If you want the same plot as the first one, you need to use the original mydataframe and suppress reordering of dendrograms:

Heamtap(mydataframe, ..., row_dend_reorder = FALSE, column_dend_reorder = FALSE)

@jokergoo
Copy link
Owner

jokergoo commented Sep 1, 2022

@metalichen ComplexHeatmap mainly works with the dendrogram object and I haven't tested with other tree objects such phylo. If you can send me you phylo object and the matrix, I can have a test and support it.

@metalichen
Copy link

@jokergoo sorry, should have specified - my row_clust is a dendrogram object, I only used phylo for visualizing the dendrogram independently of ComplexHeatmaps.

I attached the matrix, and the dendrogram, as a Newick file. Thanks!

matrix.txt
dendrogram.txt

@jokergoo
Copy link
Owner

jokergoo commented Sep 1, 2022

@metalichen Do you use ape::read.tree() to read the Newick file?

@metalichen
Copy link

@jokergoo I used

row_clust = DECIPHER::ReadDendrogram("~/Downloads/dendrogram.txt",keepRoot = T)

@jokergoo
Copy link
Owner

jokergoo commented Sep 1, 2022

@metalichen

There are several points when using phylo objects that need to be taken care of:

  1. if a dendrogram is calculated from a matrix, the order in the dendrogram can always be correspond to the matrix.
  2. for the phylo object, there is no "real" order information there. There is only leaf label information in the object.
  3. if a phylo object can be converted to a hclust than a dendrogram object, the "numeric" order is normally not the same as in the matrix. I mean an order of 1 in the converted dendrogram does not correspond to the first row of the matrix, while it only correspond to the first leaf node in the phylogenetic tree.
> head(order.dendrogram(row_clust))
[1] 272  87 255 281 210 104
> head(labels(row_clust))
[1] "SRR14722310" "SRR14721979" "SRR14722289" "SRR14722326" "SRR14722151"
[6] "SRR14722000"
> rownames(m)[head(order.dendrogram(row_clust))]
[1] "SRR14722311" "SRR14721980" "SRR14722290" "SRR14722329" "SRR14722154"
[6] "SRR14722002"

If the correspondance is correct, head(labels(row_clust)) should be the same as rownames(m)[head(order.dendrogram(row_clust))].

There are several ways I can think of to support phylo objects:

  1. adjust the tree by corresponding leaf labels and matrix row names, i.e. by character indicies.
  2. adjust the orders of the dendrogram coverted from phylo object (can use dendextend::order_dendrogram<-)
  3. write an internally grid.phylo() to directly work with the phylo object.

Once I finish these implementations, I will let you know.

@jokergoo jokergoo mentioned this issue Sep 1, 2022
31 tasks
@metalichen
Copy link

makes sense! thanks

@alimayy
Copy link

alimayy commented Sep 10, 2022

@alimayy sorry I didn't read your replies carefully.

In your code:

ComplexHeatmap::Heatmap(as.matrix(mat_to_plot),
                        show_row_names = T,
                        show_column_names = F,
                        cluster_columns = as.dendrogram(gene_clustering_based_on_prank_alignment),
                        cluster_rows = as.dendrogram(sample_hclust_clustering),
                        name="Phage-host interactions",
                        col = colorRampPalette(c('black', 'green'))(2),
                        show_column_dend = T,
                        show_row_dend = T )

mat_to_plot has already been sorted, but you also provide gene_clustering_based_on_prank_alignment and sample_hclust_clustering again. And actually the mat_to_plot will be sorted again.

If you want the same plot as the first one, you need to use the original mydataframe and suppress reordering of dendrograms:

Heamtap(mydataframe, ..., row_dend_reorder = FALSE, column_dend_reorder = FALSE)

That worked, thanks @jokergoo !

Sign up for free to join this conversation on GitHub. Already have an account? Sign in to comment
Labels
None yet
Projects
None yet
Development

No branches or pull requests

5 participants