
- 这篇文章需要了解istio,k8s,golang,envoy,mixer基础知识
- 分析的环境为k8s,istio版本为0.8.0
这篇文章主要介绍mixer提供的一个GRPC接口,这个接口负责接收envoy上报的日志,并将日志在stdio和prometheus展现出来。 “遥测报告”这个词是从istio的中文翻译文档借过来,第一次听到这个词感觉很陌生,很高大上。通过了解源码,用 “日志订阅“ 这个词来理解这个接口的作用会容易点。用一句话来总结这个接口的功能:我有这些日志,你想用来做什么?stdio和prometheus只是这些日志的另一种展示形式。
istio.io/istio/mixer/pkg/api/grpcServer.go #187
func (s *grpcServer) Report(legacyCtx legacyContext.Context, req *mixerpb.ReportRequest) (*mixerpb.ReportResponse, error) {
  ......
  var errors *multierror.Error
  for i := 0; i < len(req.Attributes); i++ {
    ......
    if i > 0 {
      if err := accumBag.UpdateBagFromProto(&req.Attributes[i], s.globalWordList); err != nil {
        ......
        break
      }
    }
    ......
    if err := s.dispatcher.Preprocess(newctx, accumBag, reportBag); err != nil {
      ......
    }
    ......
    if err := reporter.Report(reportBag); err != nil {
      ......
      continue
    }
    ......
  }
  ......
  if err := reporter.Flush(); err != nil {
    errors = multierror.Append(errors, err)
  }
  reporter.Done()
  ......
  return reportResp, nil
}
Report接口的第二个参数是envoy上报给mixer的数据。下面的数据来源:把日志打印到终端后再截取出来。
istio.io/api/mixer/v1/report.pb.go #22
type ReportRequest struct {
  ......
  Attributes []CompressedAttributes `protobuf:"bytes,1,rep,name=attributes" json:"attributes"`
  ......
  DefaultWords []string
  ......
  GlobalWordCount uint32 `protobuf:"varint,3,opt,name=global_word_count,json=globalWordCount,proto3" json:"global_word_count,omitempty"`
}
req.Attributes:
[{"strings":{"131":92,"152":-1,"154":-2,"17":-7,"18":-4,"19":90,"22":92},"int64s":{"1":33314,"151":8080,"169":292,"170":918,"23":0,"27":780,"30":200},"bools":{"177":false},"timestamps":{"24":"2018-07-05T08:12:20.125365976Z","28":"2018-07-05T08:12:20.125757852Z"},"durations":{"29":426699},"bytes":{"0":"rBQDuw==","150":"AAAAAAAAAAAAAP//rBQDqg=="},"string_maps":{"15":{"entries":{"100":92,"102":-5,"118":113,"119":-3,"31":-4,"32":90,"33":-7,"55":134,"98":-6}},"26":{"entries":{"117":134,"35":136,"55":-9,"58":110,"60":-8,"82":93}}}}]
req.DefaultWords :
["istio-pilot.istio-system.svc.cluster.local","kubernetes://istio-pilot-8696f764dd-fqxtg.istio-system","1000","rds","3a7a649f-4eeb-4d70-972c-ad2d43a680af","172.00.00.000","/v1/routes/8088/index/sidecar~172.20.3.187~index-85df88964c-tzzds.default~default.svc.cluster.local","Thu, 05 Jul 2018 08:12:19 GMT","780","/v1/routes/9411/index/sidecar~172.00.00.000~index-85df88964c-tzzds.default~default.svc.cluster.local","bc1f172f-b8e3-4ec0-a070-f2f6de38a24f","718"]
req.GlobalWordCount:
178
第一次看到这些数据的时候满脑子问号,和官网介绍的属性词汇一点关联都看不到。在这些数据里我们最主要关注Attributes下的类型:
strings,int64s......和那些奇怪的数字。下面会揭开这些谜团。

istio.io/istio/mixer/pkg/attribute/list.gen.go #13
globalList = []string{
    "source.ip",
    "source.port",
    "source.name",
    ......
}
istio.io/istio/mixer/pkg/attribute/mutableBag.go #3018
func (mb *MutableBag) UpdateBagFromProto(attrs *mixerpb.CompressedAttributes, globalWordList []string) error {
  messageWordList := attrs.Words
  ......
  lg("  setting string attributes:")
  for k, v := range attrs.Strings {
    name, e = lookup(k, e, globalWordList, messageWordList)
    value, e = lookup(v, e, globalWordList, messageWordList)
    if err := mb.insertProtoAttr(name, value, seen, lg); err != nil {
      return err
    }
  }
  lg("  setting int64 attributes:")
  ......
  lg("  setting double attributes:")
  ......
  lg("  setting bool attributes:")
  ......
  lg("  setting timestamp attributes:")
  ......
  lg("  setting duration attributes:")
  ......
  lg("  setting bytes attributes:")
  ......
  lg("  setting string map attributes:")

  ......
  return e
}
Istio属性是强类型,所以在数据转换会根据类型一一转换。从上图可以看出由
DefaultWords和globalList组成一个词典,而Attributes记录了上报数据的位置,经过UpdateBagFromProto的处理,最终转换为:官方的属性词汇。
connection.mtls               : false
context.protocol              : http
destination.port              : 8080
......
request.host                  : rds
request.method                : GET
......
这个方法在k8s环境下的结果是追加数据
istio.io/istio/mixer/template/template.gen.go #33425
outBag := newWrapperAttrBag(
  func(name string) (value interface{}, found bool) {
    field := strings.TrimPrefix(name, fullOutName)
    if len(field) != len(name) && out.WasSet(field) {
      switch field {
      case "source_pod_ip":
        return []uint8(out.SourcePodIp), true
      case "source_pod_name":
        return out.SourcePodName, true
        ......
      default:
        return nil, false
      }
    }
    return attrs.Get(name)
  }
  ......
)
return mapper(outBag)
destination.labels            : map[istio:pilot pod-template-hash:4252932088]
destination.namespace         : istio-system
......
Report会把数据分发到Variety = istio_adapter_model_v1beta1.TEMPLATE_VARIETY_REPORT的Template里,当然还有一些过滤条件,在当前环境下会分发到logentry和Metric。
istio.io/istio/mixer/pkg/runtime/dispatcher/session.go #105
func (s *session) dispatch() error {
  ......
  for _, destination := range destinations.Entries() {
    var state *dispatchState
    if s.variety == tpb.TEMPLATE_VARIETY_REPORT {
      state = s.reportStates[destination]
      if state == nil {
        state = s.impl.getDispatchState(ctx, destination)
        s.reportStates[destination] = state
      }
    }

    for _, group := range destination.InstanceGroups {
      ......
      for j, input := range group.Builders {
        ......
        var instance interface{}
        //把日志绑定到 Template里
        if instance, err = input.Builder(s.bag); err != nil{
          ......
          continue
        }
        ......
        if s.variety == tpb.TEMPLATE_VARIETY_REPORT {
          state.instances = append(state.instances, instance)
          continue
        }
        ......
      }
    }
  }
  ......
  return nil
}
Flush是让
logentry和Metric调用各自的adapter对数据进行处理,由于各自的adapter没有依赖关系所以这里使用了golang的协程进行异步处理。
istio.io/istio/mixer/pkg/runtime/dispatcher/session.go #200
func (s *session) dispatchBufferedReports() {
    // Ensure that we can run dispatches to all destinations in parallel.
    s.ensureParallelism(len(s.reportStates))

    // dispatch the buffered dispatchStates we've got
    for k, v := range s.reportStates {
        //在这里会把 v 放入协程进行处理
      s.dispatchToHandler(v)
      delete(s.reportStates, k)
    }
    //等待所有adapter完成
    s.waitForDispatched()
}
从上面看到
v被放入协程进行处理,其实mixer在这里使用了协程池。使用协程池可以减少协程的创建和销毁,还可以控制服务中协程的多少,从而减少对系统的资源占用。mixer的协程池属于提前创建一定数量的协程,提供给业务使用,如果协程池处理不完业务的工作,需要阻塞等待。下面是mixer使用协程池的步骤。
- 初始化协程池
建立一个有长度的
channel,我们可以叫它队列。
istio.io/istio/mixer/pkg/pool/goroutine.go
func NewGoroutinePool(queueDepth int, singleThreaded bool) *GoroutinePool {
  gp := &GoroutinePool{
    queue:          make(chan work, queueDepth),
    singleThreaded: singleThreaded,
  }

  gp.AddWorkers(1)
  return gp
}
- 把任务放入队列
把可执行的函数和参数当成一个任务放入队列
func (gp *GoroutinePool) ScheduleWork(fn WorkFunc, param interface{}) {
    if gp.singleThreaded {
        fn(param)
    } else {
        gp.queue <- work{fn: fn, param: param}
    }
}
- 让工人工作
想要用多少工人可以按资源分配,工人不断从队列获取任务执行
func (gp *GoroutinePool) AddWorkers(numWorkers int) {
  if !gp.singleThreaded {
    gp.wg.Add(numWorkers)
    for i := 0; i < numWorkers; i++ {
      go func() {
        for work := range gp.queue {
          work.fn(work.param)
        }
        gp.wg.Done()
      }()
    }
  }
}
- 和
adapter交互
每个
Template都有自己的DispatchReport,它负责和adapter交互,并对日志进行展示。
istio.io/istio/mixer/template/template.gen.go #1311
logentry.TemplateName: {
    Name:  logentry.TemplateName,
    Impl:  "logentry",
    CtrCfg:   &logentry.InstanceParam{},
    Variety:  istio_adapter_model_v1beta1.TEMPLATE_VARIETY_REPORT,
    ......
    DispatchReport: func(ctx context.Context, handler adapter.Handler, inst []interface{}) error {
        ......
        instances := make([]*logentry.Instance, len(inst))
        for i, instance := range inst {
          instances[i] = instance.(*logentry.Instance)
        }

        // Invoke the handler.
        if err := handler.(logentry.Handler).HandleLogEntry(ctx, instances); err != nil {
            return fmt.Errorf("failed to report all values: %v", err)
        }
        return nil
    },
}
- 日志数据整理
istio.io/istio/mixer/adapter/stdio/stdio.go #53
func (h *handler) HandleLogEntry(_ context.Context, instances []*logentry.Instance) error {
    var errors *multierror.Error

    fields := make([]zapcore.Field, 0, 6)
    for _, instance := range instances {
      ......
      for _, varName := range h.logEntryVars[instance.Name] {
          //过滤adapter不要的数据
        if value, ok := instance.Variables[varName]; ok {
            fields = append(fields, zap.Any(varName, value))
        }
      }
      if err := h.write(entry, fields); err != nil {
          errors = multierror.Append(errors, err)
      }
      fields = fields[:0]
    }
    return errors.ErrorOrNil()
}
每个
adapter都有自己想要的数据,这些数据可在启动文件istio-demo.yaml下配置。
apiVersion: "config.istio.io/v1alpha2"
    kind: logentry
    metadata:
      name: accesslog
      namespace: istio-system
    spec:
      severity: '"Info"'
      timestamp: request.time
      variables:
        originIp: origin.ip | ip("0.0.0.0")
        sourceIp: source.ip | ip("0.0.0.0")
        sourceService: source.service | ""
        ......
- 展示结果
下面日志从mixer终端截取
{"level":"info","time":"2018-07-15T09:27:30.739801Z","instance":"accesslog.logentry.istio-system","apiClaims":"",
"apiKey":"","apiName":"","apiVersion":"","connectionMtls":false,"destinationIp":"10.00.0.00",
"destinationNamespace":"istio-system"......}
通过分析这个接口源码我们发现了一些问题:
- 接口需要处理完所有
adapter才响应返回 - 如果协程池出现阻塞,接口需要一直等待
基于以上二点我们联想到:如果协程池出现阻塞,这个接口响应相应会变慢,是否会影响到业务的请求?从国人翻译的一篇istio官方博客Mixer 和 SPOF 的迷思里知道,envoy数据上报是通过“fire-and-forget“模式异步完成。但由于没有C++基础,所以我不太明白这里面的“fire-and-forget“是如何实现。
因为存在上面的疑问,所以我们进行了一次模拟测试。这次测试的假设条件:接口出现了阻塞,分别延迟了50ms,100ms,150ms,200ms,250ms,300ms【模拟阻塞时间】,在相同压力下,观察对业务请求是否有影响。
- 环境: mac Air 下的 docker for k8s
- 压测工具:hey
- 压力:-c 50 -n 200【电脑配置不高】
- 电脑配置 i5 4G
- 压测命令:hey -c 50 -n 200 http://127.0.0.1:30935/sleep
- 被压测的服务代码
- mixer接口添加延迟代码:
func (s *grpcServer) Report(legacyCtx legacyContext.Context, req *mixerpb.ReportRequest) (*mixerpb.ReportResponse, error) {
    time.Sleep(50 * time.Microsecond)
    ......
    return reportResp, nil
}
压测的每个数据结果都是经过预热后,压测10次并从中获取中位数得到。
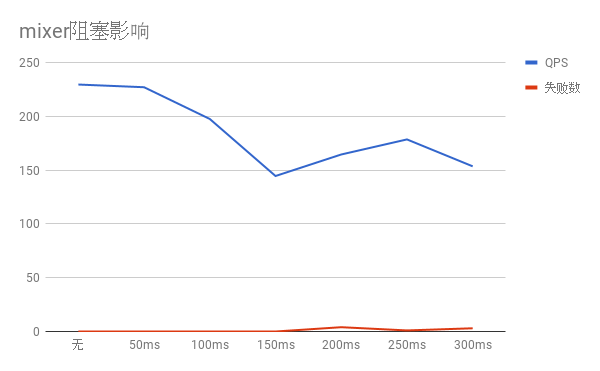
从上图我们可以看出随着延迟的增加,业务处理的QPS也在下降。这说明在当前0.8.0版本下,协程池处理任务不够快【进比出快】,出现了阻塞现象,会影响到业务的请求。当然我们可以通过横向扩展mixer或增加协程池里的工人数量来解决。但是我觉得主要的问题出在阻塞这步上。如果没有阻塞,就不会影响业务。
与Jaeger相互借鉴,避免阻塞
这里日志数据处理场景和之前了解的Jaeger很像。Jaeger和mixer处理的都是日志数据,所以它们之间可以相互借鉴。Jaeger也有它自己的协程池,而且和mixer的协程池思想是一样的,虽然实现细节不一样。那如果遇到进比出快的情况Jaeger是如何处理的呢?具体的场景可以看这里。
github.com/jaegertracing/jaeger/pkg/queue/bounded_queue.go #76
func (q *BoundedQueue) Produce(item interface{}) bool {
    if atomic.LoadInt32(&q.stopped) != 0 {
        q.onDroppedItem(item)
        return false
    }
    select {
    case q.items <- item:
        atomic.AddInt32(&q.size, 1)
        return true
    default:
        //丢掉数据
        if q.onDroppedItem != nil {
            q.onDroppedItem(item)
        }
        return false
    }
}
上面是Jaeger的源码,这里和mixer 的
ScheduleWork相对应,其中一个区别是如果Jaeger的队列items满了,还有数据进来,数据将会被丢掉,从而避免了阻塞。这个思路也可以用在mixer的日志处理上,牺牲一些日志数据,保证业务请求稳定。毕竟业务的位置是最重要的。