This repository has been archived by the owner on Jan 26, 2022. It is now read-only.
Debug Protocol Overview #64
Labels
documentation
Improvements or additions to documentation
Milestone
Comments
|
cc @KsavinN Let me know if something isn't clear, and we can update the diagram. |
|
Awesome! That will be super useful for kernel authors who want to support debugging! I think it would be nice to add it to the kernel protocol documentation once the "extended" debug protocol has been adopted. |
|
Definitely 👍 |
|
Adding some documentation on how to inspect the debug messages sent in VS Code. This can be useful to understand when debug requests are made (for example triggered by a UI action). Create launch.jsonFirst step is to create a test file and a debug configuration:
{
    "version": "0.2.0",
    "configurations": [
        {
            "name": "Python: Current File",
            "type": "python",
            "request": "launch",
            "program": "${file}",
            "console": "integratedTerminal",
            "env": {"PTVSD_LOG_DIR": "/path/to/logs/folder"}
        }
    ]
}EDIT: recent versions of VS Code are now using debugpy. The launch configuration must then be changed to using the {
"version": "0.2.0",
"configurations": [
{
"name": "Python: Current File",
"type": "python",
"request": "launch",
"program": "${file}",
"console": "integratedTerminal",
"env": {"DEBUGPY_LOG_DIR": "/path/to/logs/folder"}
}
]
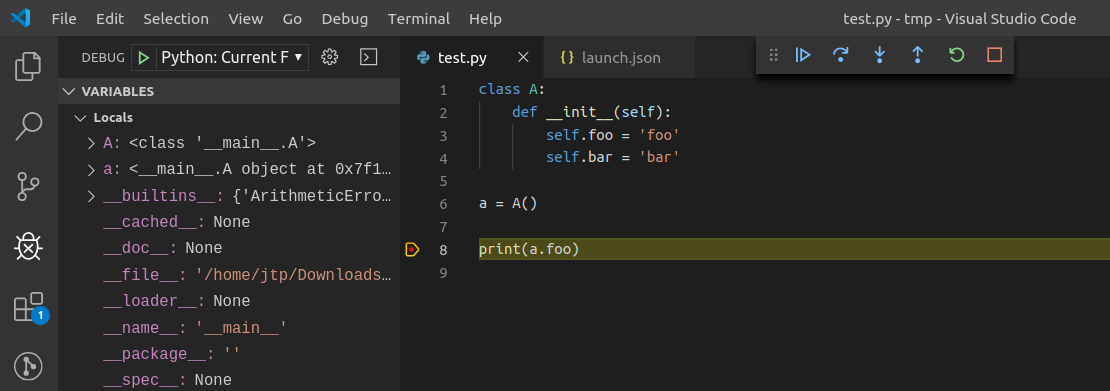
}Start the debugger
Open the logsThe content of the log file look like this: With:
Overview
|

17 tasks
This was referenced Jul 20, 2020
Sign up for free
to subscribe to this conversation on GitHub.
Already have an account?
Sign in.
Adding a quick overview of the debug protocol, so it's easier to visualize the types of messages sent between the JupyterLab extension and the kernel.
It only shows a subset of the messages for now, but can be extended to also include the calls to
continue,stepInanddisconnect.This also show new messages that are not part of the Debug Adapter Protocol (DAP), such as
dumpCell.Diagram
TODO
debug_info_requestReferences
Source
Generated using: https://bramp.github.io/js-sequence-diagrams/
Diagram source
The text was updated successfully, but these errors were encountered: