1.0 release #31
Comments
|
Yes, I agree! |
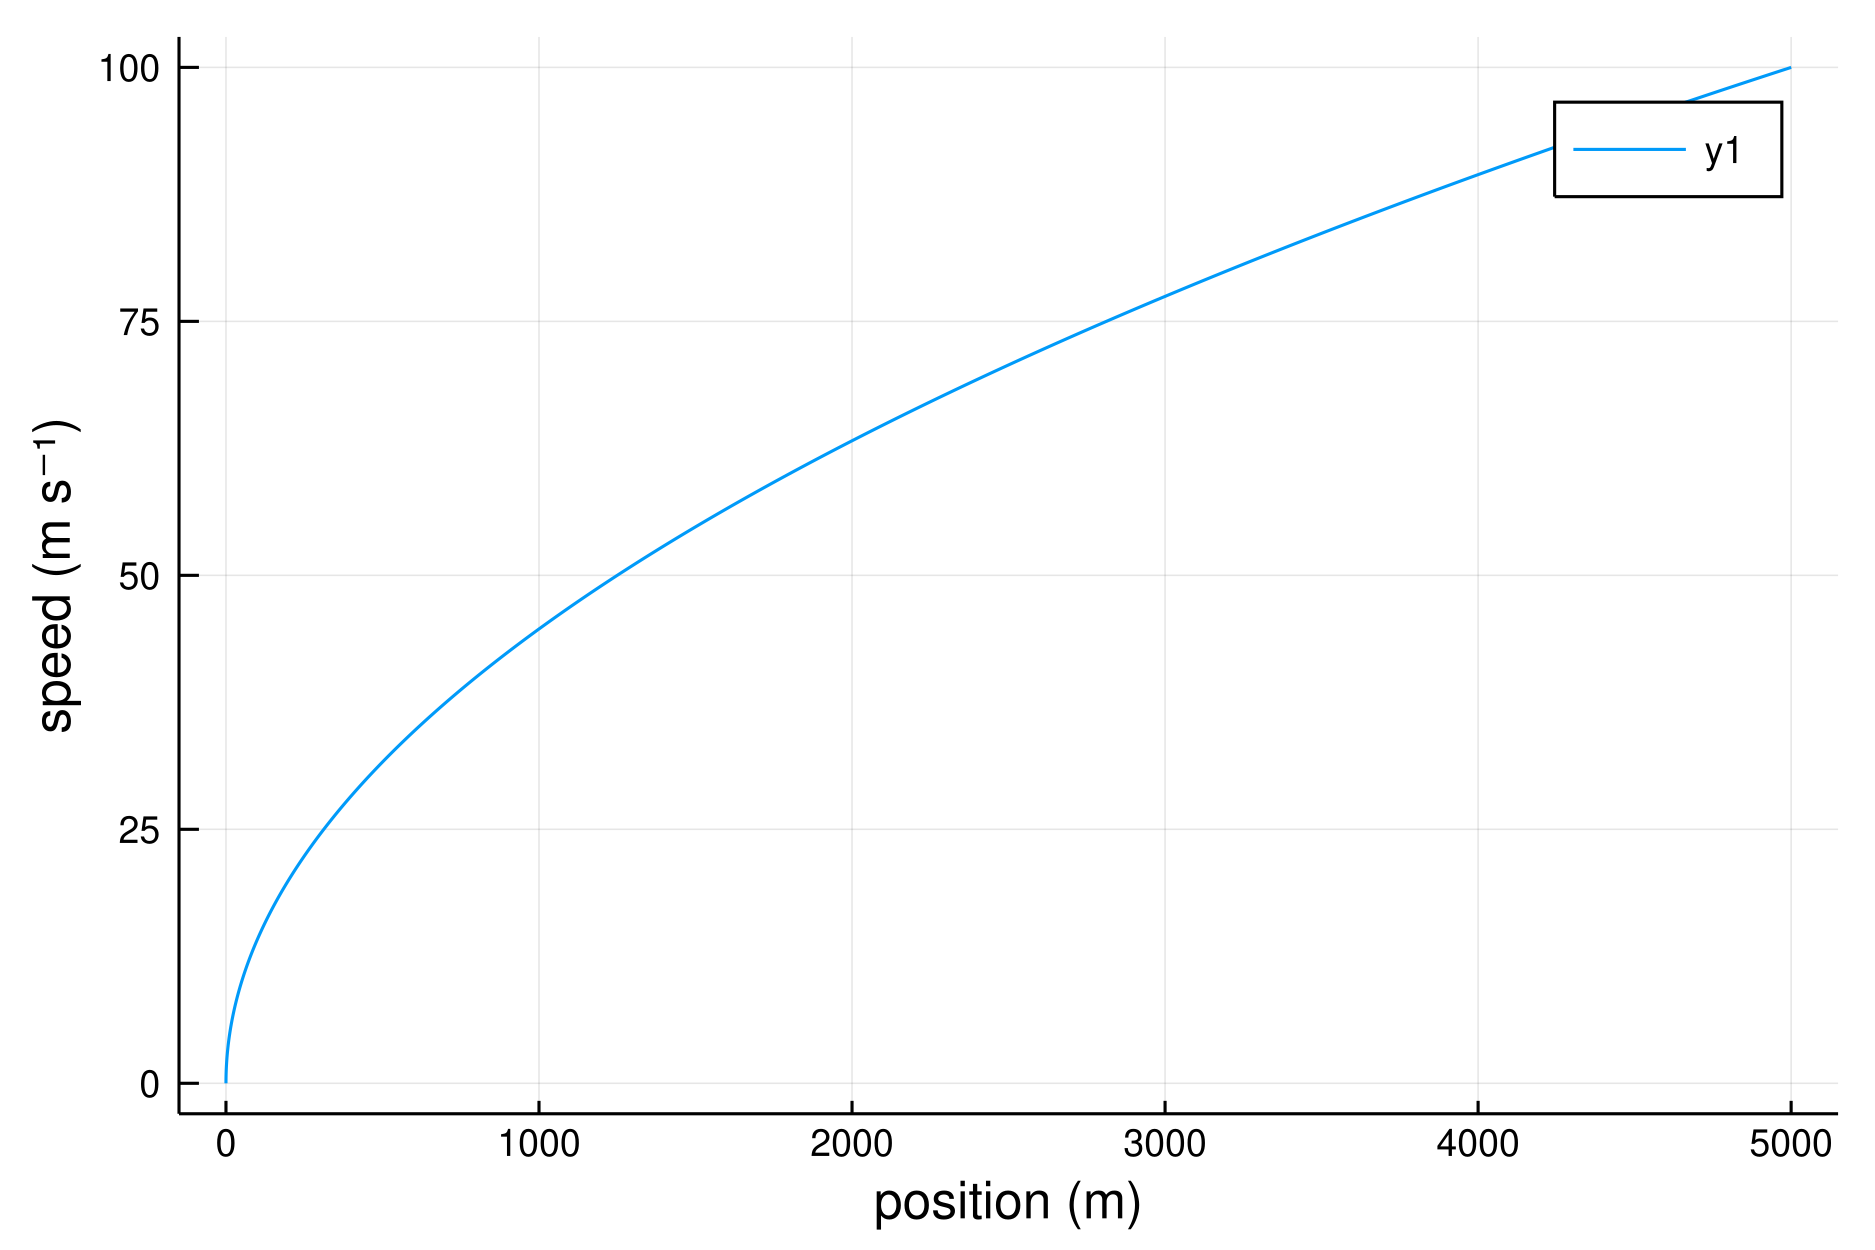
[ANN] UnitfulRecipes.jl 1.0@briochemc and myself are happy to announce UnitfulRecipes.jl 1.0. UnitfulRecipes.jl provides recipes for plotting figures (Plots.jl) when using data with units (Unitful.jl). using Unitful, UnitfulRecipes, Plots
const a = 1u"m/s^2"
v(t) = a * t
x(t) = a/2 * t^2
t = (0:0.01:100)*u"s"
plot(x.(t), v.(t), xlabel="position", ylabel="speed")should give something like
UnitfulRecipes.jl also interoperates well with the wider ecosystem: using Plots, UnitfulRecipes, Unitful, UnitfulMoles, Measurements
x = collect(-10:2:30) * u"°C"
y = (50 .+ 10atan.(ustrip.(x)/10) .± 3rand.(length(x))) * u"molC/molP"
plot(x, y, ylabel="Organic matter C:P", xlabel="Water temperature", label="")
Head over to the documentation for more examples! |

|
Does that sound good for a discourse announcement @briochemc ? |
|
Yes, of course! Maybe give this example too to say that it also combines well with the recently released UnitfulMoles.jl and other packages like Measurments.jl? using Plots, UnitfulRecipes, Unitful, UnitfulMoles, Measurements
x = collect(-10:2:30) * u"°C"
y = (50 .+ 10atan.(ustrip.(x)/10) .± 3rand.(length(x))) * u"molC/molP"
plot(x, y, ylabel="Organic matter C:P", xlabel="Water temperature", label="")should give something like
|

|
I edited my post, see above. |
Sign up for free
to join this conversation on GitHub.
Already have an account?
Sign in to comment
@briochemc I think this package is pretty stable and we can do an 1.0 release. What do you think?
The text was updated successfully, but these errors were encountered: