This dev-guide introduces how to integrate your custom workflow into your Kaapana platform. By doing so, you can leverage Kaapana's infrastructure and extend the platforms capabilities to process data with your workflow. The platform's data (provided by Kaapana's storage stack<store>) can be explored and curated to specific datasets in the "Datasets" view, or further inspected via the Meta-Dashboard. In order to integrate your custom workflow, we will use the python API for Apache Airflow to create Directed Acyclic Graphs (DAGs).
Aim: In this chapter we create a DAG that converts DICOMs to .nrrd-files.
Hint
DAGs are stored on the host machine inside the subdirectory workflows/dags of the FAST_DATA_DIR. By default FAST_DATA_DIR=/home/kaapana. In this directory any file that defines a dag is automatically identified and the DAG is available on the platform.
In order to deploy a new DAG that converts DICOMs to .nrrd-files, create a file called dag_example_dcm2nrrd.py inside the dags-folder with the following content. You can add this file either directly to the folder, if you have access to the host machine or use the internal code server of Kapaana. You can install the code-server-chart in the extensions tab and open it with the blue icon right next to it.
../../../templates_and_examples/examples/processing-pipelines/example/extension/docker/files/dag_example_dcm2nrrd.py
That's it basically. Now we can check if the DAG is successfully added to Airflow and then we can test our workflow!
- Go to Sytem -> Airflow and check if your newly added DAG
example-dcm2nrrdappears in the DAG list (it might take up to five minutes until airflow recognizes the DAG! Alternatively you could restart the Airflow Pod in Kubernetes) - If there is an error in the created DAG file like indexing, library imports, etc., you will see an error at the top of the Airflow page
- Go to the Workflows -> Workflow Execution
- Select your workflow from the workflow drop-down menu
- Optionally set a custom workflow name for your workflow execution
- Select an available dataset from the dataset drop-down menu
- Submit your workflow to start the execution
- You will be redirected to the Workflow List view, where your workflow run
example-dcm2nrrd-<workflow-id>is visualized as an additional row with further details about the workflow and jobs which are running as part of your workflow. - If everything was successful you can go to Store -> Minio where you will find a bucket called
example-dcm2nrrd. Inside this folder you will find the.nrrdfiles of the selected images.
Aim: Create a new operator that executes a processing algorithm. Create a DAG that utilizes this new operator.
We will focus on the development of the algorithm directly on the Kaapana platform. This means we will utilize the functionality of Kaapana to start a code-server that mounts files from within the container, where the algorithm should run. We will use this code-server to develop the algorithm directly in the environment of this container. The subsection alternative_local_development explains how the environment in the container can be mimiced in order to develop an algorithm locally.
In this example the algorithm is a script that extracts the study id of a DICOM study. We embed this algorithm into a DAG, that performs the following tasks:
- Get dicom data from the Kaapana PACS
- Extract the study ids
- Save the study ids as a json file into a minio bucket
- Clean the workflow directory
We will develop the DAG in the following steps:
- Build an empty base image and push it to the private registry
- Create an operator that pulls this image and starts the container. Create the DAG file that executes the operator
- Start the workflow, enter the code-server via Pending Applications and develop the processing algorithm
- Adjust the image from step 1 to execute the algorithm developed in step 3. Build and push again
To develop an algorithm within a container we have to provide an image to start with. Since we provide the algorithm as a python script, we start with a minimal python image:
FROM local-only/base-python-cpu:latest
LABEL IMAGE="python-template"
LABEL VERSION="0.1.0"
LABEL BUILD_IGNORE="True"
Important
To access the base images for our container (like local-only/base-python-cpu:latest) we can either build them individualy following faq_build_base_img or build the whole platform build. Building only the base images and not the whole platform is in general recommended as it is faster and takes less disk space on your system.
Hint
If docker containers should be build on a system with a proxy configured, please make sure to configure docker correctly.
To utilize our base image, we have to build and push it to our registry.
docker build -t <docker-registry><docker-repo>/example-extract-study-id:0.1.0 .
docker push <docker-registry><docker-repo>/example-extract-study-id:0.1.0
Since we just used a generic python image as a template for our algorithm and made it available in the Kaapana registry, we can also reuse it for any other python based algorithm.
Now we create the operator, that pulls the base image and starts the container. Additionally we create the DAG. We can create both files via the code-server extension analogous to how we wrote the DAG in write your first own dag.
We define the operator in a file ExtractStudyIdOperator.py in dags/example:
../../../templates_and_examples/examples/processing-pipelines/example/extension/docker/files/example/ExtractStudyIdOperator.py
The DAG file dag_example_extract_study_id.py has to be stored in dags/ and can look like this:
../../../templates_and_examples/examples/processing-pipelines/example/extension/docker/files/dag_example_extract_study_id.py
The DAG is just a sequence of different operators. In this example the LocalGetInputDataOperator loads the data we want to work with. The ExtractStudyIdOperator loads (so far) our empty base image and utilizes the Kaapana code-server as development server to implement our algorithm inside the active container. We enable this behavior by setting argument dev_server="code-server" when we initialize the ExtractStudyIdOperator:
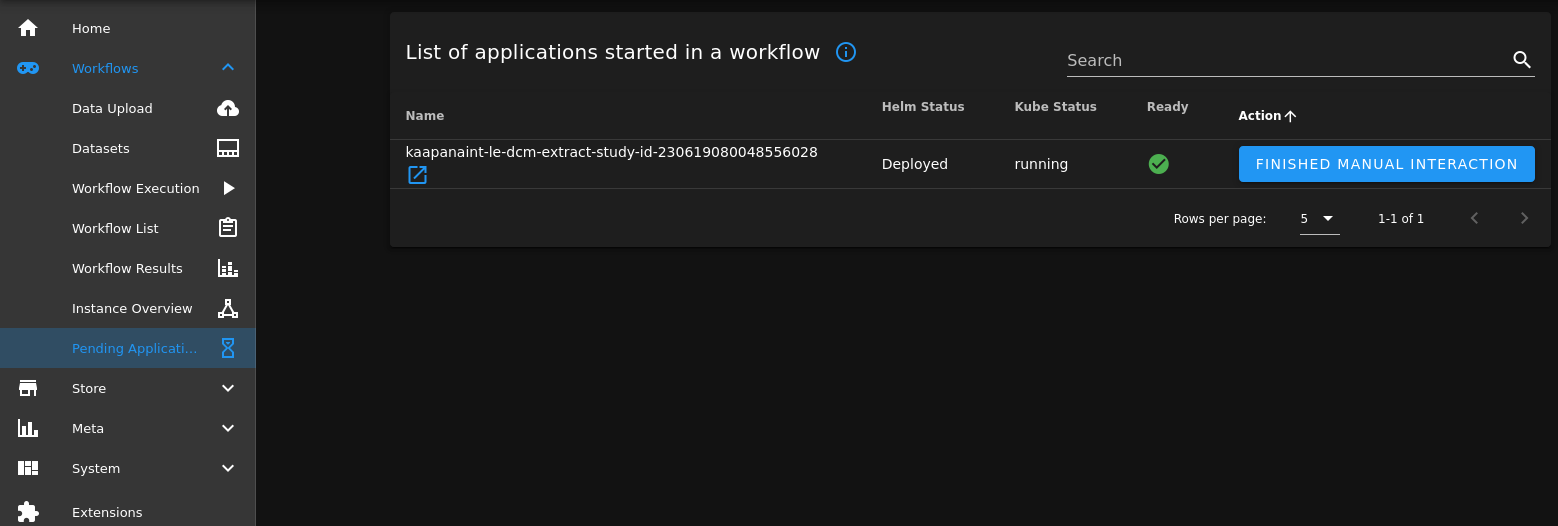
extract = ExtractStudyIdOperator(dag=dag, input_operator=get_input, dev_server="code-server")Now it's time to trigger the development workflow. Therefore, we go to Workflows -> Workflow Execution and select from the workflow drop-down menu our developed workflow example-dcm-extract-study-id and start the workflow. The workflow will run all operators until it comes to the ExtractStudyIdOperator which we have set by adding the dev_server="code-server" argument into dev-mode. Now we navigate to Workflows -> Pending Applications, click on the blue link icon besides the operator's name and a dev-code-server is opened up and we can create, modify and run files inside the container.
We can now implement and test our algorithm. In this example the algorithm is a python script, that extracts the study IDs from the loaded data and returns it.
Note
The code server looks for the app directory by default. When we use it as dev-server inside the docker container it will prompt an error message, that app does not exist. You can safely ignore this message and open the root directory of the container.
The python code of the algorithm which we want to integrate into our Kaapana platform is the following:
../../../templates_and_examples/examples/processing-pipelines/example/processing-containers/extract-study-id/files/extract_study_id.py
We just store the python file in the directory /mounted/workflows/mounted_scripts inside the docker container as /extract_study_id.py.
To check if everything works as expected open a terminal in the code-server and run python3 extract-study-id.py.
Checking /kaapana/mounted/data/example-dcm-extract-study-id-230619080048556028/batch/1.3.12.2.1107.5.1.4.73104.30000020081307523376400012735/get-input-data for dcm files
Writing results to /kaapana/mounted/data/example-dcm-extract-study-id-230619080048556028/batch/1.3.12.2.1107.5.1.4.73104.30000020081307523376400012735/extract-study-id
Extracting study_id: /kaapana/mounted/data/example-dcm-extract-study-id-230619080048556028/batch/1.3.12.2.1107.5.1.4.73104.30000020081307523376400012735/get-input-data/1.3.12.2.1107.5.1.4.73104.30000020081307523376400012736.dcm
After we are finished, we can close the code-server browser tab and terminate the dev-code-server in the "Workflows -> Pending applications" tab of Kaapana, with the "FINISHED MANUAL INTERACTION" button.
Hint
The directory /mounted_scripts in the container of any operator initialized with the parameter dev_server="code-server" is also available in the code-server extension. Hence, you don't have to worry that your files in this directory are lost after the container finishes.
When we are finished with the implementation, we adjust the image from step 1 to execute the algorithm. To do so, we create a files directory beside the Dockerfile of the original image and put the extract_study_id.py script inside it. Then adjust the Dockerfile such that the container copies and executes the script.
../../../templates_and_examples/examples/processing-pipelines/example/processing-containers/extract-study-id/Dockerfile
Afterwards build and push the finished image again.
docker build -t <docker-registry><docker-repo>/example-extract-study-id:0.1.0 .
docker push <docker-registry><docker-repo>/example-extract-study-id:0.1.0
Since we finished the implementation process we also don't want the DAG to initiate a dev-server every time. Hence, we should delete the dev-server="code-server" option from the initialization of the ExtractStudyIdOperator in dag_example_extract_study_id.py.
extract = ExtractStudyIdOperator(dag=dag, input_operator=get_input)Congrats! You developed your first workflow in Kaapana :).
As an alternative to the steps above, you can also develop the algorithm on your local machine. In this case skip provide an empty base image. To debug and test the algorithm you need data that is structured in the same way as on the platform. You can get such data by downloading some suitable data from the platform:
- Go to Workflows -> Datasets and select the data you want to use.
- Click on the play-button and start the workflow
download-selected-files.- After it finished go to Store - Minio and browse the downloads bucket for the object with the correct timestamp.
- Click on the download action to download the data.
- Extract the archive at the place, where you want to develop the algorithm.
Additionally, you need to emulate the Kaapana environment on your local machine. You can simply do this by setting the required environment variables at the beginning of the algorithm script extract-study-id:
import os

os.environ["WORKFLOW_DIR"] = "<your data directory>"
os.environ["BATCH_NAME"] = "batch"
os.environ["OPERATOR_IN_DIR"] = "get-input-data"
os.environ["OPERATOR_OUT_DIR"] = "output"
Change <your data directory> to the local path to the directory, where you ectracted the data.
After developing the algorithm build and push the docker image as described in push-the-algorithm-to-the-registry. Then create the operator and the DAG analogously to Create a developement DAG, but without setting the ExtractStudyIdOperator into dev-mode.
The previous section Deploy an own processing algorithm to the platform gives an introduction on how to integrate a proccessing algorithm into a Kaapana platform. If you want to make you algorithm easily installable and available on multiple Kaapana platforms, you have to provide it as an installable extension.
Goal: We write a workflow that applies Otsu's method to create a segmentation of DICOM data. We provide this workflow as an extension to the Kaapana platform.
Requirements: You need the image local-only/base-installer:latest locally available in order to build the image for the DAG.
All files used in this tutorial can be found in the repository under templates_and_examples.
The final directory structure has to look like this:
otsus-method/
├── extension
│   ├── docker
│   │   ├── Dockerfile
│   │   └── files
│   │       ├── dag_otsus_method.py
│   │       └── otsus-method
│   │           ├── OtsusMethodOperator.py
│   │           └── OtsusNotebookOperator.py
│   └── otsus-method-workflow
│       ├── Chart.yaml
│       ├── requirements.yaml
│       └── values.yaml
└── processing-containers
    └── otsus-method
        ├── Dockerfile
        └── files
            ├── otsus_method.py
            ├── otsus_notebooks
            │   ├── run_otsus_report_notebook.ipynb
            │   └── run_otsus_report_notebook.sh
└── requirements.txtFirst you need to create a directory for the processing algorithm. To remain consistent with the structure of Kaapana we recommend to create the new folder in the location kaapana/data-processing/processing-piplines/, but it can be located anywhere. :
mkdir -p otsus-method/processing-containers/otsus-method/files/otsus_notebooksIn the files directory create a file called otsus-method that contains the segmentation algorithm based on Otsu's method:
../../../templates_and_examples/examples/processing-pipelines/otsus-method/processing-containers/otsus-method/files/otsus_method.py
In otsus_notebooks/ include the files run-otsus-report-notebook-sh and run-otsus-report-notebook-ipynb. These files generate an example jupyter notebook from the algorithm results in Workflows -> Workflow Results.
../../../templates_and_examples/examples/processing-pipelines/otsus-method/processing-containers/otsus-method/files/otsus_notebooks/run_otsus_report_notebook.sh
../../../templates_and_examples/examples/processing-pipelines/otsus-method/processing-containers/otsus-method/files/otsus_notebooks/run_otsus_report_notebook.ipynb
In the files directory create otsus-method-requirements, which contains all dependencies the image needs to run the above scripts:
../../../templates_and_examples/examples/processing-pipelines/otsus-method/processing-containers/otsus-method/files/requirements.txt
In otsus-method/processing-containers/otsus-method create the otsus-method-dockerfile for the otsus-method algorithm.
../../../templates_and_examples/examples/processing-pipelines/otsus-method/processing-containers/otsus-method/Dockerfile
Starting this container will execute the segmentation algorithm.
To build the image and push it to the registry, run the following commands inside the otsus-method/processing-containers/otsus-method directory.
docker build -t <docker-registry>/<docker-repo>/otsus-method:0.1.0 .
docker push <docker-registry>/<docker-repo>/otsus-method:0.1.0
Hint
If not already done, you have to log into your Docker registry with docker login <docker-registry>/<docker-repo>, before you can push the image.
We also need an image that is able to install the DAG on the platform. This image is based on local-only/base-installer:latest and contains the operators as well as the dag file. Create the folder for the DAG image. Inside the outer otsus-method directory run:
mkdir -p extension/docker/files/otsus-methodInside the folder otsus-method/extension/docker/files/otsus-method create two files: OtsusMethodOperator and OtsusNotebookOperator. These two files define the operators, that execute the code in otsus-method and run-otsus-report-notebook-sh, respectively.
../../../templates_and_examples/examples/processing-pipelines/otsus-method/extension/docker/files/otsus-method/OtsusMethodOperator.py
../../../templates_and_examples/examples/processing-pipelines/otsus-method/extension/docker/files/otsus-method/OtsusNotebookOperator.py
The dag file dag-otsus-method should be created in otsus-method/extension/docker/files/.
../../../templates_and_examples/examples/processing-pipelines/otsus-method/extension/docker/files/dag_otsus_method.py
In otsus-method/extension/docker/ create dockerfile-otsus-dag for the image, that will install the DAG on the platform.
../../../templates_and_examples/examples/processing-pipelines/otsus-method/extension/docker/Dockerfile
Build the image and push it to the registry. Next to the dockerfile-otsus-dag in otsus-method/extension/docker/ execute:
docker build -t <docker-registry>/<docker-repo>/dag-otsus-method:<version-tag> .
docker push <docker-registry>/<docker-repo>/dag-otsus-method:<version-tag>The helm chart for the extension contains all information the platform needs to pull the images from the registry and make the extension available.
Create a folder for the chart. Inside otsus-method/extension/ run mkdir -p otsus-method-workflow.
Create the three files otsus-method-chart and otsus-chart-requirements and otsus-chart-values in otsus-method-workflow/.
../../../templates_and_examples/examples/processing-pipelines/otsus-method/extension/otsus-method-workflow/Chart.yaml
../../../templates_and_examples/examples/processing-pipelines/otsus-method/extension/otsus-method-workflow/requirements.yaml
../../../templates_and_examples/examples/processing-pipelines/otsus-method/extension/otsus-method-workflow/values.yaml
Important
The field repository in otsus-chart-requirements must be the relative path to the directory that contains the Chart.yaml file for the dag-installer chart. This file is located in the subdirectory services/utils/dag-installer-chart/ of the kaapana repository.
Update helm dependencies and package the chart.
helm dep up
helm package .
This will create the file otsus-method-workflow-0.1.0.tgz, which contains all the required information.
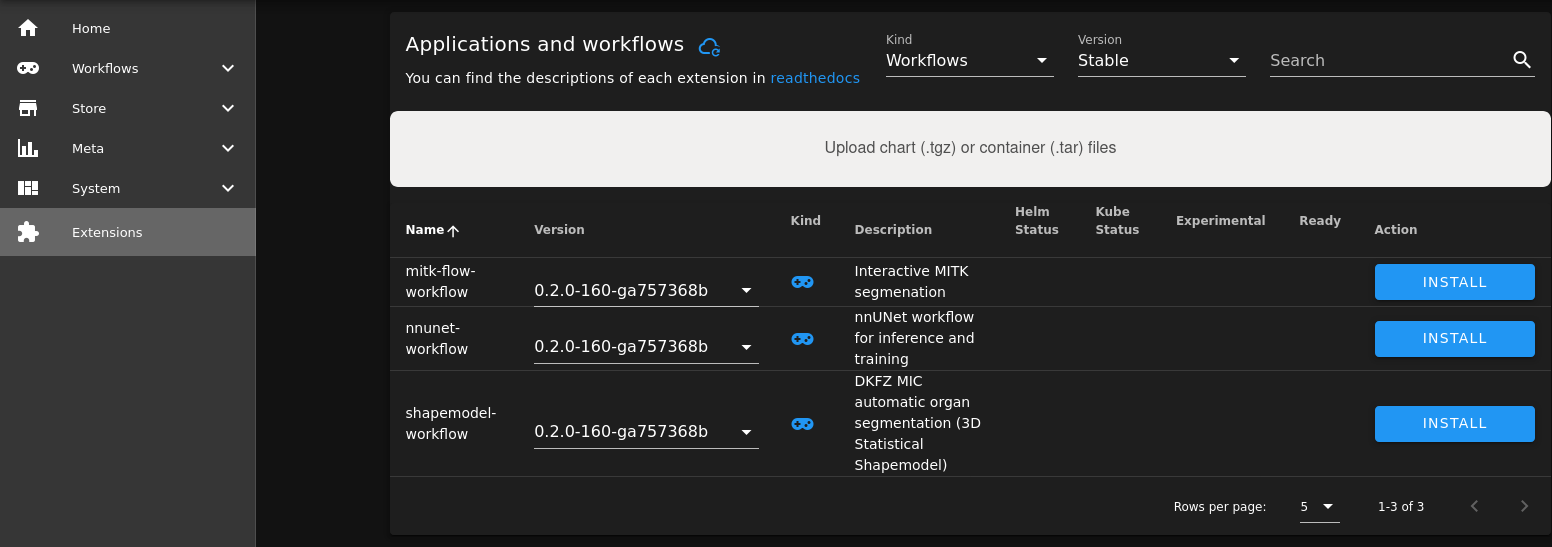
There are three ways how to add an extension to the platform. The first two options Add Extension via UI and add extension manually make the extension available only on a single instance. The third approach: Add to Extention Collection adds the extension as a dependency to the helm chart of the platform. Therefore, every platform that will be deployed based on this helm chart will have the extension available.
You can simply drag and drop the file otsus-method-workflow-0.1.0.tgz into the Upload field on the Extensions page.
Warning
This approach requires root permissions on the host server of the platform.
You can copy the file otsus-method-workflow-0.1.0.tgz into the correct location directory on the host machine of your instance. Copy the file otsus-method-workflow-0.1.0.tgz to the subdirectory extensions/ of the FAST_DATA_DIR directory, which is by default /home/kaapana/.
Hint
The FAST_DATA_DIR can be configured by editing the deploy_platform.sh<deploy-platform-script> script before the installation of the platform.
The Kaapana repository contains a special collection chart that depends on mutliple other charts. You can add the new helm chart to the requirements.yaml file of this collection chart list. If you build the platform again, the new extension will automatically be a part of it.
First append the file collections/kaapana-collection/requirements.yaml in your Kaapana repository with these two lines
- name: otsus-method-workflow
  version: 0.0.0
Then build the platform by running python3 build-scripts/start_build.py in the root directory of your repository.
To make the extension available on a running platform you only need to restart the kaapana-extension-collection pod. You can do this in the Kaapana GUI by clicking on the cloud button next to Applications and workflows in the Extension page.
Alternatively, you can also manually delete the pod on your host machine. First get the name of the pod.
kubectl get pods -n admin | grep copy-kube-helm-collectionsThen delete the pod
kubectl delete pod -n admin <pod-name>After some seconds the extension list should contain otsus-method-workflow.
This short section will show you how to debug in case a workflow throws an error.
If there is a syntax error in the implementation of a DAG or in the implementation of an operator, the errors are normally shown directly at the top of the Airflow DAGs view in red. For further information, you can also consult the log of the container that runs Airflow. For this, you have to go to Kubernetes, select the namespace services and click on the Airflow pod. On the top right there is a button to view the logs. Since Airflow starts two containers at the same time, you can switch between the two outputs at the top in 'Logs from...'.
- Via Workflow List: When you click on the red bubble within the workflow list all failed workflow runs will appear underneath the workflow. Within the 'Logs' column you can see two buttons linking directly to the logs in airflow and to the task view.
- Via Airflow: when you click in Airflow on the DAG you are guided to the 'Graph View'. Clicking on the red, failed operator a pop-up dialog opens where you can click on 'View Log' to see what happened.
- Via Kubernetes: in the namespace
jobs, you should find the running pod that was triggered from Airflow. Here you can click on the logs to see why the container failed. If the container is still running, you can also click on 'Exec into pod' to debug directly into the container.
After you resolved the bug in the operator, you can either restart the whole workflow or you can click on the operator in the 'Graph View', select 'Clear' in the pop-up dialog and confirm the next dialog. This will restart the operator.