Skip to content
New issue

Have a question about this project? Sign up for a free GitHub account to open an issue and contact its maintainers and the community.

By clicking “Sign up for GitHub”, you agree to our terms of service and privacy statement. We’ll occasionally send you account related emails.

Already on GitHub? Sign in to your account

mini-graph-card showing wrong data after upgrade to HA 2022.6.1 #797

Closed
stalakerob opened this issue Jun 6, 2022 · 20 comments
Closed

mini-graph-card showing wrong data after upgrade to HA 2022.6.1 #797

stalakerob opened this issue Jun 6, 2022 · 20 comments

Comments

@stalakerob
Copy link

stalakerob commented Jun 6, 2022

This is showing the same data in the stock graph and mini-graph-card. Obviously the mini-graph-card is wrong. The mini-graph-card shows a steep increase. I believe this happened when I upgraded to 2022.6.1

See also https://community.home-assistant.io/t/lovelace-mini-graph-card/71385/2076

grafik
grafik

`cards:

  • entities:
    • entity: sensor.lumi_6d760604_temperature
      extrema: true
      font_size: 58
      height: 350
      hour24: true
      hours_to_show: 24
      index: 0
      line_color: blue
      line_width: 4
      name: Eingang
      points_per_hour: 60
      type: custom:mini-graph-card`
@The-Deep-Sea
Copy link

I can confirm that. After the HA update, the mini-graph-card shows seemingly random data.

@ildar170975
Copy link
Collaborator

ildar170975 commented Jun 6, 2022

Checked some graphs, cannot confirm (2022.6.1).
Sensor is updated every 30 sec.

type: vertical-stack
cards:
  - type: custom:mini-graph-card
    entities:
      - entity: sensor.xiaomi_cg_1_pm25
        color: green
        show_state: true
        show_points: true
    hours_to_show: 1
    points_per_hour: 120
    aggregate_func: last
    update_interval: 0
    height: 80
    show:
      state: true
      points: true
      extrema: true
      name: false
      icon: false
    line_width: 1
    hour24: true
    lower_bound: ~0
    smoothing: false
  - type: history-graph
    entities:
      - entity: sensor.xiaomi_cg_1_pm25
    hours_to_show: 1
    refresh_interval: 0

image

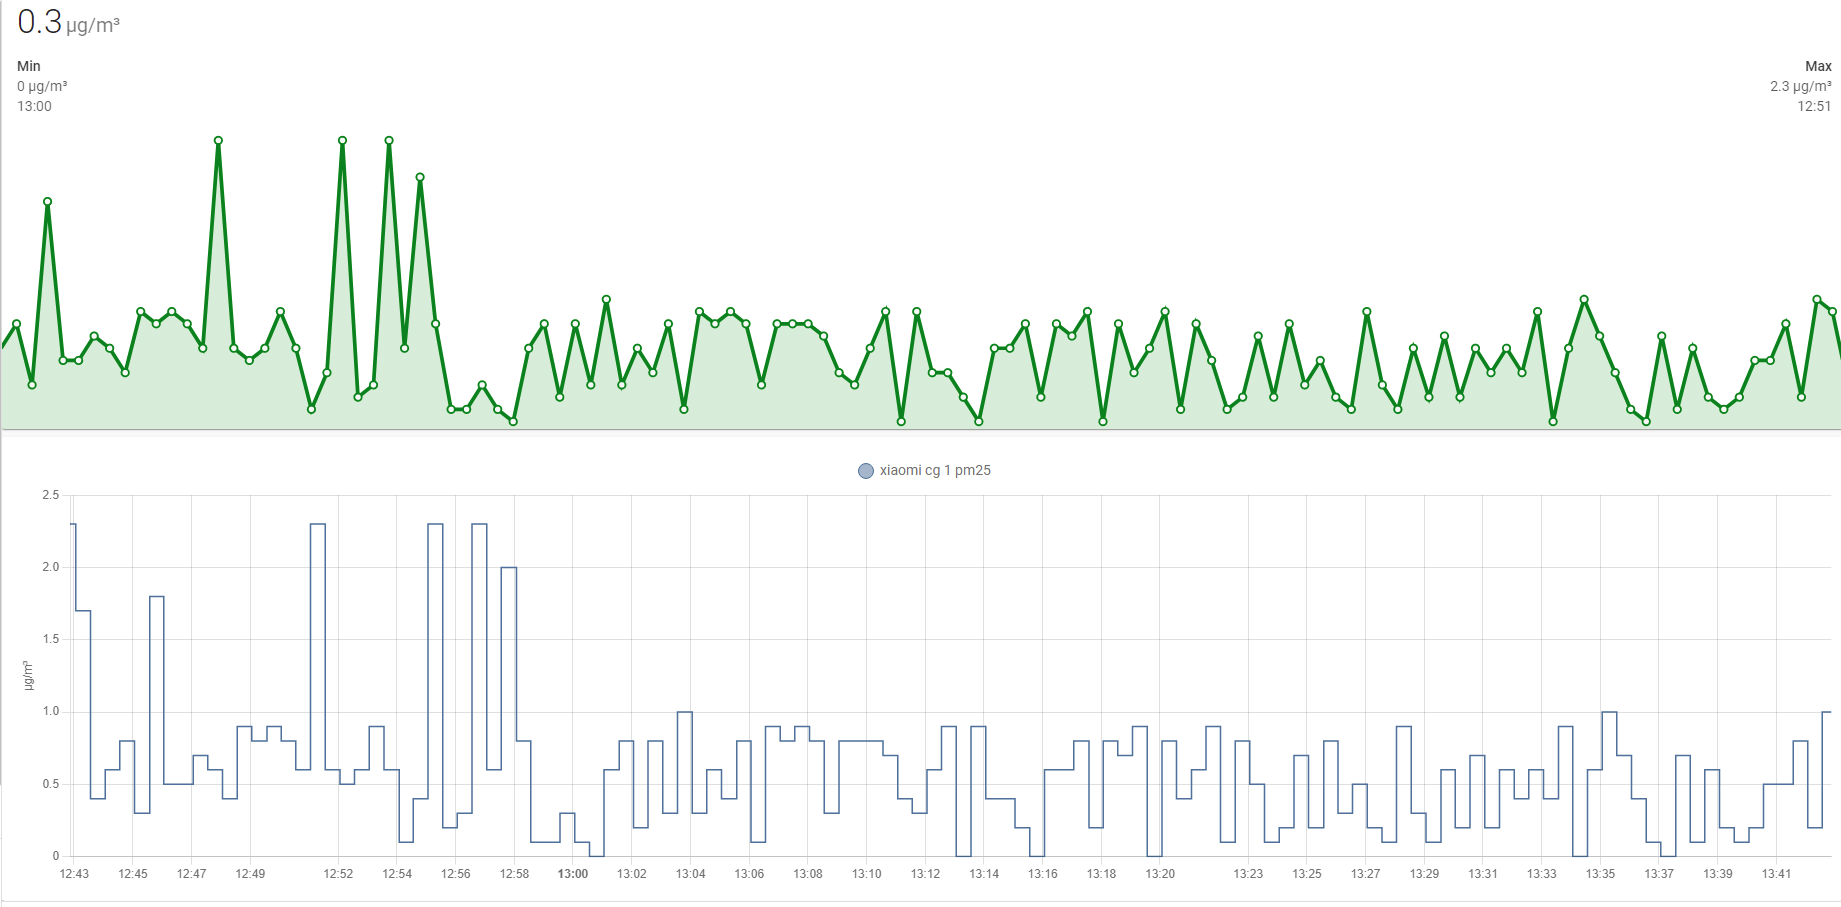
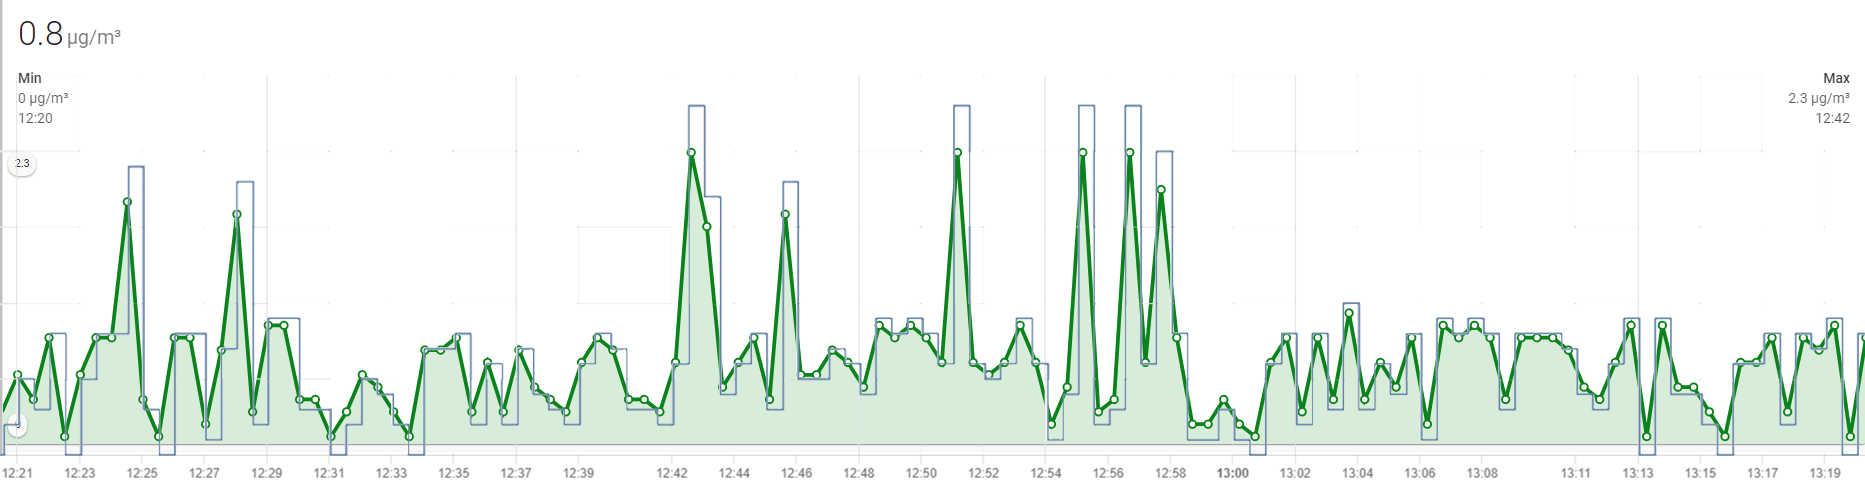
Now place one graph to another (using Photoshop):
image

@jkrasinger
Copy link

jkrasinger commented Jun 6, 2022

Since upgrading HA to 2022.6.x mini graph card does not show any longer updated data, only horizontal line.

entities:
  - entity: sensor.nr_mq_wz_temperatur
    name: Temperatur
extrema: false
font_size: 75
hours_to_show: 24
line_color: red
line_width: 4
points_per_hour: 6
show:
  graph: line
type: custom:mini-graph-card

This is the data shown on min-graph-card:
image

This is the same data shown on Statistics (look norma)l:
image

@ildar170975
Copy link
Collaborator

I believe people have a good habit to clear cache after every HA update.

@ildar170975
Copy link
Collaborator

@jkrasinger Next time please always use a formatting for code.
Place a code into triple "`".

@jkrasinger
Copy link

@ildar170975 Excuse me, my fault.

@Mace404
Copy link

Mace404 commented Jun 6, 2022

I believe people have a good habit to clear cache after every HA update.

Clearing cache does not solve the problem.
Also having a flatline since last HA update while the HA own graph shows the correct historical data in recorder db.

@ildar170975
Copy link
Collaborator

ildar170975 commented Jun 6, 2022

Then I do not know...

type: vertical-stack
cards:
  - type: history-graph
    hours_to_show: 1
    refresh_interval: 0
    entities:
      - entity: sensor.processor_use
  - type: custom:mini-graph-card
    hours_to_show: 1
    update_interval: 0
    aggregate_func: last
    smoothing: false
    lower_bound: ~0
    line_width: 1
    entities:
      - entity: sensor.processor_use
    points_per_hour: 240

image

Could it be a problem with DB ?

@ildar170975
Copy link
Collaborator

@Mace404
Copy link

Mace404 commented Jun 6, 2022

After rebooting the host (and not just Core) the graphs went back to normal.

@ildar170975
Copy link
Collaborator

ildar170975 commented Jun 6, 2022

After rebooting the host (and not just Core)

What kind of installation do you use? What DB?

@Mace404
Copy link

Mace404 commented Jun 6, 2022

After rebooting the host (and not just Core)

What kind of installation do you use? What DB?

Supervised (Home Assistant OS) on an Intel NUC with Maria database

@ildar170975
Copy link
Collaborator

ildar170975 commented Jun 6, 2022

I guess that Maria (in Docker?) should be rebooted too.. (but I dont think that this is normal)

I am using Debian + HA in Docker + native MySQL

@Mace404
Copy link

Mace404 commented Jun 6, 2022

That happened when I reboosted the host. So to think of it maybe only rebooting the Maria addon should be enough indeed.

@ildar170975
Copy link
Collaborator

Well, great that at least one person sorted out the problem ))) My best wishes.

@jkrasinger
Copy link

I now have restarted HA (not the host) ... the graphs are normal again. Seems to me that immediately after upgrading it was not working, Reason: DB Upgrade?

@ildar170975
Copy link
Collaborator

This HA release has some issues... See github. Hope guys will fix it one day.

@stalakerob
Copy link
Author

Rebooting the host fixed it for me.

@bdraco
Copy link
Contributor

bdraco commented Jun 8, 2022

Issue is being tracked here sqlalchemy/sqlalchemy#8098

2022.6.4 was just released with an alternate solution until the above can be sorted out

@Rustymage
Copy link

Here's my graphs now :/

Screenshot 2022-07-26 at 20 50 52

type: custom:stack-in-card
cards:
  - type: glance
    entities:
      - sensor.shellyem_meter_power_0
    show_icon: false
    show_state: true
    show_name: false
  - type: custom:mini-graph-card
    entities:
      - entity: sensor.shellyem_meter_power_0
    color_thresholds:
      - value: 0
        color: '#F44336'
      - value: 500
        color: '#00ff00'
      - value: 750
        color: '#FCB900'
      - value: 3000
        color: '#F44336'
    show:
      graph: line
      state: false
      name: false
      icon: false
    hours_to_show: 2
    update_interval: 15
    points_per_hour: 150
    hour24: true
    height: 150
type: custom:stack-in-card
cards:
  - type: custom:mini-graph-card
    name: Technology
    entities:
      - entity: sensor.home_lab_current_energy
        name: Office
      - entity: sensor.network_plug_current_energy
        name: Network
      - entity: sensor.worklaptop_current_energy
        name: Laptop
    show:
      graph: line
      state: false
      name: true
      icon: false
      labels: true
    hours_to_show: 1
    update_interval: 15
    points_per_hour: 60
    hour24: true
    height: 150
Home Assistant 2022.7.7 
Supervisor 2022.07.0 
Operating System 8.4 
Frontend 20220707.1 - latest

Sign up for free to join this conversation on GitHub. Already have an account? Sign in to comment
Labels
None yet
Projects
None yet
Development

No branches or pull requests

7 participants