Skip to content
New issue

Have a question about this project? Sign up for a free GitHub account to open an issue and contact its maintainers and the community.

By clicking “Sign up for GitHub”, you agree to our terms of service and privacy statement. We’ll occasionally send you account related emails.

Already on GitHub? Sign in to your account

Graph Widget is blank on dashboard in v8.12.0 #1078

Closed
pe2269 opened this issue Aug 30, 2021 · 12 comments
Closed

Graph Widget is blank on dashboard in v8.12.0 #1078

pe2269 opened this issue Aug 30, 2021 · 12 comments

Comments

@pe2269
Copy link

pe2269 commented Aug 30, 2021

STOP right now, and please first look to see if the issue you're about to submit is already an open or recently closed issue at https://github.com/kizniche/Mycodo/issues

Please DO NOT OPEN AN ISSUE:

  • If your Mycodo version is not the latest release version, please update your device before submitting your issue (unless your issue is related to not being able to upgrade). Your problem might already be solved.

  • If your issue has been addressed before. If you have any new information that may aid in solving the issue, post it in the issue that already exists.

If you are going to post a new issue, next read How to Write a Good Bug Report at https://forum.kylegabriel.com/t/how-to-write-a-good-bug-report/71

Please complete as many of the sections below, if applicable, to provide the most information that may help with investigating your issue. Replace the text in brackets with your own text describing the issue. The details requested potentially affect which options to pursue. The small amount of time you spend completing the template will also help those providing assistance by reducing the time required to help you.

Describe the problem/bug

Hi Kyle,
I have problems with the new highcharts widgets from the new version (8.12) of Mycodo.
The input show good measurements (CPU/GPU temperature), i can displayed it with the measurement widget for example.
But if i use the highcharts dependancies widget (Gauges and Graph), after the installtion of the Highcharts dependencies the widgets are not dsiplayed (see picture).

Thanks for your advices

PE

Versions:

  • Mycodo Version: 8.12.0
  • Raspberry Pi 4 model B version 1.4
  • Python Version: 3.7.3 (default, Jan 22 2021, 20:04:44) [GCC 8.3.0]
  • Raspbian OS Version 10 Buster: [e.g. Buster Lite]

Reproducibility

Please list specific setup details that are involved and the steps to reproduce the behavior:

  1. add Dashboard widget
  2. Gauge (Angular) Highcharts or Gauge Highcharts (Solid) or or Graph (synchronous highstock)
  3. Select the input (raspberry CPU/GPU temperature)
  4. The widget displayed nothing

Expected behavior

Screenshots

Widget_pb

Additional context

[Anything that should be added to make it easier to address this issue - replace this with your own text]

@kizniche
Copy link
Owner

Can you inspect the page in your browser and see if any 404 errors appear in the console?

@kizniche
Copy link
Owner

And did you indeed add a new widget after the upgrade or just save a previously-created widget?

@pe2269
Copy link
Author

pe2269 commented Aug 30, 2021

Can you inspect the page in your browser and see if any 404 errors appear in the console?

Yes i have some 404 errors i join you the log
192.168.0.68-1630339719296.log

@pe2269
Copy link
Author

pe2269 commented Aug 30, 2021

And did you indeed add a new widget after the upgrade or just save a previously-created widget?

I try both ... (and on 2 differents raspberry)

@pe2269
Copy link
Author

pe2269 commented Aug 30, 2021

Can you inspect the page in your browser and see if any 404 errors appear in the console?

Yes i have some 404 errors i join you the log
192.168.0.68-1630339719296.log

192.168.0.68-1630339719296.log
192.168.0.68-1630339935272.log
192.168.0.68-1630339956631.log
192.168.0.68-1630339961583.log
192.168.0.68-1630339968439.log
192.168.0.68-1630339980079.log

@pe2269
Copy link
Author

pe2269 commented Aug 30, 2021

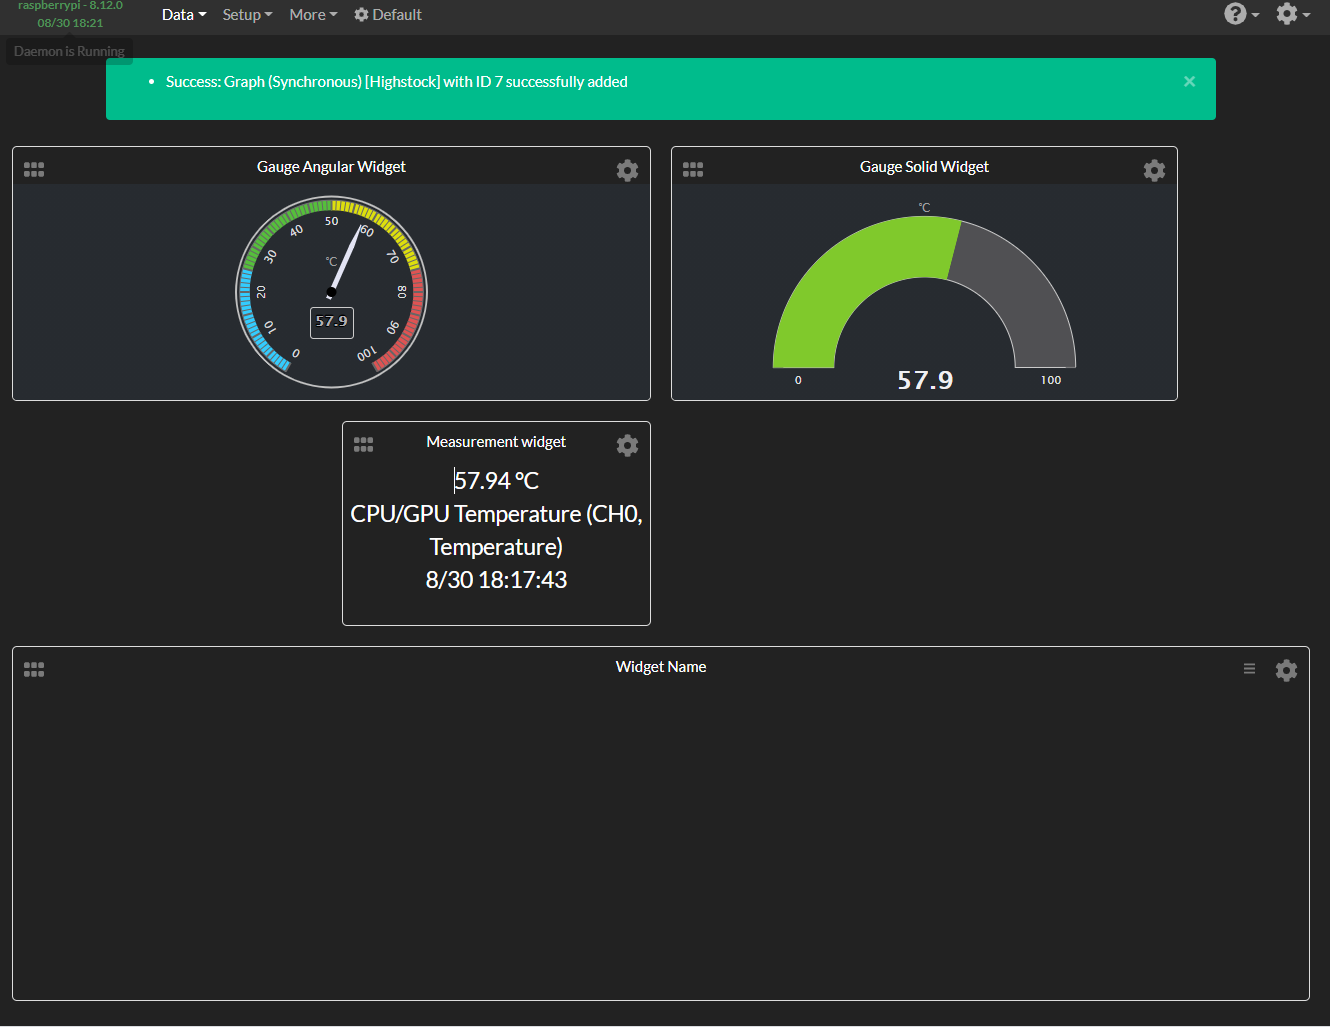
If i add on the same dashboard the Greph widget, the Jauge (angular and solid) are displayed but the graph no ...
Widget_graph

@kizniche
Copy link
Owner

Create a new dashboard with only one graph

@pe2269
Copy link
Author

pe2269 commented Aug 30, 2021

Create a new dashboard with only one graph

The graph Widget is displayed !!
One_Widget_Graph

@kizniche
Copy link
Owner

Can you investigate widget combinations to find what specifically causes the issue?

@pe2269
Copy link
Author

pe2269 commented Aug 30, 2021

Can you investigate widget combinations to find what specifically causes the issue?

  1. graph then angular then solid = ok for all
    graph_angular_solid

  2. Solid then graph ten angular
    solid_graph_angular

  3. Angular then grap then solid
    angular_graph_solid

@kizniche kizniche changed the title HighCharts Widgets are not displayed, Graph Widget is blank on dashboard in v8.12.0 Aug 30, 2021
@kizniche kizniche added the bug label Aug 30, 2021
@kizniche
Copy link
Owner

I just release v8.12.1 that fixes this issue

@pe2269
Copy link
Author

pe2269 commented Aug 31, 2021

Thanks a lot !!

Sign up for free to join this conversation on GitHub. Already have an account? Sign in to comment
Projects
None yet
Development

No branches or pull requests

2 participants