Skip to content
New issue

Have a question about this project? Sign up for a free GitHub account to open an issue and contact its maintainers and the community.

By clicking “Sign up for GitHub”, you agree to our terms of service and privacy statement. We’ll occasionally send you account related emails.

Already on GitHub? Sign in to your account

Async graph data are incorrect #399

Closed
zsole2 opened this issue Feb 3, 2018 · 26 comments
Closed

Async graph data are incorrect #399

zsole2 opened this issue Feb 3, 2018 · 26 comments

Comments

@zsole2
Copy link
Contributor

zsole2 commented Feb 3, 2018

Mycodo Issue Report:

  • Specific Mycodo Version: 5.5.16

Problem Description

During the investigation of my pump not pumping as directed (#387), I checked the GPIO state sensor history. Strangely, the time points were 14 minutes apart, whereas the settings are for 600s.
Looking at the Live graph, the data points are 10 mins apart.

Additional Notes

I put here my wish list for the async graphs:

  • ability to add more than 1 line
  • I miss the relays from the selection list
  • after clicking Submit, the selection box reverts to show the first item, rather the one that was selected and shown on the graph
@kizniche
Copy link
Owner

kizniche commented Feb 3, 2018

Where did you view them 14 minutes apart?

@zsole2
Copy link
Contributor Author

zsole2 commented Feb 3, 2018

Oh, I forgot to include the issue itself: in the async graph, l loaded the GPIO data to see when was the last time the pump operated.

@kizniche
Copy link
Owner

kizniche commented Feb 3, 2018

But async graphs don't have the ability to display Outputs

@zsole2
Copy link
Contributor Author

zsole2 commented Feb 3, 2018

Yeah, I realized and added this item to the wish list...
But I have the two GPIO sensor, connected in series, and their interrelated behavior induces the pump to fill up the container for the humidifier. So I wanted to see where the GPIO state changes were for the two sensors.

@kizniche
Copy link
Owner

kizniche commented Feb 3, 2018

I still don't understand this:

Strangely, the time points were 14 minutes apart, whereas the settings are for 600s.
Looking at the Live graph, the data points are 10 mins apart.

Where did you view them 14 minutes apart and where did you view them 10 minutes apart?

@zsole2
Copy link
Contributor Author

zsole2 commented Feb 3, 2018

Looking at the GPIO points on a Live graph, they were measured at 10 mins intervals, as expected.
When loaded the same GPIO sensor's data on the Async page, the timepoints that the graphing engine shows were regularly at every 14 minutes.
I'll later try to do a few screenshots.

@kizniche
Copy link
Owner

kizniche commented Feb 3, 2018

Yes, I'll need to see the data to understand the issue.

As for adding multiple selections and Outputs, those would be good features.

@zsole2
Copy link
Contributor Author

zsole2 commented Feb 3, 2018

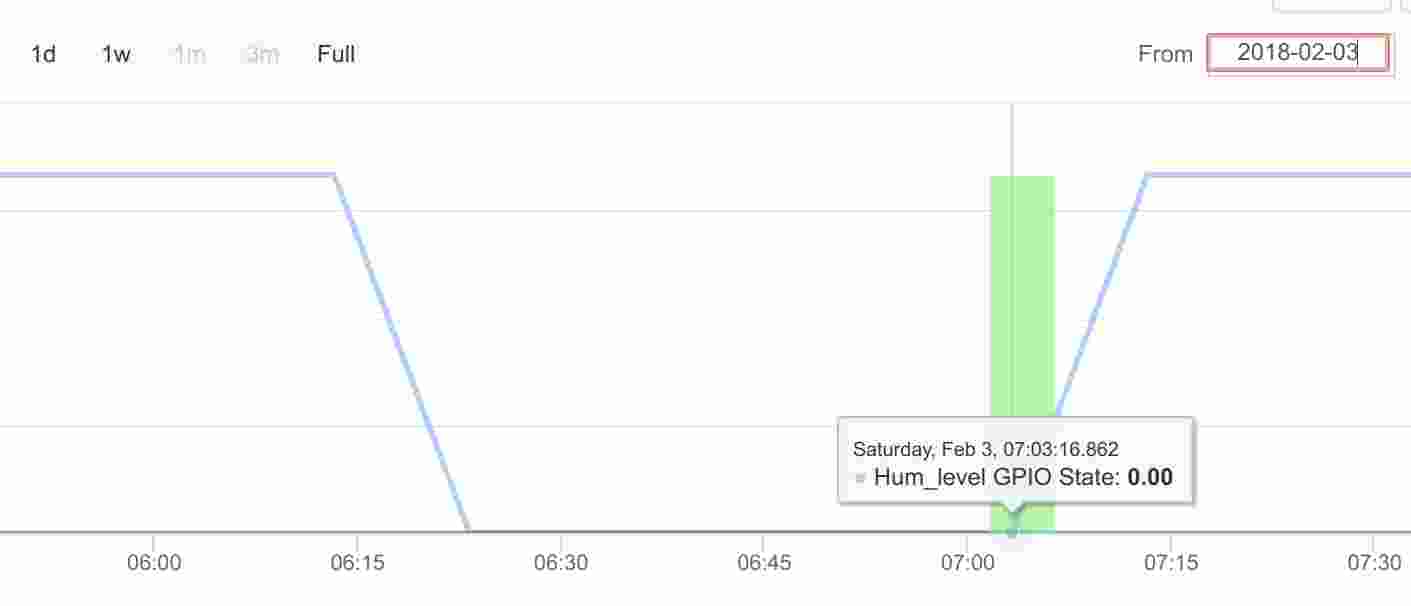
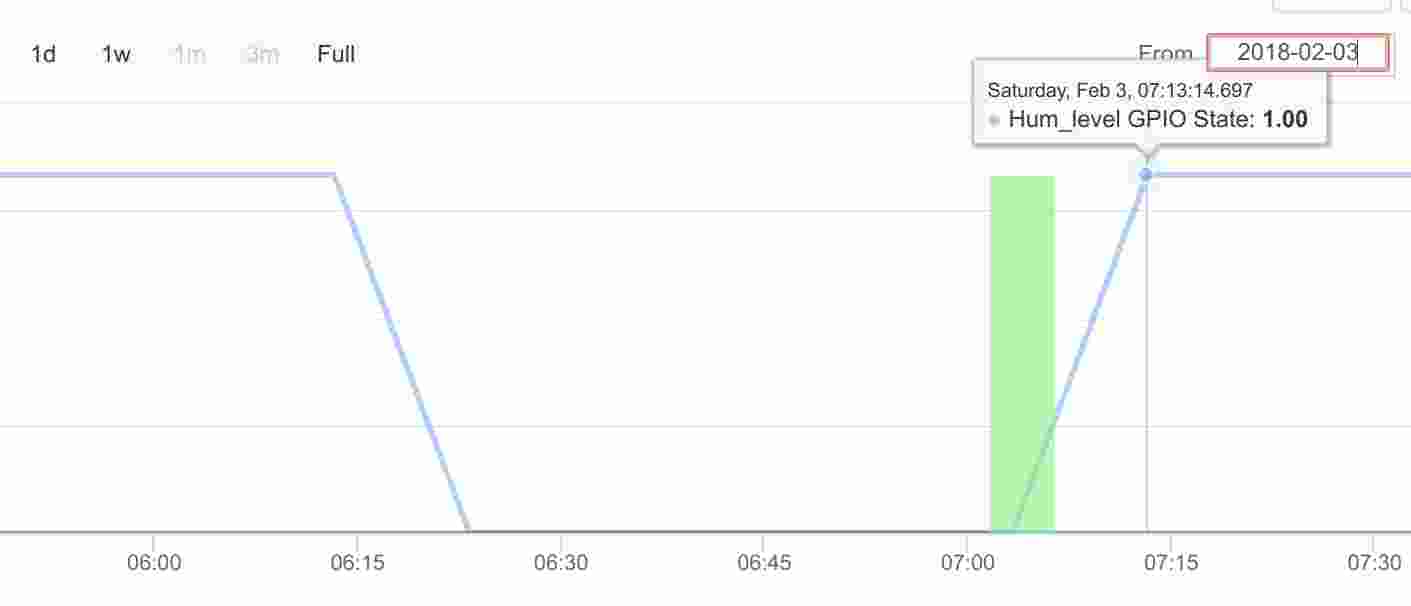
Here is my little movie...

First, from live graph:

selection_020
selection_021
selection_022
selection_023
selection_024
selection_025

And from the async graph:

selection_027
selection_028
selection_029
selection_030
selection_031
selection_032
selection_033

@kizniche
Copy link
Owner

kizniche commented Feb 3, 2018

🤔

@kizniche
Copy link
Owner

kizniche commented Feb 3, 2018

Are you selecting the same Input in the async graphs? The times don't even have the same duration between points, indicating it's not just a time sync issue.

Dashboard Graph: 7:03:16 to 7:13:14, 10min:

selection_023
selection_024

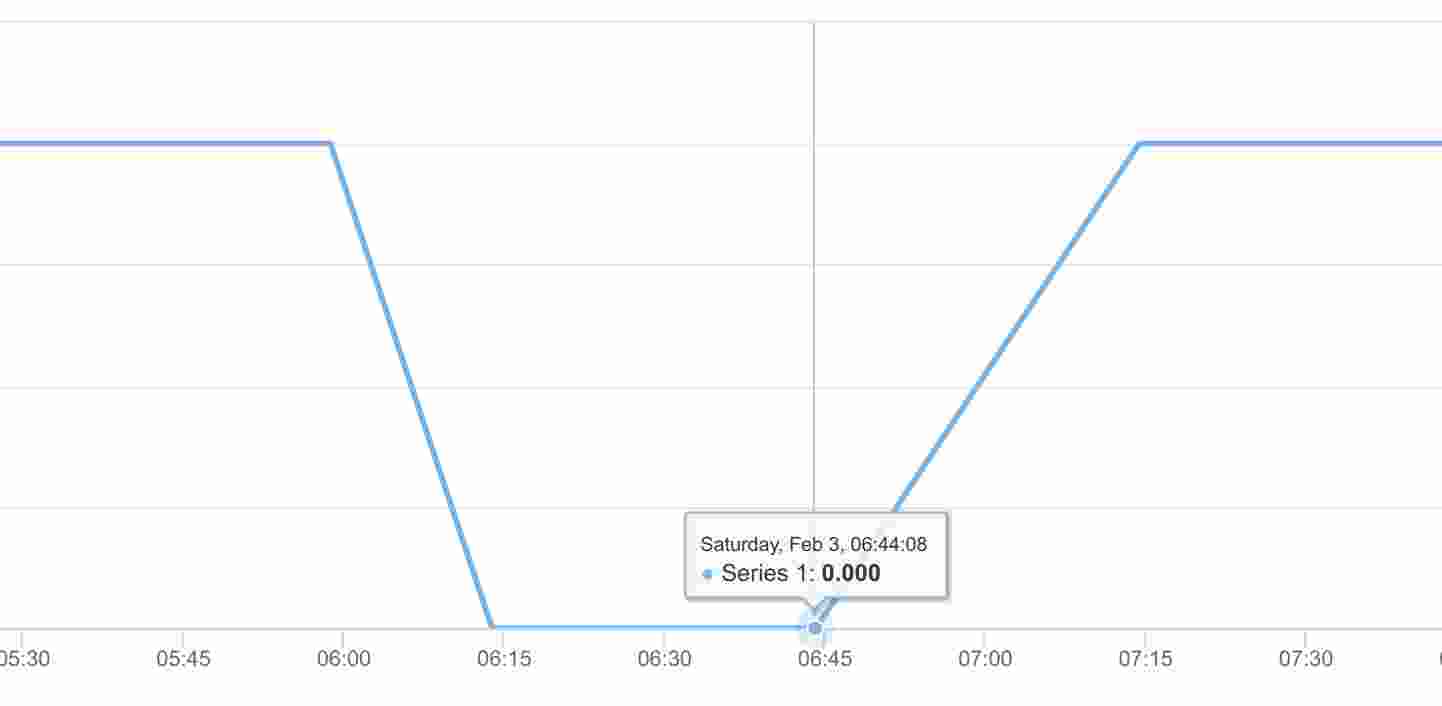
Async Graph: 6:44:08 to 7:14:24, 30min:

selection_030
selection_032

@zsole2
Copy link
Contributor Author

zsole2 commented Feb 3, 2018

Exactly this was the reason to start this issue.
I have only two GPIO state inputs, and the other one is steadily at 0.
What is interesting now that the the time between the points on the async graph is increased from the 14min I saw earlier to 15m08s. Can it be that influx as a time-series-database somehow averaging the data? But it should only be seen when the timescale is compressed.

@kizniche
Copy link
Owner

kizniche commented Feb 3, 2018

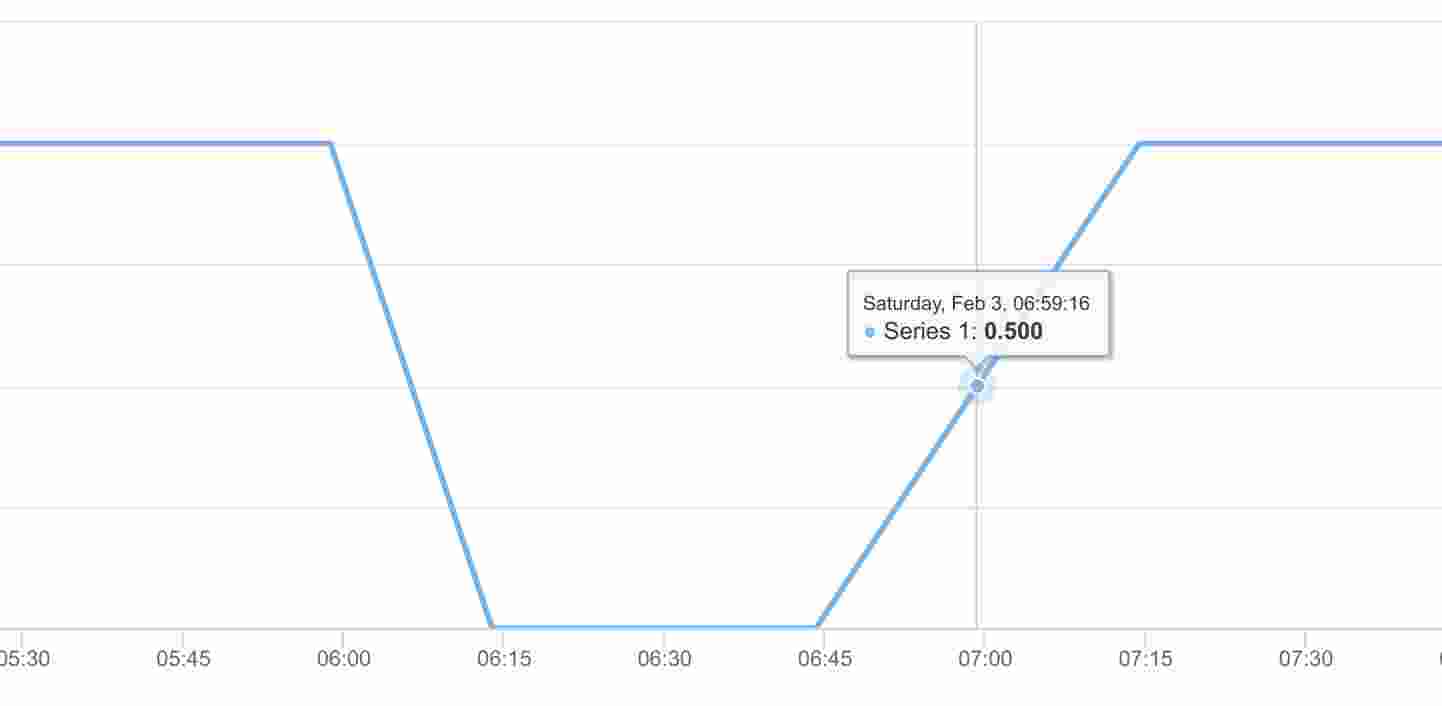
This graph confirms data grouping (averaging) is occurring (there could not be an actual 0.5 measurement):

selection_031

@zsole2
Copy link
Contributor Author

zsole2 commented Feb 4, 2018

Yes, but shouldn't averaging appear only when the timescale is compressed?
I checked the xls export, and this is what appears in the relevant time-region:

2018-02-03 04:38:53 undefined 1
2018-02-03 04:53:53 undefined 1
2018-02-03 05:08:53 undefined 1
2018-02-03 05:23:53 undefined 1
2018-02-03 05:27:21 1  
2018-02-03 05:38:53 undefined 1
2018-02-03 05:43:28 1  
2018-02-03 05:53:53 undefined 1
2018-02-03 05:59:35 1  
2018-02-03 06:15:42 0  
2018-02-03 06:23:53 undefined 0
2018-02-03 06:31:49 0  
2018-02-03 06:38:53 undefined 0
2018-02-03 06:47:56 0  
2018-02-03 06:53:53 undefined 0
2018-02-03 07:04:03 1  
2018-02-03 07:08:53 undefined 1
2018-02-03 07:20:10 1  
2018-02-03 07:23:53 undefined 1
2018-02-03 07:38:53 undefined 1
2018-02-03 07:53:53 undefined 1
2018-02-03 08:08:53 undefined 1

The above was exported when the all data was selected. If I zoomed to the region in question, the data change:

2018-02-03 05:43:28 1  
2018-02-03 05:53:53 undefined 1
2018-02-03 05:59:35 1  
2018-02-03 06:15:42 0  
2018-02-03 06:23:53 undefined 0
2018-02-03 06:31:49 0  
2018-02-03 06:38:53 undefined 0
2018-02-03 06:47:56 0  
2018-02-03 06:53:53 undefined 0
2018-02-03 07:04:03 1  
2018-02-03 07:08:53 undefined 1
2018-02-03 07:20:10 1  
2018-02-03 07:23:53 undefined 1
2018-02-03 07:36:17 1  
2018-02-03 07:38:53 undefined 1
2018-02-03 07:52:24 1  

Here are the raw data, if you want to have a look:
async_exports.zip.zip

@kizniche
Copy link
Owner

kizniche commented Feb 4, 2018

Aha! I found the issue. Check out my change if you want to test it: fa06c68#diff-ce1b3a9ed14f31f75c496ac2fad02530

@zsole2
Copy link
Contributor Author

zsole2 commented Feb 4, 2018

Thanks, that fixed it!

@zsole2 zsole2 closed this as completed Feb 4, 2018
@kizniche kizniche reopened this Feb 4, 2018
@kizniche
Copy link
Owner

kizniche commented Feb 4, 2018

Don't close this just yet, I haven't added all the features yet ;)

I just had a breakthrough with multiple datasets displaying asynchronously:

screenshot-192 168 0 10-2018-02-04-11-55-40

@kizniche
Copy link
Owner

kizniche commented Feb 4, 2018

Although, this is more complicated than I anticipated. I may make a new branch for this work, because I may not got it fully working.

@zsole2
Copy link
Contributor Author

zsole2 commented Feb 4, 2018

OK, I see. The issue is solved and now come the wishes...

@kizniche
Copy link
Owner

kizniche commented Feb 4, 2018

I just successfully got the graph to redraw with new data for all series, after zooming. This was the hardest thing I was facing, so now it should be all easy to clean up the code and try to add minor things like appropriate y-axis titles, units, etc.

@kizniche
Copy link
Owner

kizniche commented Feb 4, 2018

I had some breakthroughs that I think makes the new async graph ready for release. It's such an improvement for looking through data to have more than one series on the graph.

I also made selections remain after form submissions. and added Outputs. It's looking really nice now!

screenshot-192 168 0 10-2018-02-04-18-02-48

kizniche added a commit that referenced this issue Feb 4, 2018
…uts to Asynchronous Graphs, preserve Asynchronous Graph selections after form submissions (#399)
@kizniche
Copy link
Owner

kizniche commented Feb 4, 2018

Something was off... now it looks good

screenshot-192 168 0 10-2018-02-04-18-16-51

@kizniche
Copy link
Owner

kizniche commented Feb 4, 2018

To finish it off, I added PIDs.

screenshot-192 168 0 10-2018-02-04-18-45-17

@kizniche
Copy link
Owner

kizniche commented Feb 5, 2018

I have a Pi that's been running the latest versions but without any sensors connected. I loaded all the data from the internal sensors and see some interesting stuff.

Red is RAM use of the daemon, so you can see when it was running and restarting. What's interesting is the average basal CPU levels differ between restarts of Mycodo (for upgade to new version). It looks like since the last restart, it's been running with the higher load.

screenshot-192 168 0 14-2018-02-04-19-13-27

@kizniche
Copy link
Owner

kizniche commented Feb 5, 2018

One last image before I close this issue (v5.5.18 was released). This change will be included in 5.5.19, and includes different durations of data to select as the default view, which makes using the navbar a lot nicer when you want to move around a smaller dataset.

screenshot-192 168 0 10-2018-02-04-20-53-37

@kizniche kizniche closed this as completed Feb 5, 2018
@zsole2
Copy link
Contributor Author

zsole2 commented Feb 5, 2018

Wow, this looks nice, all the work! Everything is there...
Just a further idea, that comes fro your last change: instead of pre-selecting the past /day/week/month/year, it would be much useful if a time-period from the past could be examined in higher detail. This obviously cannot be done be these buttons, but can it be done by re-zooming the window to the currently selected area? E.g. in this last picture, by a click of a button, you get the more detailed data of the current selection stretched to the full area, showing data from 12:05 to 03:05.
This could be very useful to pinpoint past behavior. Coming to mind, since youhave already put a few buttons in this screen, an 'Undo' type button also could be useful, i.e. reverting to the the previous selection of start and end dates.

@zsole2
Copy link
Contributor Author

zsole2 commented Feb 5, 2018

Do we want to discuss CPU load here?
Anyway, here is a screenhot of 15min CPU load from my long-running 5.0.17 system:
image
The load-change clearly there, but it was not upgraded since last April. On the other hand, reboots seem to always result in this two-level load change. I did not realized that this system got rebooted so many times recently, in theory it is in use most of the time:

2017-04-01 12:50:26,802 - mycodo - INFO - Mycodo daemon v5.0.17 starting
2017-04-01 13:09:49,573 - mycodo - INFO - Mycodo daemon v5.0.17 starting
2017-05-02 19:47:34,036 - mycodo - INFO - Mycodo daemon v5.0.17 starting
2017-05-11 16:09:27,963 - mycodo - INFO - Mycodo daemon v5.0.17 starting
2017-05-11 17:28:24,023 - mycodo - INFO - Mycodo daemon v5.0.17 starting
2017-06-10 08:44:15,437 - mycodo - INFO - Mycodo daemon v5.0.17 starting
2017-06-10 20:11:09,375 - mycodo - INFO - Mycodo daemon v5.0.17 starting
2017-06-19 14:54:48,919 - mycodo - INFO - Mycodo daemon v5.0.17 starting
2017-06-22 19:52:24,089 - mycodo - INFO - Mycodo daemon v5.0.17 starting
2017-07-30 17:17:59,256 - mycodo - INFO - Mycodo daemon v5.0.17 starting
2017-07-30 19:05:58,071 - mycodo - INFO - Mycodo daemon v5.0.17 starting
2017-07-30 19:13:12,326 - mycodo - INFO - Mycodo daemon v5.0.17 starting
2017-08-20 10:05:38,868 - mycodo - INFO - Mycodo daemon v5.0.17 starting
2017-08-20 10:18:53,007 - mycodo - INFO - Mycodo daemon v5.0.17 starting
2017-10-20 06:46:17,312 - mycodo - INFO - Mycodo daemon v5.0.17 starting
2017-11-04 12:18:10,702 - mycodo - INFO - Mycodo daemon v5.0.17 starting
2017-12-17 10:13:32,728 - mycodo - INFO - Mycodo daemon v5.0.17 starting
2017-12-17 16:48:05,398 - mycodo - INFO - Mycodo daemon v5.0.17 starting
2017-12-17 19:37:19,104 - mycodo - INFO - Mycodo daemon v5.0.17 starting
2017-12-17 20:28:50,525 - mycodo - INFO - Mycodo daemon v5.0.17 starting
2017-12-18 09:07:28,531 - mycodo - INFO - Mycodo daemon v5.0.17 starting
2017-12-23 12:28:25,432 - mycodo - INFO - Mycodo daemon v5.0.17 starting
2017-12-28 15:25:47,613 - mycodo - INFO - Mycodo daemon v5.0.17 starting
2018-01-10 10:44:23,177 - mycodo - INFO - Mycodo daemon v5.0.17 starting
2018-01-13 20:50:43,442 - mycodo - INFO - Mycodo daemon v5.0.17 starting
2018-01-16 20:41:41,337 - mycodo - INFO - Mycodo daemon v5.0.17 starting
2018-01-18 19:35:00,069 - mycodo - INFO - Mycodo daemon v5.0.17 starting
2018-01-20 20:00:58,842 - mycodo - INFO - Mycodo daemon v5.0.17 starting
2018-01-22 19:31:35,625 - mycodo - INFO - Mycodo daemon v5.0.17 starting
2018-01-26 15:17:57,789 - mycodo - INFO - Mycodo daemon v5.0.17 starting
2018-01-31 06:45:55,355 - mycodo - INFO - Mycodo daemon v5.0.17 starting
2018-02-04 17:32:14,562 - mycodo - INFO - Mycodo daemon v5.0.17 starting

In addition, there is some very minimal upward trending over the months.
image

Sign up for free to join this conversation on GitHub. Already have an account? Sign in to comment
Labels
None yet
Projects
None yet
Development

No branches or pull requests

2 participants