
rrdgraph style legend support for Flot
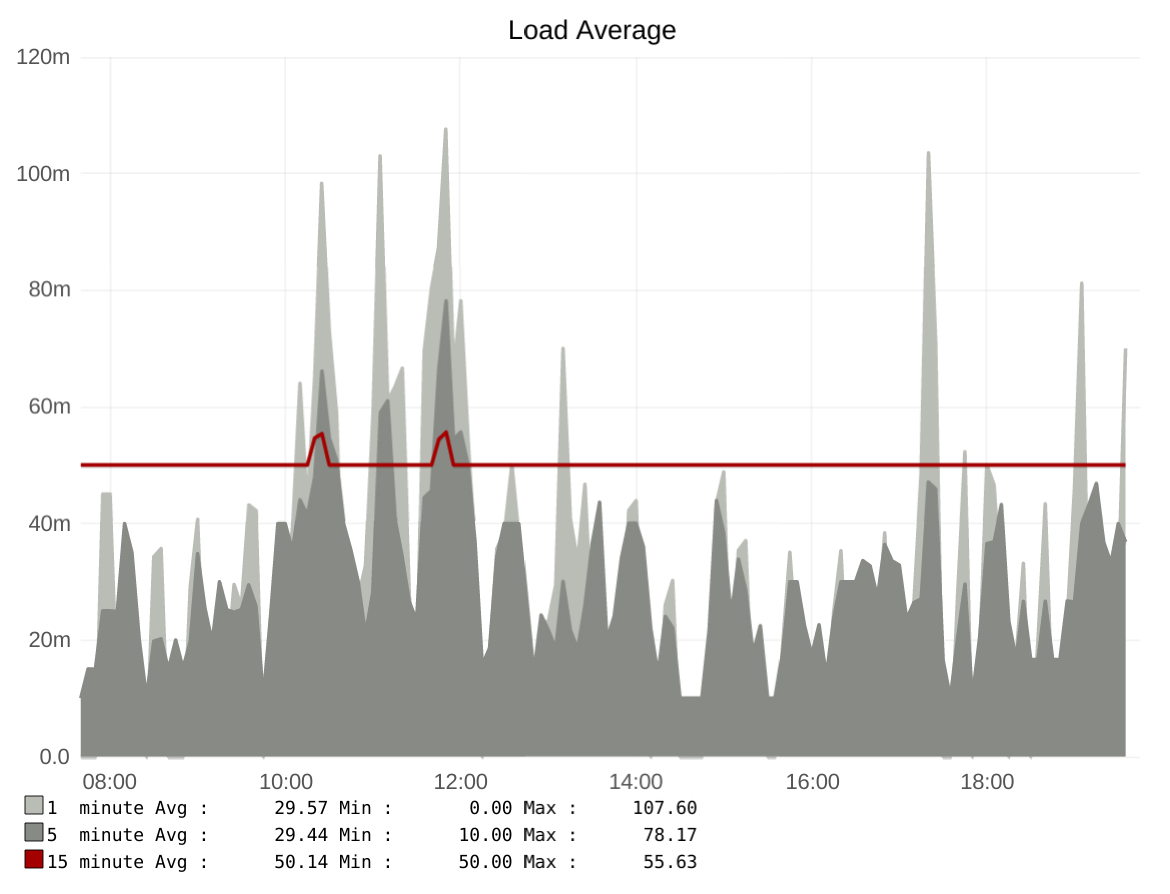
flot-legend can be used to render customizable legends to the chart canvas using syntax similar to rrdgraph's GPRINT.
AREA:float1#babdb6:"1  minute" \
GPRINT:float1:AVERAGE:"Avg \\: %10.2lf" \
GPRINT:float1:MIN:"Min \\: %10.2lf" \
GPRINT:float1:MAX:"Max \\: %10.2lf\\n" \
AREA:float5#888a85:"5  minute" \
GPRINT:float5:AVERAGE:"Avg \\: %10.2lf" \
GPRINT:float5:MIN:"Min \\: %10.2lf" \
GPRINT:float5:MAX:"Max \\: %10.2lf\\n" \
LINE2:float15#a40000:"15 minute" \
GPRINT:float15:AVERAGE:"Avg \\: %10.2lf" \
GPRINT:float15:MIN:"Min \\: %10.2lf" \
GPRINT:float15:MAX:"Max \\: %10.2lf\\n" \
VDEF:sum=other,TOTAL \
GPRINT:sum:"Total \\: %10.2lf\\n"
If the aggregation property is not defined, the value used for a legend statement can be provided directly from the statement.
var series = [
    {
        metric: 'main',
        color: '#feeded',
        data: [[0,0,0], [0,0,0], ...]
    }
];

var hiddenSeries = [
    {
        metric: 'other',
        data: [[0,0,0], [0,0,0], ...]
    }
];

var options = {
    legend: {
        statements: [
            {
                metric: 'main',
                format: '%g nominal Watts'
            },
            {
                metric: 'main',
                aggregation: 'AVERAGE',
                format: 'Avg: %8.2lf %s'
            },
            {
                metric: 'main',
                aggregation: 'MIN',
                format: 'Min: %8.2lf %s'
            },
            {
                metric: 'main',
                aggregation: 'MAX',
                format: 'Max: %8.2lf %s\n'
            },
            {
                metric: 'other',
                value: 42.0,
                format: 'Other - Avg: %8.2lf %s\n'
            },
        ]
    },
    hiddenSeries: hiddenSeries
};

$.plot('#placeholder', series, options);