Skip to content
New issue

Have a question about this project? Sign up for a free GitHub account to open an issue and contact its maintainers and the community.

By clicking “Sign up for GitHub”, you agree to our terms of service and privacy statement. We’ll occasionally send you account related emails.

Already on GitHub? Sign in to your account

unable to fetch metrics from custom metrics API #164

Closed
arielb135 opened this issue Feb 14, 2019 · 2 comments
Closed

unable to fetch metrics from custom metrics API #164

arielb135 opened this issue Feb 14, 2019 · 2 comments

Comments

@arielb135
Copy link

arielb135 commented Feb 14, 2019

I'm trying to add a simple custom metric and scale a simple application based on rabbitMQ queue size,
I'm using AWS EKS - 1.10, and i was able to do HPA by CPU/memory metrics (i've also deployed the metrics server).

i've tried to follow the configuration here:
https://gitlab.ops.mist.io/mistio/mist-ce/blob/staging/chart/mist/templates/prometheusrule.yaml

those are my configurations

Deployment:

apiVersion: extensions/v1beta1
kind: Deployment
metadata:
  labels:
    run: php-apache    
  name: php-apache
  namespace: default
spec:
  progressDeadlineSeconds: 600
  replicas: 1
  revisionHistoryLimit: 10
  selector:
    matchLabels:
      run: php-apache
  strategy:
    rollingUpdate:
      maxSurge: 1
      maxUnavailable: 1
    type: RollingUpdate
  template:
    metadata:
      creationTimestamp: null
      labels:
        run: php-apache
    spec:
      containers:
      - image: k8s.gcr.io/hpa-example
        imagePullPolicy: Always
        name: php-apache
        ports:
        - containerPort: 80
          protocol: TCP
        resources:
          requests:
            cpu: 200m 

Prometheus rule:

apiVersion: monitoring.coreos.com/v1
kind: PrometheusRule
metadata:
  name: php-apache
  namespace: default   
  labels:
    prometheus: kube-prometheus
    role: alert-rules
    run: php-apache
    app: php-apache
spec:
  groups:
  - name: hpa
    interval: 10s
    rules:
    - expr: 'avg(rabbitmq_queue_messages{queue=~"epm-ti-hash-request-arielpriority"})'
      record: hpa_custom_metrics_deployment_queues_length

HPA:

apiVersion: autoscaling/v2beta1
kind: HorizontalPodAutoscaler
metadata:  
  labels:
    run: php-apache    
    app: php-apache
  name: php-apache
  namespace: default    
spec:
  maxReplicas: 10
  minReplicas: 1
  scaleTargetRef:
    apiVersion: extensions/v1beta1
    kind: Deployment
    name: php-apache
  metrics:
    - type: Object
      object:
        target:
          apiVersion: extensions/v1beta1
          kind: Deployment
          name: php-apache
        metricName: hpa_custom_metrics_deployment_queues_length
        targetValue: 1

When going to prometheus, i can see the rule and it works:
image

image

After deploying, i get an error: unable to fetch metrics from custom metrics API

full log:

Name:                                                                      php-apache
Namespace:                                                                 default
Labels:                                                                    app=php-apache
                                                                           run=php-apache
Annotations:                                                               kubectl.kubernetes.io/last-applied-configuration={"apiVersion":"autoscaling/v2beta1","kind":"HorizontalPodAutoscaler","metadata":{"annotations":{},"labels":{"app":"php-apache","run":"php-apache"},"nam...
CreationTimestamp:                                                         Wed, 13 Feb 2019 16:54:28 +0200
Reference:                                                                 Deployment/php-apache
Metrics:                                                                   ( current / target )
  "hpa_custom_metrics_deployment_queues_length" on Deployment/php-apache:  <unknown> / 1
Min replicas:                                                              1
Max replicas:                                                              10
Conditions:
  Type           Status  Reason                 Message
  ----           ------  ------                 -------
  AbleToScale    True    SucceededGetScale      the HPA controller was able to get the target's current scale
  ScalingActive  False   FailedGetObjectMetric  the HPA was unable to compute the replica count: unable to get metric hpa_custom_metrics_deployment_queues_length: Deployment on default php-apache/unable to fetch metrics from custom metrics API: the server could not find the metric hpa_custom_metrics_deployment_queues_length for deployments.extensions
Events:
  Type     Reason                 Age                  From                       Message
  ----     ------                 ----                 ----                       -------
  Warning  FailedGetObjectMetric  1m (x2631 over 21h)  horizontal-pod-autoscaler  unable to get metric hpa_custom_metrics_deployment_queues_length: Deployment on default php-apache/unable to fetch metrics from custom metrics API: the server could not find the metric hpa_custom_metrics_deployment_queues_length for deployments.extensions

Then, i've tried to follow the official documentation, and did this:

apiVersion: monitoring.coreos.com/v1
kind: PrometheusRule
metadata:
  name: php-apache
  namespace: default   
  labels:
    prometheus: kube-prometheus
    role: alert-rules
    run: php-apache
    app: php-apache
spec: 
  rules:
  - seriesQuery: 'rabbitmq_queue_messages{namespace!="", pod=!="", queue=!""}'
    resources:
      overrides:
        queue: myqueue
        pod: {resource: "pod"}
        namespace: {resource: "namespace"}
    name:
      matches: "^(.*)_messages"
      as: "${1}_msgs_ariel"
    metricsQuery: 'avg(<<.Series>>{<<.LabelMatchers>>})'

in both tries, i don't see the metric here:
kubectl get --raw /apis/custom.metrics.k8s.io/v1beta1/

What have i missed?

@arielb135
Copy link
Author

So, i managed to get this to work, the following needs to be done:

**Few things that are important to do: **

Install prometheus-adapter+ metrics server:
https://github.com/helm/charts/tree/master/stable/metrics-server
https://github.com/helm/charts/tree/master/stable/prometheus-adapter

  • Note - in the adapter's values.yaml - you'll find the prometheus URL you need to adjust (in port 9090), as the official prometheus operator creates dynamically some endpoints called (X-operated) - i've used that, example:
prometheus:
  url: http://prometheus-operated.monitoring.svc
  port: 9090

You can check the logs to see if it's able to connect to prometheus, also note that i've deployed prometheus operator in the monitoring namespace (that's why the dns is monitoring.svc), if it's in default - do http://prometheus-operated.default.svc, etc...

  1. Make sure prometheus scrapes all namespaces, if you're using prometheus helm chart, add this:
    ## Namespaces to be selected for PrometheusRules discovery.
    ## If unspecified, only the same namespace as the Prometheus object is in is used.
    ##
    ruleNamespaceSelector: 
      any: true
  1. always always always - make sure your custom prometheus rules contain the same labels in prometheus' ruleSelector:
    ruleSelector:
    ## Example which select all prometheusrules resources
    ## with label "prometheus" with values any of "example-rules" or "example-rules-2"
    # ruleSelector:
    #   matchExpressions:
    #     - key: prometheus
    #       operator: In
    #       values:
    #         - example-rules
    #         - example-rules-2
    #
    ## Example which select all prometheusrules resources with label "role" set to "example-rules"
    # ruleSelector:
      matchLabels:
        role: my-rules
        prometheus: kube-prometheus
  1. Go to prometheus UI for example, decide which custom query you want to build - and test it:
    image

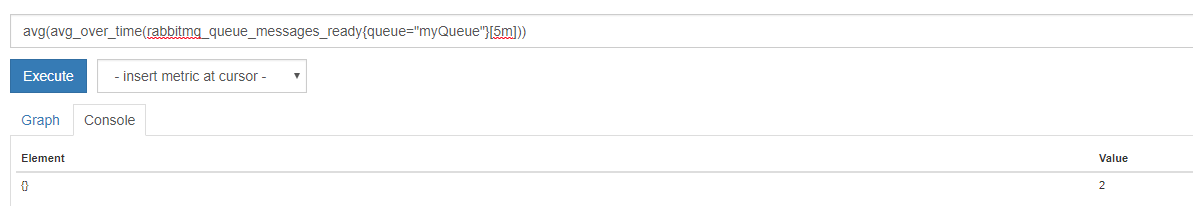
I've decided to do average of ready messages in the last 5 minutes.

  1. Create a PrometheusRule object and define the custom metric:
apiVersion: monitoring.coreos.com/v1
kind: PrometheusRule
metadata:
  name: someApp
  namespace: default   
  labels:
    prometheus: kube-prometheus
    role: my-rules
    app: someApp
spec: 
  groups:
  - name: myCustomRule
    rules:    
    - record: messages_waiting_in_queue
      expr: avg(avg_over_time(rabbitmq_queue_messages_ready{queue="myQueue"}[5m]))
      labels:
        namespace: default
        service: newCustomService

Few notes:

  • The labels must contain the values you did in rule selector in the prometheus (rule + prometheus in my side)
  • The spec's labels namespace must be the same namespace where the deployment and the hpa are deployed - default in my case.
  • the service name can be anything.

After applying the above, you can test it worked in few ways:

  • go to prometheus operator logs - see that no errors occured on the log when it scraped the new rule (typos, or wrong expressions...)
  • go to the shell of the prometheus operator, /etc/prometheus/rules/XXXrulefiles-0/ - see that you can see the new yaml file there (of the new rule) - and it's not empty.

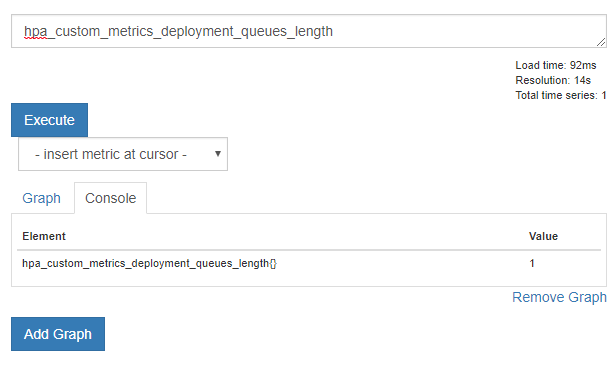
Now, perform: kubectl get --raw /apis/custom.metrics.k8s.io/v1beta1, search for your new rule under services:

{
      "name": "services/newCustomService",
      "singularName": "",
      "namespaced": true,
      "kind": "MetricValueList",
      "verbs": [
        "get"
      ]
    },

Perform and check the new custom metric with:
kubectl get --raw "/apis/custom.metrics.k8s.io/v1beta1/namespaces/default/services/newCustomService/messages_waiting_in_queue"

you can see it here:

{
  "kind": "MetricValueList",
  "apiVersion": "custom.metrics.k8s.io/v1beta1",
  "metadata": {
    "selfLink": "/apis/custom.metrics.k8s.io/v1beta1/namespaces/default/services/newCustomService/messages_waiting_in_queue"
  },
  "items": [
    {
      "describedObject": {
        "kind": "Service",
        "namespace": "default",
        "name": "newCustomService",
        "apiVersion": "/v1"
      },
      "metricName": "messages_waiting_in_queue",
      "timestamp": "2019-02-19T10:48:37Z",
      "value": "2"
    }
  ]
}
  • Note that we used the defined service name newCustomService (it doesn't matter what name is it) - and we will use it in the HPA.
  1. Finally create the HPA
apiVersion: autoscaling/v2beta1
kind: HorizontalPodAutoscaler
metadata:  
  labels:
    app: someApp
  name: someApp
  namespace: default    
spec:
  maxReplicas: 10
  minReplicas: 1
  scaleTargetRef:
    apiVersion: extensions/v1beta1
    kind: Deployment
    name: someApp
  metrics:
    - type: Object
      object:
        target:
          apiVersion: v1
          kind: Service
          name: newCustomService
        metricName: messages_waiting_in_queue
        targetValue: 100

Few important notes:

  • It must be in the same namespace of the PrometheusRule
  • about the metrics, the apiVersion is what you received in the "apiVersion": "/v1" when you queried the metric
  • the kind must be "Service"
  • the name of the service is what you defined before (unrelated to "Kubernetes service")

In the above, the autoscaler will kick in if there are on average more than 100 messages ready in queue for the last 5M.

Enjoy

@navathag
Copy link

navathag commented Oct 23, 2020

@DirectXMan12 @here could someone help me on this
At the custom metrics api endpoint i see the metrics and its value occassionally, it keeps disappearing often. What could be the reason for this

Thanks in advance

Sign up for free to join this conversation on GitHub. Already have an account? Sign in to comment
Labels
None yet
Projects
None yet
Development

No branches or pull requests

2 participants