Skip to content
New issue

Have a question about this project? Sign up for a free GitHub account to open an issue and contact its maintainers and the community.

By clicking “Sign up for GitHub”, you agree to our terms of service and privacy statement. We’ll occasionally send you account related emails.

Already on GitHub? Sign in to your account

Recurring high iowait due to kubelet 'du' process #61999

Closed
glennschmidt opened this issue Apr 2, 2018 · 25 comments
Closed

Recurring high iowait due to kubelet 'du' process #61999

glennschmidt opened this issue Apr 2, 2018 · 25 comments
Labels
kind/bug Categorizes issue or PR as related to a bug. sig/node Categorizes an issue or PR as relevant to SIG Node.

Comments

@glennschmidt
Copy link

/kind bug

What happened:

I'm using Kubernetes 1.8.7 installed on AWS with kops. Every now and again one of my nodes will enter a state where it becomes unable to measure overlay FS usage without causing extremely high IO wait. When this happens the host enters a loop which looks like this:

  1. Host load becomes very high and all workloads are affected for a few minutes
  2. Eventually the du processes start to time out with messages as shown below
  3. The host load recovers
  4. After a little while (between 2-20 minutes) it returns to step 1 and starts trying to run du again

Once this starts, it keeps repeating forever until I drain and replace the node.

The same symptoms are also described by another user in this comment:
#23255 (comment)
However I can't find an open issue specifically for this, which is why i'm logging one.

Anything else we need to know?:

The kubelet log is full of messages like this

fs.go:564] killing cmd [nice -n 19 du -s /var/lib/docker/overlay/bde4e4b217acb453858c9eed37cf088f3e01c64d56e8df94c7a4b4b4869e394f] due to timeout(2m0s)
fsHandler.go:121] failed to collect filesystem stats - rootDiskErr: du command failed on /var/lib/docker/overlay/4e549e6b32509edf87ccc3c120484b88d26d79fa8a205ea64d3cf45d7f225672 with output stdout: , stderr:  - signal: killed, rootInodeErr: <nil>, extraDiskErr: <nil>
fsHandler.go:131] du and find on following dirs took 2m3.835260669s: [/var/lib/docker/overlay/4e549e6b32509edf87ccc3c120484b88d26d79fa8a205ea64d3cf45d7f225672 /var/lib/docker/containers/1ba1422e4d78656cf9d3c1eee4e32511ada570369dadda7ff48733b80f330e1f]
fsHandler.go:121] failed to collect filesystem stats - rootDiskErr: du command failed on /var/lib/docker/overlay/bde4e4b217acb453858c9eed37cf088f3e01c64d56e8df94c7a4b4b4869e394f with output stdout: , stderr:  - signal: killed, rootInodeErr: <nil>, extraDiskErr: <nil>
fsHandler.go:131] du and find on following dirs took 2m2.80314731s: [/var/lib/docker/overlay/bde4e4b217acb453858c9eed37cf088f3e01c64d56e8df94c7a4b4b4869e394f /var/lib/docker/containers/73944dfc818609292fee83e86e1fcf1c89b92cbae00b0e250911027894de8a04]
fs.go:564] killing cmd [nice -n 19 du -s /var/lib/docker/overlay/908e2f4855747319fd0451a4f62312eef69353239a1c4d4683f33032f42d31b4] due to timeout(2m0s)
fsHandler.go:121] failed to collect filesystem stats - rootDiskErr: du command failed on /var/lib/docker/overlay/908e2f4855747319fd0451a4f62312eef69353239a1c4d4683f33032f42d31b4 with output stdout: , stderr:  - signal: killed, rootInodeErr: <nil>, extraDiskErr: <nil>
fsHandler.go:131] du and find on following dirs took 2m1.195693546s: [/var/lib/docker/overlay/908e2f4855747319fd0451a4f62312eef69353239a1c4d4683f33032f42d31b4 /var/lib/docker/containers/7ecde624cd22d06af3b21c36a829d97b6e7f7a11e3cfa007fd72ada8fcf57d2a]
summary.go:92] Failed to get system container stats for "/system.slice/kubelet.service": failed to get cgroup stats for "/system.slice/kubelet.service": failed to get container info for "/system.slice/kubelet.service": unknown container "/system.slice/kubelet.service"
summary.go:92] Failed to get system container stats for "/system.slice/docker.service": failed to get cgroup stats for "/system.slice/docker.service": failed to get container info for "/system.slice/docker.service": unknown container "/system.slice/docker.service"
fs.go:564] killing cmd [nice -n 19 du -s /var/lib/docker/overlay/927e65038a4aeb39c46461ed7ee2445495b2dba11dcb790bbe315e267da7ebe6] due to timeout(2m0s)
fsHandler.go:121] failed to collect filesystem stats - rootDiskErr: du command failed on /var/lib/docker/overlay/927e65038a4aeb39c46461ed7ee2445495b2dba11dcb790bbe315e267da7ebe6 with output stdout: , stderr:  - signal: killed, rootInodeErr: <nil>, extraDiskErr: <nil>
fsHandler.go:131] du and find on following dirs took 2m2.90814158s: [/var/lib/docker/overlay/927e65038a4aeb39c46461ed7ee2445495b2dba11dcb790bbe315e267da7ebe6 /var/lib/docker/containers/30fc57f794d5e957d6586802ff2a144a604551ae058e132c8bec875e0306873e]

If I manually run du against one of the overlay directories that timed out in the log, it returns a result almost immediately

# du -s bde4e4b217acb453858c9eed37cf088f3e01c64d56e8df94c7a4b4b4869e394f
824240	bde4e4b217acb453858c9eed37cf088f3e01c64d56e8df94c7a4b4b4869e394f

Any suggestions about how to debug this are appreciated. I've tried to figure out which container filesystems are specifically causing the problem, but I'm not sure how to approach that, since I can't find any one particular du command line that hangs for a long time.

Environment:

  • Kubernetes version (use kubectl version): 1.8.7
  • Cloud provider or hardware configuration: AWS
  • OS (e.g. from /etc/os-release): Debian Jessie
  • Kernel (e.g. uname -a): 4.4.115-k8s Unit test coverage in Kubelet is lousy. (~30%) #1 SMP Thu Feb 8 15:37:40 UTC 2018 x86_64 GNU/Linux
  • Install tools: kops
  • Others:
@k8s-ci-robot k8s-ci-robot added needs-sig Indicates an issue or PR lacks a `sig/foo` label and requires one. kind/bug Categorizes issue or PR as related to a bug. labels Apr 2, 2018
@dims
Copy link
Member

dims commented Apr 2, 2018

/sig node

@k8s-ci-robot k8s-ci-robot added sig/node Categorizes an issue or PR as relevant to SIG Node. and removed needs-sig Indicates an issue or PR lacks a `sig/foo` label and requires one. labels Apr 2, 2018
@glennschmidt
Copy link
Author

I've confirmed that the iowait issue starts when the node exhausts its IOPS burst balance for the root EBS volume. I've raised the IOPS limit for the time being by provisioning more expensive storage, but the question is why this node is generating so much I/O. Overall, the cluster is very lightly loaded (the web applications being hosted are low traffic).

When I run iotop, the only things that seem to show high numbers are always du processes. According to AWS metrics:

  • the node is continually hovering around 1000 read IOPS
  • the read throughput is about 5MB/s
  • the write activity in comparison is tiny, about 3 IOPS and 25KB/s
  • average CPU usage is only about 15%

@maxx-bachurin
Copy link

It's likely that du burns all Burst Balance for the gp2 ebs volume. You can check it in AWS CloudWatch.
It seems du -s /var/lib/docker/overlay/ consumes a lot of IOPs during the check which burns Burst Balance for the gp2 ebs volume and makes it work at baseline performance.

You can use a simple check to find out iops consumption for du:

\time -f 'iops=%w' du /var/lib/docker/overlay/f8fb07fef9498184c4b2dfd7db4270dfadbe15d3bf59727ac23d4e6363f4595f > /dev/null

In my case the result is:
iops=5421

don't forget to drop fs cache before second run to get correct iops figures:

sudo echo 3 >/proc/sys/vm/drop_caches

@glennschmidt
Copy link
Author

Agreed, that's likely the cause.

But i'm not sure why the command it runs is
du -s /var/lib/docker/overlay/<uuid>
Won’t this measure the merged filesystem as well (including everything in the image)? Shouldn’t it instead run
du -s /var/lib/docker/overlay/<uuid>/upper
to just count the writable layer?

If it needs to know the size of the (read-only) container image, it could just calculate it once when the image is pulled.
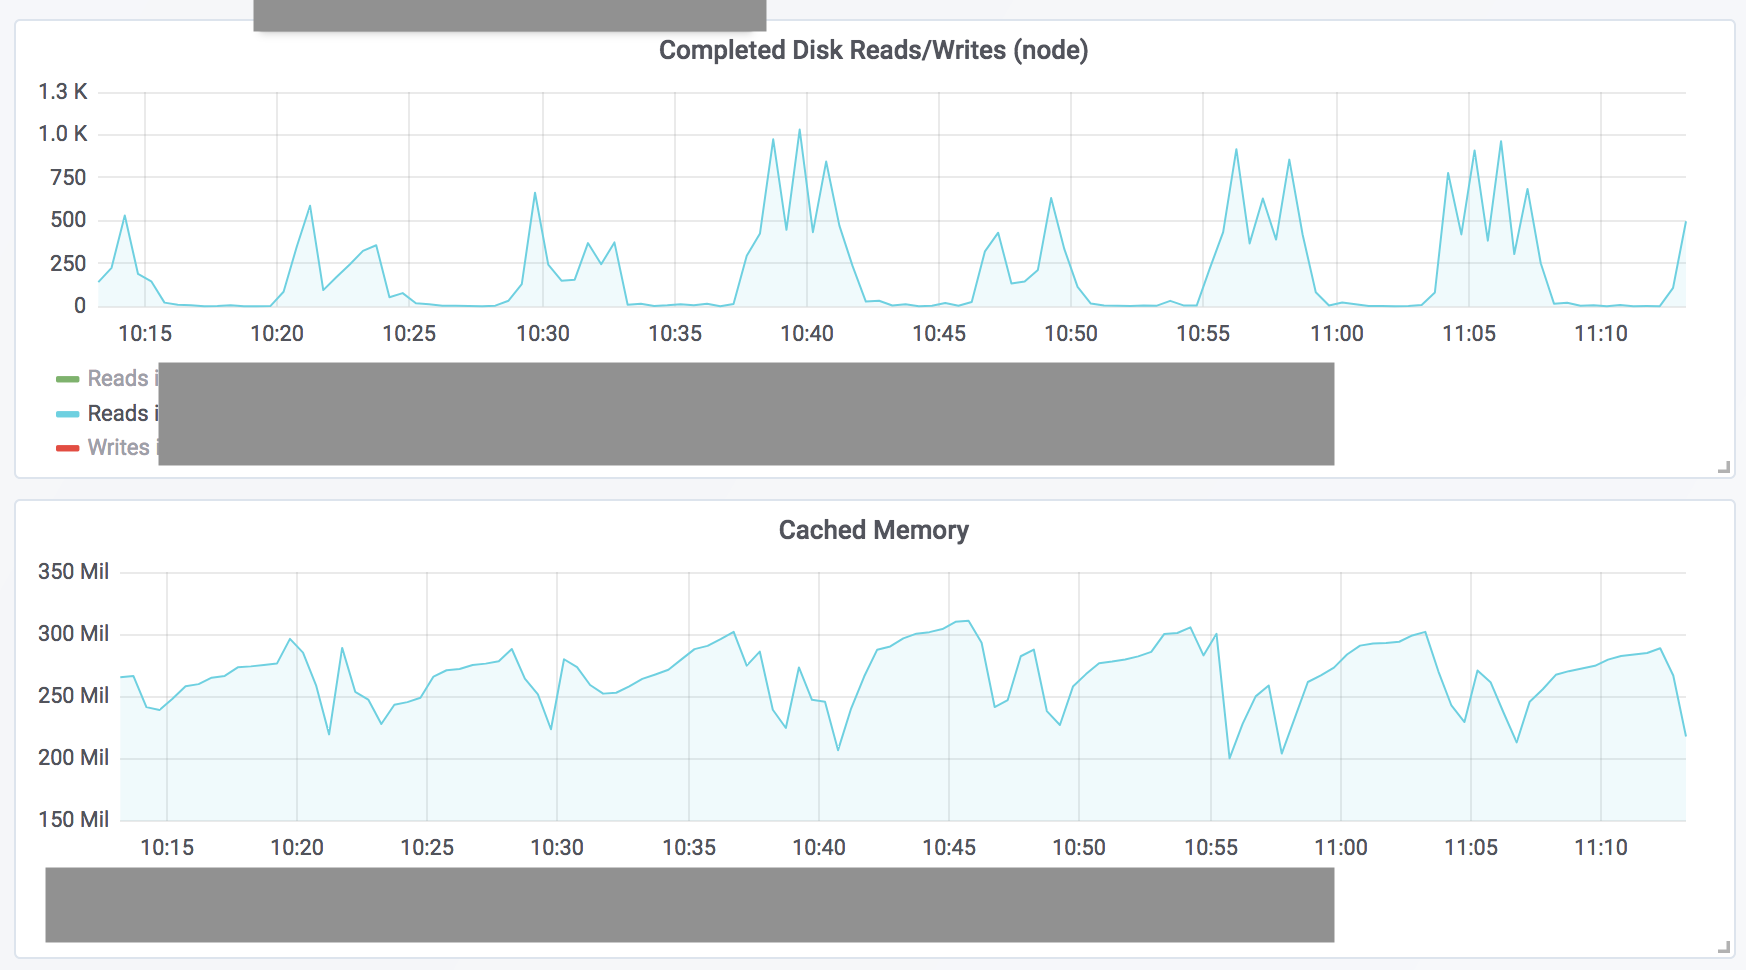
@mfrister
Copy link

mfrister commented May 3, 2018

We have the same issue (du burning the EBS disk burst balance).

It only appears on nodes with high memory usage, so my current theory is this: When the kernel's disk cache can no longer hold the filesystem metadata du regularly reads, the reads go to the EBS volume, which is significantly slower and results in the du and find on following dirs took log messages appearing. As soon as the EBS burst balance is used up, the whole node is more or less unusable as du saturates the remaining disk i/o and i/o requests are so slow that app health checks start timing out.

Excerpt from /proc/meminfo:

MemTotal:        8178056 kB
MemAvailable:     779988 kB
Cached:           226324 kB
Click for full `/proc/meminfo`
MemTotal:        8178056 kB
MemFree:          190844 kB
MemAvailable:     779988 kB
Buffers:           88892 kB
Cached:           226324 kB
SwapCached:            0 kB
Active:          7062952 kB
Inactive:         135024 kB
Active(anon):    6885820 kB
Inactive(anon):     1068 kB
Active(file):     177132 kB
Inactive(file):   133956 kB
Unevictable:           0 kB
Mlocked:               0 kB
SwapTotal:             0 kB
SwapFree:              0 kB
Dirty:              1232 kB
Writeback:             0 kB
AnonPages:       6882688 kB
Mapped:           158660 kB
Shmem:              4224 kB
Slab:             612732 kB
SReclaimable:     531460 kB
SUnreclaim:        81272 kB
KernelStack:       46272 kB
PageTables:        38492 kB
NFS_Unstable:          0 kB
Bounce:                0 kB
WritebackTmp:          0 kB
CommitLimit:     4089028 kB
Committed_AS:   18843660 kB
VmallocTotal:   34359738367 kB
VmallocUsed:           0 kB
VmallocChunk:          0 kB
HardwareCorrupted:     0 kB
AnonHugePages:         0 kB
HugePages_Total:       0
HugePages_Free:        0
HugePages_Rsvd:        0
HugePages_Surp:        0
Hugepagesize:       2048 kB
DirectMap4k:       81920 kB
DirectMap2M:     8306688 kB

We also had a java app crash-looping (too low memory request), which didn't exactly improve things, but might explain the ~800MB of available memory that is not used as disk cache.

We'll try and increase the system memory reservation by 500 MiB (expecting it will be used as disk cache), and see whether the problem reappears.

Update: 400 MiB more RAM didn't help. There's now quite a bit of free (not only available) RAM and the issue still occurs.

@mfrister
Copy link

mfrister commented May 8, 2018

Summary: In our case, 400 MiB additional system memory reservation weren't enough, but 800 MiB were.

Details:

After a system memory reservation increase by 400MiB wasn't enough, I noticed that one machine was having high I/O regularly for a few minutes (5 minutes high I/O, 5 minutes normal I/O).

When looking into it, I noticed a Java app crashlooping. Giving my previous idea (not all filesystem metadata read by du/find being cached in memory under memory pressure) another shot, I had a look the filesystem cache size (Cached from /proc/meminfo). This is what I found:

screen shot 2018-05-08 at 11 13 14

It looks like the Java app starting results in the kernel giving up part of the disk cache, which in turn results in du/find I/O requests going to the actual disk.

I also found that we have quite a few Docker images with a high number of files (10k-90k), which probably impacts the amount of memory we need as a filesystem cache and the amount of I/O happening when Kubernetes (apparently kubelet) runs du and find.


In general, a nodes' performance heavily depending on the amount of memory available for caching filesystem metadata, related to the number of files in the Docker images running on the node, seems quite unpredictable.

I'm not sure what a good solution could look like - I don't see a simple way to calculate disk usage without iterating over files.

Running du and find not only with nice, which only affects CPU scheduling (as far as I know), but also with ionice could be a start to ensure that workloads can still get disk I/O completed, even if du and find would otherwise exhaust disk I/O.

An additional measure (that would be useful anyway) could be to limit the number of concurrent du and find processes running.

@dims
Copy link
Member

dims commented May 8, 2018

cc @dashpole David, the du seems to be from cadvisor:
https://github.com/google/cadvisor/blob/master/fs/fs.go#L557

/sig node

@dims
Copy link
Member

dims commented May 8, 2018

@glennschmidt
Copy link
Author

I'm not sure what a good solution could look like - I don't see a simple way to calculate disk usage without iterating over files.

I think the problem is that it seems to iterate over every file in the image filesystem, which could be an entire operating system's worth (eg. if the image is based on Debian) for every container present. It should just iterate the writable layer.

@dashpole
Copy link
Contributor

dashpole commented May 8, 2018

every file in the image filesystem

This shouldn't be the case, we only run du and find on the writable layer of containers. We also run it on logs and empty-dir backed volumes as well.

@dims
Copy link
Member

dims commented May 8, 2018

@meeee fyi, we already have a limit of concurrent commands to 20 - https://github.com/google/cadvisor/blob/master/fs/fs.go#L51

@glennschmidt
Copy link
Author

@dashpole It doesn't seem to be cadvisor that's running du, in my case it's kubelet
Below is an excerpt from pstree -al

  ├─kubelet --allow-privileged=true --cgroup-root=/ --cloud-provider=aws --cluster-dns=x.x.x.x --cluster-domain=cluster.local --enable-debugging-handlers=true --eviction-hard=memory.available<100Mi,nodefs.available<10%,nodefs.inodesFree<5%,imagefs.available<10%,imagefs.inodesFree<5% --feature-gates=ExperimentalCriticalPodAnnotation=true --hostname-override=x.x.x.x --kubeconfig=/var/lib/kubelet/kubeconfig --network-plugin-mtu=9001 --network-plugin=kubenet --node-labels=kubernetes.io/role=node,node-role.kubernetes.io/node= --non-masquerade-cidr=x.x.x.x/y --pod-infra-container-image=gcr.io/google_containers/pause-amd64:3.0 --pod-manifest-path=/etc/kubernetes/manifests --register-schedulable=true --require-kubeconfig=true --v=2 --cni-bin-dir=/opt/cni/bin/ --cni-conf-dir=/etc/cni/net.d/ --network-plugin-dir=/opt/cni/bin/
  │   ├─du -s /var/lib/docker/overlay/60dd6beb9dd341602b06c768620184d6ff1c55fe01b93e6a2f9bd1d99ba4fba6
  │   ├─du -s /var/lib/docker/overlay/51880e03db78fd63d108a637c0f2f5d22b06892486c5ba9028efb02f79bbcfa9
  │   └─33*[{kubelet}]

If it was measuring the writable layer, I think the overlay path would end with /upper

@dims
Copy link
Member

dims commented May 9, 2018

@glennschmidt the cadvisor code is running as part of the kubelet ( it's started here https://github.com/kubernetes/kubernetes/blob/master/pkg/kubelet/kubelet.go#L670 )

@dashpole
Copy link
Contributor

dashpole commented May 9, 2018

@glennschmidt Monitoring the writable layer for overlay was fixed in 1.10. Overlay2 was fixed in 1.9

@glennschmidt
Copy link
Author

@dashpole Kubernetes 1.10? Hmm..I'm using 1.8 so in that case I don't know what's going on.

I'm fairly confident it's measuring the whole filesystem. My writable layers are tiny (<20 files and <50KB) so I doubt i'd be seeing these problems if it was just looking at the writable layers.

@dashpole
Copy link
Contributor

@glennschmidt it is measuring the whole filesystem. I am saying that the issue is fixed in newer versions. It affects older versions going back to 1.4, when it was added.

@glennschmidt
Copy link
Author

@dashpole Whoops sorry I misread 1.10 as 1.1. Thanks for the explanation, I'll upgrade once 1.10 becomes supported with kops and hopefully it will address my problem.

@markhilton
Copy link

I was able to resolve the issue by editing kops cluster.spec with kops edit cluster [cluster_name].
I added following under specs:

  docker:
    logDriver: json-file
    logLevel: warn
    storage: overlay2

It looks like by default kops configures docker to use overlay as default storage driver, while docker recommends using overlay2 as newer, more stable and faster.

@glennschmidt
Copy link
Author

@markhilton I've done this too, and also upgraded to 1.9. I'll just wait and make sure the problem doesn't re-occur for a while, before closing the issue.

@gautamdivgi
Copy link

gautamdivgi commented Aug 16, 2018

@dims @dashpole - I'm looking at this issue as well and there does seem to be some indication that having directories with a large number of files (still working to quantify "large") can cause this. Using 1.8 at the moment and looking to move to overlay2 and 1.9. Apart from that just re-initializing the overlay and container directories seems to have helped as well with 1.8 and overlay.

The one thing I noticed in the code at https://github.com/google/cadvisor/blob/master/fs/fs.go#L62 and https://github.com/google/cadvisor/blob/master/fs/fs.go#L66 is that although the maxConcurrentOps is set to 20, the channel is blocking. This can potentially have the effect of a backup of du/find requests. Any thoughts on making it non-blocking and returning an error if it is over the maxConcurrentOps limit? The kubelet won't be able to compute usage for that iteration but it will avoid a large backlog of requests for du and find.

Apologies for the many edits... I've created an issue in cadvisor if we want to move forward with this. I can submit a PR if needed - google/cadvisor#2022

@glennschmidt
Copy link
Author

I haven't experienced this problem again since switching to overlay2 and upgrading to 1.9. I'm going to close this issue since it sounds like they've also fixed it for the overlay filesystem in 1.10

@0312birdzhang
Copy link

I haven't experienced this problem again since switching to overlay2 and upgrading to 1.9. I'm going to close this issue since it sounds like they've also fixed it for the overlay filesystem in 1.10

This issue still exist.
docker info:

Containers: 20
 Running: 20
 Paused: 0
 Stopped: 0
Images: 317
Server Version: 18.06.2-ce
Storage Driver: **overlay2**
 Backing Filesystem: xfs
 Supports d_type: true
 Native Overlay Diff: true
Logging Driver: json-file
Cgroup Driver: cgroupfs
Plugins:
 Volume: local
 Network: bridge host macvlan null overlay
 Log: awslogs fluentd gcplogs gelf journald json-file logentries splunk syslog
Swarm: inactive
Runtimes: runc
Default Runtime: runc
Init Binary: docker-init
containerd version: 468a545b9edcd5932818eb9de8e72413e616e86e
runc version: 69663f0bd4b60df09991c08812a60108003fa340
init version: fec3683
Security Options:
 seccomp
  Profile: default
Kernel Version: 4.18.5-1.el7.elrepo.x86_64
Operating System: CentOS Linux 7 (Core)
OSType: linux
Architecture: x86_64
CPUs: 8
Total Memory: 7.78GiB

kubectl version: v1.11.7

/var/log/message :

Jun 10 13:32:42 pk8snode05 kubelet: I0610 13:32:42.668544   26639 fsHandler.go:135] du and find on following dirs took 1.47873429s: [/data/kubernetes/docker/overlay2/31f188d13d11d02e722ad64f57bb932179d227b483fbe70f05a0e9af5dbf9546/diff /data/kubernetes/docker/containers/62a8f7d4aa8c01d8579a42527eee63c55fb267736d22595f5179de8b05cd25e9]; will not log again for this container unless duration exceeds 2s
Jun 10 13:32:42 pk8snode05 kubelet: I0610 13:32:42.668554   26639 fsHandler.go:135] du and find on following dirs took 1.443599699s: [/data/kubernetes/docker/overlay2/323879915c222f0a3da5fded22edac21cc7de66aa4926f85ef8984e0596bfb48/diff /data/kubernetes/docker/containers/5ce374df44c3c5fa10dc6ddffe2f0058cbf69e5cf96493f6e89cb16b9da3bb16]; will not log again for this container unless duration exceeds 2s
Jun 10 13:32:42 pk8snode05 kubelet: I0610 13:32:42.700272   26639 fsHandler.go:135] du and find on following dirs took 1.472705354s: [/data/kubernetes/docker/overlay2/e5c974f39f517e7094606277d9dd042c3bbb559eccdeab8f3b4309bff7046a5f/diff /data/kubernetes/docker/containers/a52688b25c72651d9bab8154f485b62346cbda62079704425c48678e29edc155]; will not log again for this container unless duration exceeds 2s
Jun 10 13:33:24 pk8snode05 kubelet: W0610 13:33:10.098539   26639 prober.go:103] No ref for container "docker://5cdb87de9da88e4158ed66bbae1f92831e4f8e0406481bd1629e5b96814f2257" (calico-node-2rnrp_kube-system(943be1ca-33f8-11e9-9dce-005056a34766):calico-node)
Jun 10 13:33:24 pk8snode05 kubelet: I0610 13:33:10.098574   26639 prober.go:111] Liveness probe for "calico-node-2rnrp_kube-system(943be1ca-33f8-11e9-9dce-005056a34766):calico-node" failed (failure): Get http://10.8.28.35:9099/liveness: net/http: request canceled (Client.Timeout exceeded while awaiting headers)
Jun 10 13:33:27 pk8snode05 kubelet: W0610 13:33:27.191626   26639 prober.go:103] No ref for container "docker://5cdb87de9da88e4158ed66bbae1f92831e4f8e0406481bd1629e5b96814f2257" (calico-node-2rnrp_kube-system(943be1ca-33f8-11e9-9dce-005056a34766):calico-node)
Jun 10 13:33:27 pk8snode05 kubelet: I0610 13:33:27.191680   26639 prober.go:111] Readiness probe for "calico-node-2rnrp_kube-system(943be1ca-33f8-11e9-9dce-005056a34766):calico-node" failed (failure): Get http://10.8.28.35:9099/readiness: net/http: request canceled (Client.Timeout exceeded while awaiting headers)
Jun 10 13:33:32 pk8snode05 kubelet: W0610 13:33:29.746376   26639 prober.go:103] No ref for container "docker://5cdb87de9da88e4158ed66bbae1f92831e4f8e0406481bd1629e5b96814f2257" (calico-node-2rnrp_kube-system(943be1ca-33f8-11e9-9dce-005056a34766):calico-node)
Jun 10 13:33:33 pk8snode05 kubelet: I0610 13:33:29.746477   26639 prober.go:111] Liveness probe for "calico-node-2rnrp_kube-system(943be1ca-33f8-11e9-9dce-005056a34766):calico-node" failed (failure): Get http://10.8.28.35:9099/liveness: net/http: request canceled (Client.Timeout exceeded while awaiting headers)
Jun 10 13:33:33 pk8snode05 kubelet: W0610 13:33:32.979235   26639 prober.go:103] No ref for container "docker://5cdb87de9da88e4158ed66bbae1f92831e4f8e0406481bd1629e5b96814f2257" (calico-node-2rnrp_kube-system(943be1ca-33f8-11e9-9dce-005056a34766):calico-node)
Jun 10 13:33:33 pk8snode05 kubelet: I0610 13:33:32.979290   26639 prober.go:111] Readiness probe for "calico-node-2rnrp_kube-system(943be1ca-33f8-11e9-9dce-005056a34766):calico-node" failed (failure): Get http://10.8.28.35:9099/readiness: net/http: request canceled while waiting for connection (Client.Timeout exceeded while awaiting headers)
Jun 10 13:33:34 pk8snode05 kubelet: W0610 13:33:33.486463   26639 prober.go:103] No ref for container "docker://5cdb87de9da88e4158ed66bbae1f92831e4f8e0406481bd1629e5b96814f2257" (calico-node-2rnrp_kube-system(943be1ca-33f8-11e9-9dce-005056a34766):calico-node)
Jun 10 13:33:34 pk8snode05 kubelet: I0610 13:33:33.486501   26639 prober.go:111] Liveness probe for "calico-node-2rnrp_kube-system(943be1ca-33f8-11e9-9dce-005056a34766):calico-node" failed (failure): Get http://10.8.28.35:9099/liveness: net/http: request canceled while waiting for connection (Client.Timeout exceeded while awaiting headers)
Jun 10 13:33:46 pk8snode05 kubelet: W0610 13:33:44.989360   26639 prober.go:103] No ref for container "docker://5cdb87de9da88e4158ed66bbae1f92831e4f8e0406481bd1629e5b96814f2257" (calico-node-2rnrp_kube-system(943be1ca-33f8-11e9-9dce-005056a34766):calico-node)
Jun 10 13:33:46 pk8snode05 kubelet: I0610 13:33:44.999462   26639 prober.go:111] Readiness probe for "calico-node-2rnrp_kube-system(943be1ca-33f8-11e9-9dce-005056a34766):calico-node" failed (failure): HTTP probe failed with statuscode: 503
Jun 10 13:33:46 pk8snode05 kubelet: W0610 13:33:45.847407   26639 prober.go:103] No ref for container "docker://5cdb87de9da88e4158ed66bbae1f92831e4f8e0406481bd1629e5b96814f2257" (calico-node-2rnrp_kube-system(943be1ca-33f8-11e9-9dce-005056a34766):calico-node)
Jun 10 13:33:46 pk8snode05 kubelet: I0610 13:33:45.847459   26639 prober.go:111] Liveness probe for "calico-node-2rnrp_kube-system(943be1ca-33f8-11e9-9dce-005056a34766):calico-node" failed (failure): Get http://10.8.28.35:9099/liveness: net/http: request canceled (Client.Timeout exceeded while awaiting headers)
Jun 10 13:33:50 pk8snode05 kubelet: I0610 13:33:47.007431   26639 container_manager_linux.go:428] [ContainerManager]: Discovered runtime cgroups name: /system.slice/docker.service
Jun 10 13:35:29 pk8snode05 kubelet: E0610 13:35:25.784490   26639 remote_runtime.go:262] ListContainers with filter &ContainerFilter{Id:,State:nil,PodSandboxId:,LabelSelector:map[string]string{},} from runtime service failed: rpc error: code = DeadlineExceeded desc = context deadline exceeded
Jun 10 13:35:31 pk8snode05 kubelet: E0610 13:35:25.784630   26639 kuberuntime_container.go:329] getKubeletContainers failed: rpc error: code = DeadlineExceeded desc = context deadline exceeded
Jun 10 13:35:34 pk8snode05 kubelet: E0610 13:35:25.784668   26639 generic.go:197] GenericPLEG: Unable to retrieve pods: rpc error: code = DeadlineExceeded desc = context deadline exceeded
Jun 10 13:35:35 pk8snode05 kubelet: W0610 13:35:26.019315   26639 fs.go:586] Killing cmd [ionice -c3 nice -n 19 du -s /data/kubernetes/docker/overlay2/ed998333d0320ce7445417d1e0363b0f1a6000769ac48b2f424de4dfcf89fda5/diff] due to timeout(2m0s)
Jun 10 13:35:35 pk8snode05 kubelet: E0610 13:35:26.149695   26639 remote_image.go:67] ListImages with filter nil from image service failed: rpc error: code = DeadlineExceeded desc = context deadline exceeded
Jun 10 13:35:35 pk8snode05 kubelet: E0610 13:35:26.149793   26639 kuberuntime_image.go:136] ListImages failed: rpc error: code = DeadlineExceeded desc = context deadline exceeded
Jun 10 13:35:35 pk8snode05 kubelet: E0610 13:35:26.149830   26639 handler.go:288] HTTP InternalServerError serving /stats/summary: Internal Error: failed to get imageFs stats: failed to get image stats: rpc error: code = DeadlineExceeded desc = context deadline exceeded
Jun 10 13:35:35 pk8snode05 kubelet: E0610 13:35:24.949912   26639 remote_runtime.go:169] ListPodSandbox with filter &PodSandboxFilter{Id:,State:&PodSandboxStateValue{State:SANDBOX_READY,},LabelSelector:map[string]string{},} from runtime service failed: rpc error: code = DeadlineExceeded desc = context deadline exceeded
Jun 10 13:35:35 pk8snode05 kubelet: E0610 13:35:26.268450   26639 kuberuntime_sandbox.go:198] ListPodSandbox failed: rpc error: code = DeadlineExceeded desc = context deadline exceeded
Jun 10 13:35:35 pk8snode05 kubelet: E0610 13:35:26.268471   26639 kubelet_pods.go:1019] Error listing containers: &status.statusError{Code:4, Message:"context deadline exceeded", Details:[]*any.Any(nil)}
Jun 10 13:35:35 pk8snode05 kubelet: E0610 13:35:26.268518   26639 kubelet.go:1922] Failed cleaning pods: rpc error: code = DeadlineExceeded desc = context deadline exceeded
Jun 10 13:35:35 pk8snode05 kubelet: I0610 13:35:26.268543   26639 kubelet.go:1771] skipping pod synchronization - [container runtime is down]
Jun 10 13:35:35 pk8snode05 kubelet: W0610 13:35:25.132549   26639 fs.go:586] Killing cmd [ionice -c3 nice -n 19 du -s /data/kubernetes/docker/overlay2/279c8a637ed61a65d7b00cc0b4c56a81f85a61252adda29ce58da02d1dfd6f82/diff] due to timeout(2m0s)

@YongBig
Copy link

YongBig commented Jul 15, 2019

@0312birdzhang This problem how to solve?

@0312birdzhang
Copy link

@du86796922 Not yet, but you can scale down the pods running on one node, then du and ionice will not execute.

@YongBig
Copy link

YongBig commented Jul 15, 2019

@0312birdzhang Thank you for your advice. I will try it.

Sign up for free to join this conversation on GitHub. Already have an account? Sign in to comment
Labels
kind/bug Categorizes issue or PR as related to a bug. sig/node Categorizes an issue or PR as relevant to SIG Node.
Projects
None yet
Development

No branches or pull requests

10 participants