Authors: #IchBinHanna Research Collective (in alphabetic order: David Adler, Migle Bareikyte, Elen Le Foll, Christian Funk, Stefan Laser, Jana Lasser)
This is a collaborative project that sits at the intersection of campaigning and doing (computational) social science research. We want to acknowledge the people who respond to this hashtag and feel responsible for it. Yet, we also want to capture the specificity of political dynamics more generally and to this end understand Twitter interactions as generative: they actively shape the discourse; users respond to each other explicitly or implicitly; the media, politicians and "external" actors learn, intervene or engage. As we ourselves "are Hanna", our resources are limited. But our aspiration is to combine quantitative with qualitative approaches.
Due to private matters, not least the war on Ukraine, this project is on hold. However, you can find first results in #IchBinHanna publications, e.g. the Suhrkamp volume.

So far, we have included data for multiple hashtags of interest, from the time period between 2018-01-01 to 2021-07-04 (update), >75,000 tweets stored in individual data files:
- #WissZeitVG: this is the "baseline" hashtag, referring to the law that governs academic employment in Germany. There was constant tweet activity with this hashtag throughout.
- #FristIstFrust: this hashtag became popular in early 2019 and has been around ever since.
- #95vsWissZeitVG: this hashtag became popular in mid 2020 and has been around ever since.
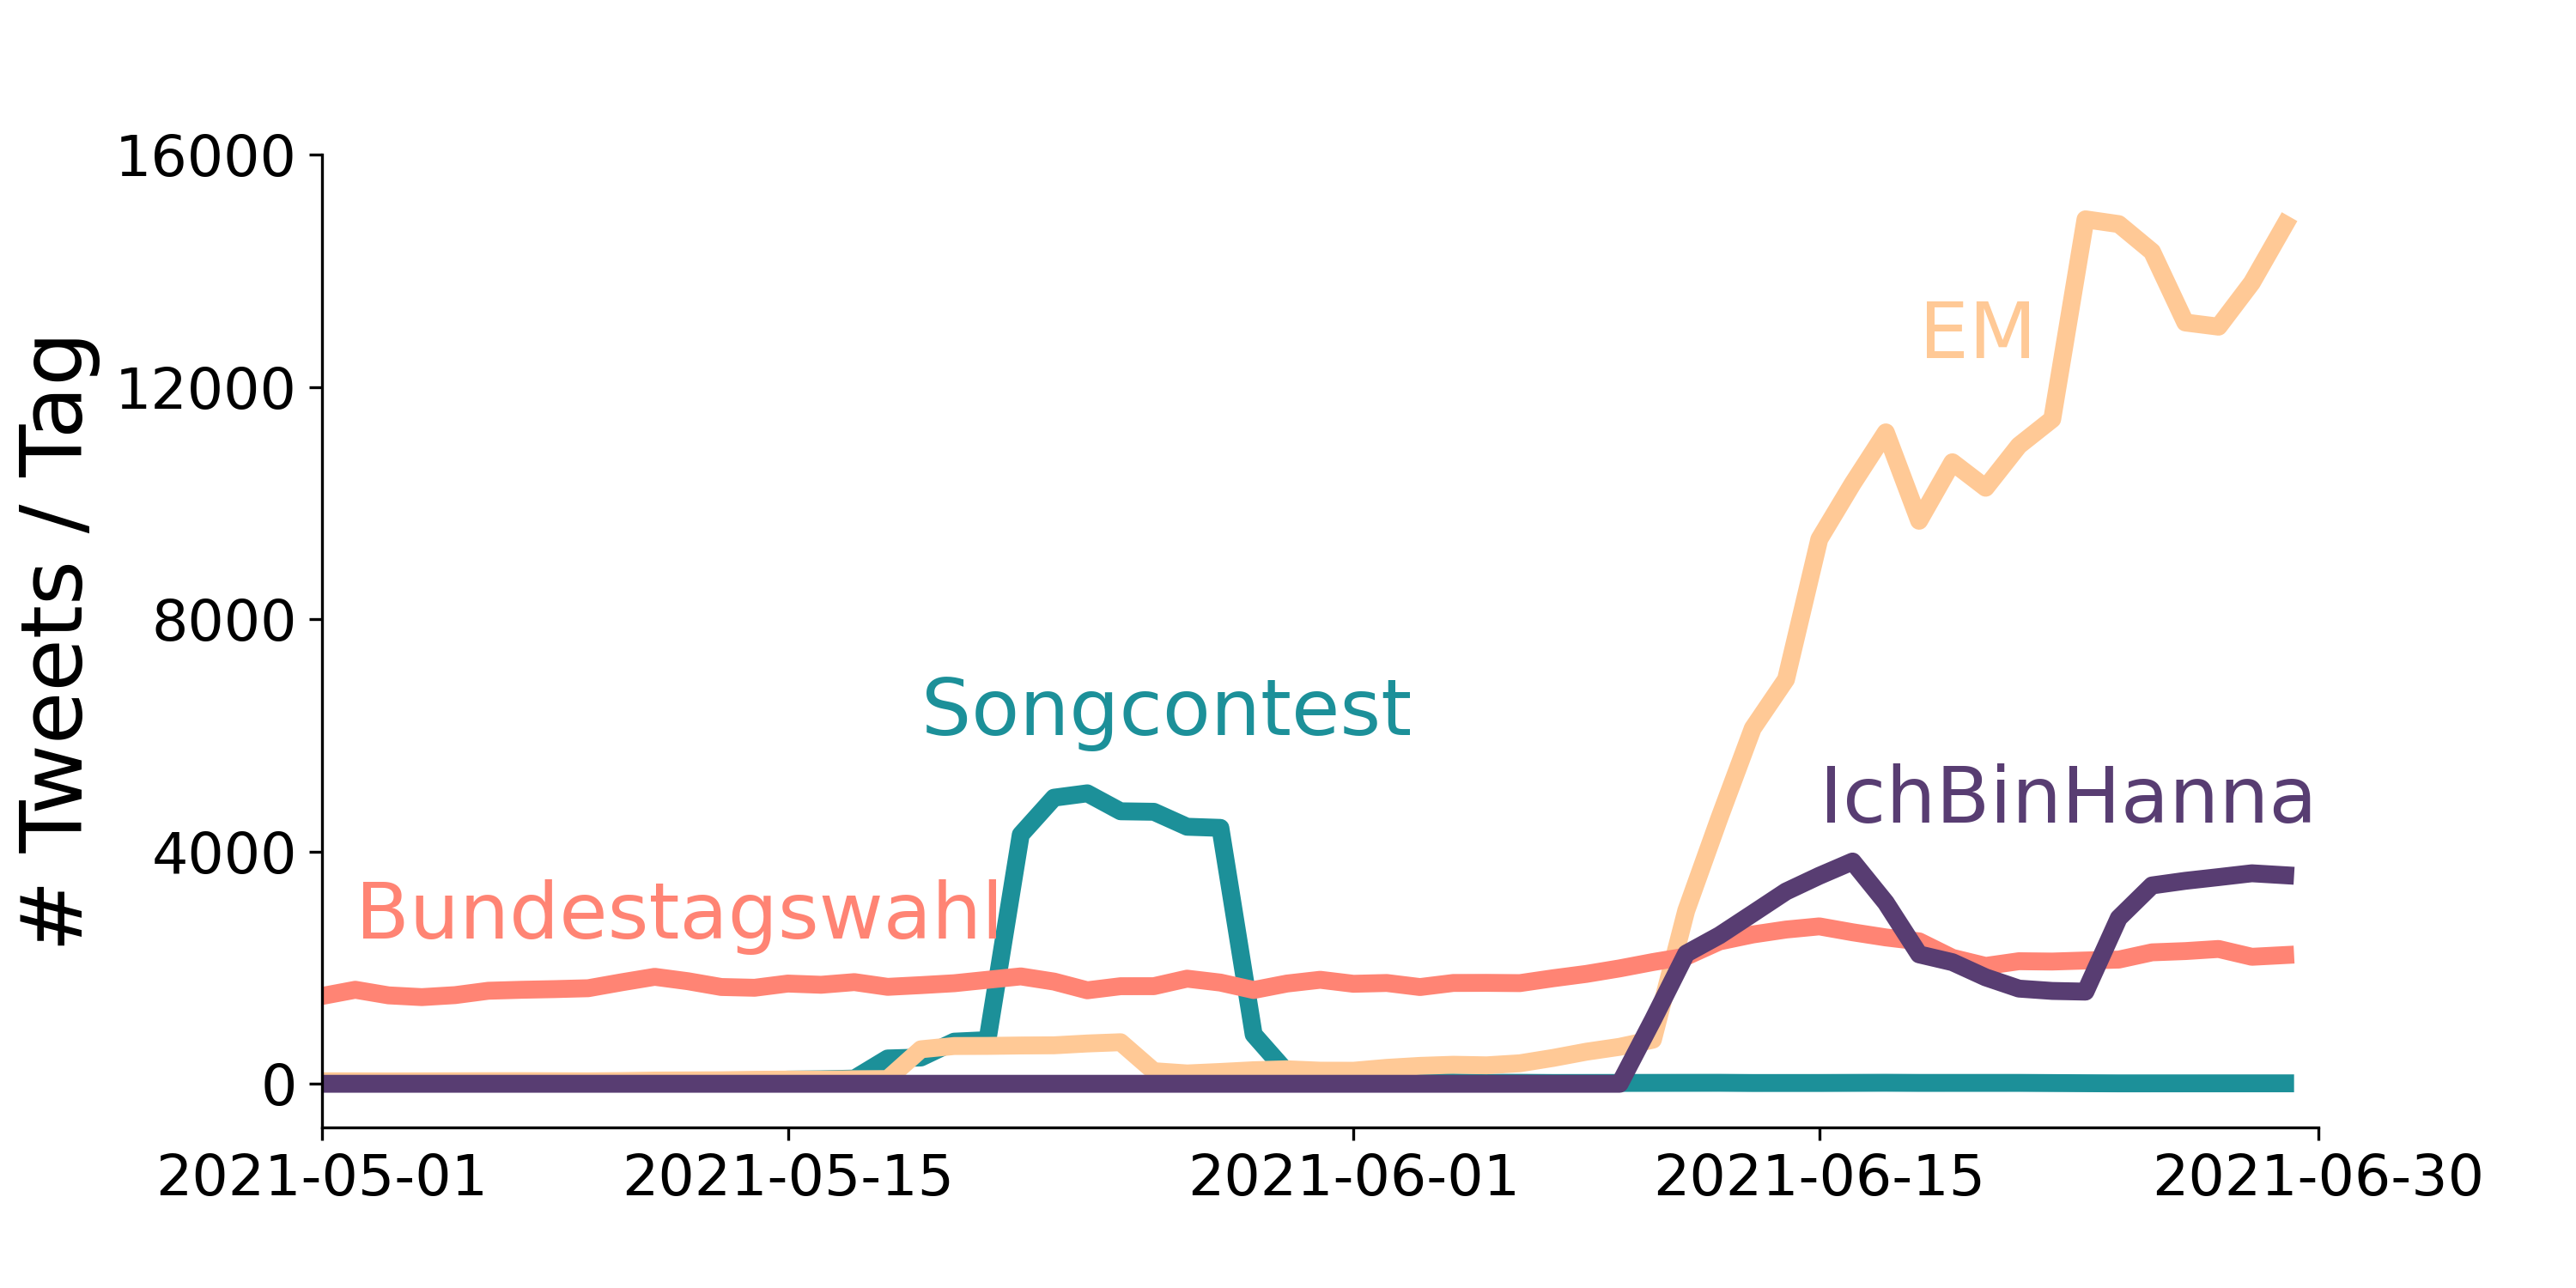
- #IchBinHanna: this hashtag refers to "Hanna" from a rather condescending video published by the German ministry for education and research back in 2018. In June 2021, the video was "rediscovered" and caused a wave of activity under the #IchBinHannah hashtag on Twitter.
- #ACertainDegreeOfFlexibility: Hashtag that ocurred shortly before the #IchBinHanna wave and was overtaken by it.
- #IchBinJelena
- #IchBinMelek
- IchBinNichtHanna (and a few smaller data sets)
- In addition, the data set
video_urlincludes all Tweets that directly contain the link https://www.bmbf.de/de/media-video-16944.html that points to the video from the ministry.
All data sets were downloaded using twarc, using the script code/get_data.ipynb (see section Getting data from Twitter). The respecitve queries for each data set are stored in the folder code/queries.
In this repository we store only the Tweet IDs and Conversation IDs of the Tweets and conversations that were included in the data analysis. We do not store full tweets, due to restrictions in the Twitter terms of use. Using the Tweet IDs stored in data/tweet-IDs, you can "rehydrate" the corresponding tweets, using for example twarc by typing
twarc2 hydrate tweet_ids.txt > tweets_hydrated.jsonl
in your command line. Similarly, by using the twarc conversations utility, you can retrieve all Tweets belonging to a converation ID
twarc2 conversations conversation_ids.txt conversations.jsonl
Data from Twitter can be scraped via the Twitter v2 API. To get access to full archival search (i.e. be able to search for Tweets that were tweeted longer than one week ago), you will need "academic access" to the twitter API. Once you have access, scraping tweets is fairly easy, using for example the command line tool twarc. We provide scripts that scrape the data for our hashtag(s) of interest in the folder code(see basic-twarc-code.txt and get_data.ipynb).
To analyse the data, we recommend converting the json line files into .csv files. This can be done using twarc-csv, an extension for twarc. Conversion to .csv is also included in the script code/get_data.ipynb. You will have to install the twarc-csv extension before it works, though. We used the free software Jupyter Notebooks to compile, explain, execute and export Python code. This is an easy and comfortable solution, but you can access and read the code without Jupyter. Some of the files are in subfolders, very soon we will do some housekeeping to give you a better overview.
The script analyse_data.ipynb includes some basic exploration of the number of tweets for each of the hashtags over time, and the number of unique users engaged in each hashtag "wave". Visualizations that result from the analysis are stored in the folder plots.
We shared some of the data with the community (on tweets per day, tweets per hour and user per hashtag). We used Python's matplotlib to generate most of our insights and plots. However, to generate an interactive graph of tweets per hour we used plotly and uploaded the result to a dummy repo. You can access the result and share it for free, you may also include it as an iframe in your website. You can also cite the version that covers the entire June:
Example:
<iframe src="https://lasersteff.github.io/Hanna_time/" style="border:0px #ffffff none;" name="myiFrame" scrolling="no" frameborder="1" marginheight="0px" marginwidth="0px" height="400px" width="650px" allowfullscreen></iframe>
language_frequencies.py + piechart.py and wordcloud.ipynb are simple scripts to create illustrations of the language distribution (piechart) and most frequenct words (wordcloud) of #IchbinHanna tweets or other related corpora. Check plots for the results. The image shown above (names in Hanna) represents a playful way of representing the diverse subjects interacting with the hashtag. What you can see there are first names of posts that started with "Ich bin...". Bar charts and scripts for comparing the distribution of tweets, retweets, quotes, and replies can be found in the tweet_types_compared folder in codes and plots.
To facilitate the qualitative analysis process, a searchable and filterable table can be created (see screenshot below). The code for this can be found under Rstats/SearchableTable.Rdm and the underlying data is stored in Rdata/tweets_unique_keyinfo.rds.

To get a sense of the Twitter interaction and its devisions, tools of network visualization can be used. Drawing on the open graph programm "Gephi", the file Hanna.csv was imported and correlations drawn between user and in_reply_to_user.username. The Force Atlas2 algorithm with basic options (no overlap and a few colours) was used. In plots, two examples show the center of the network (a first zoom) and one seperate instance of interactions (a second zoom). This is experimental, yet we identify broad and extensive networks of interactions, with a few islands.
This work is licensed under a Creative Commons Attribution 4.0 International License.
