| title | layout | filename |
|---|---|---|
Summer 2023 Offensive |
template |
summer_2023_offensive.md |
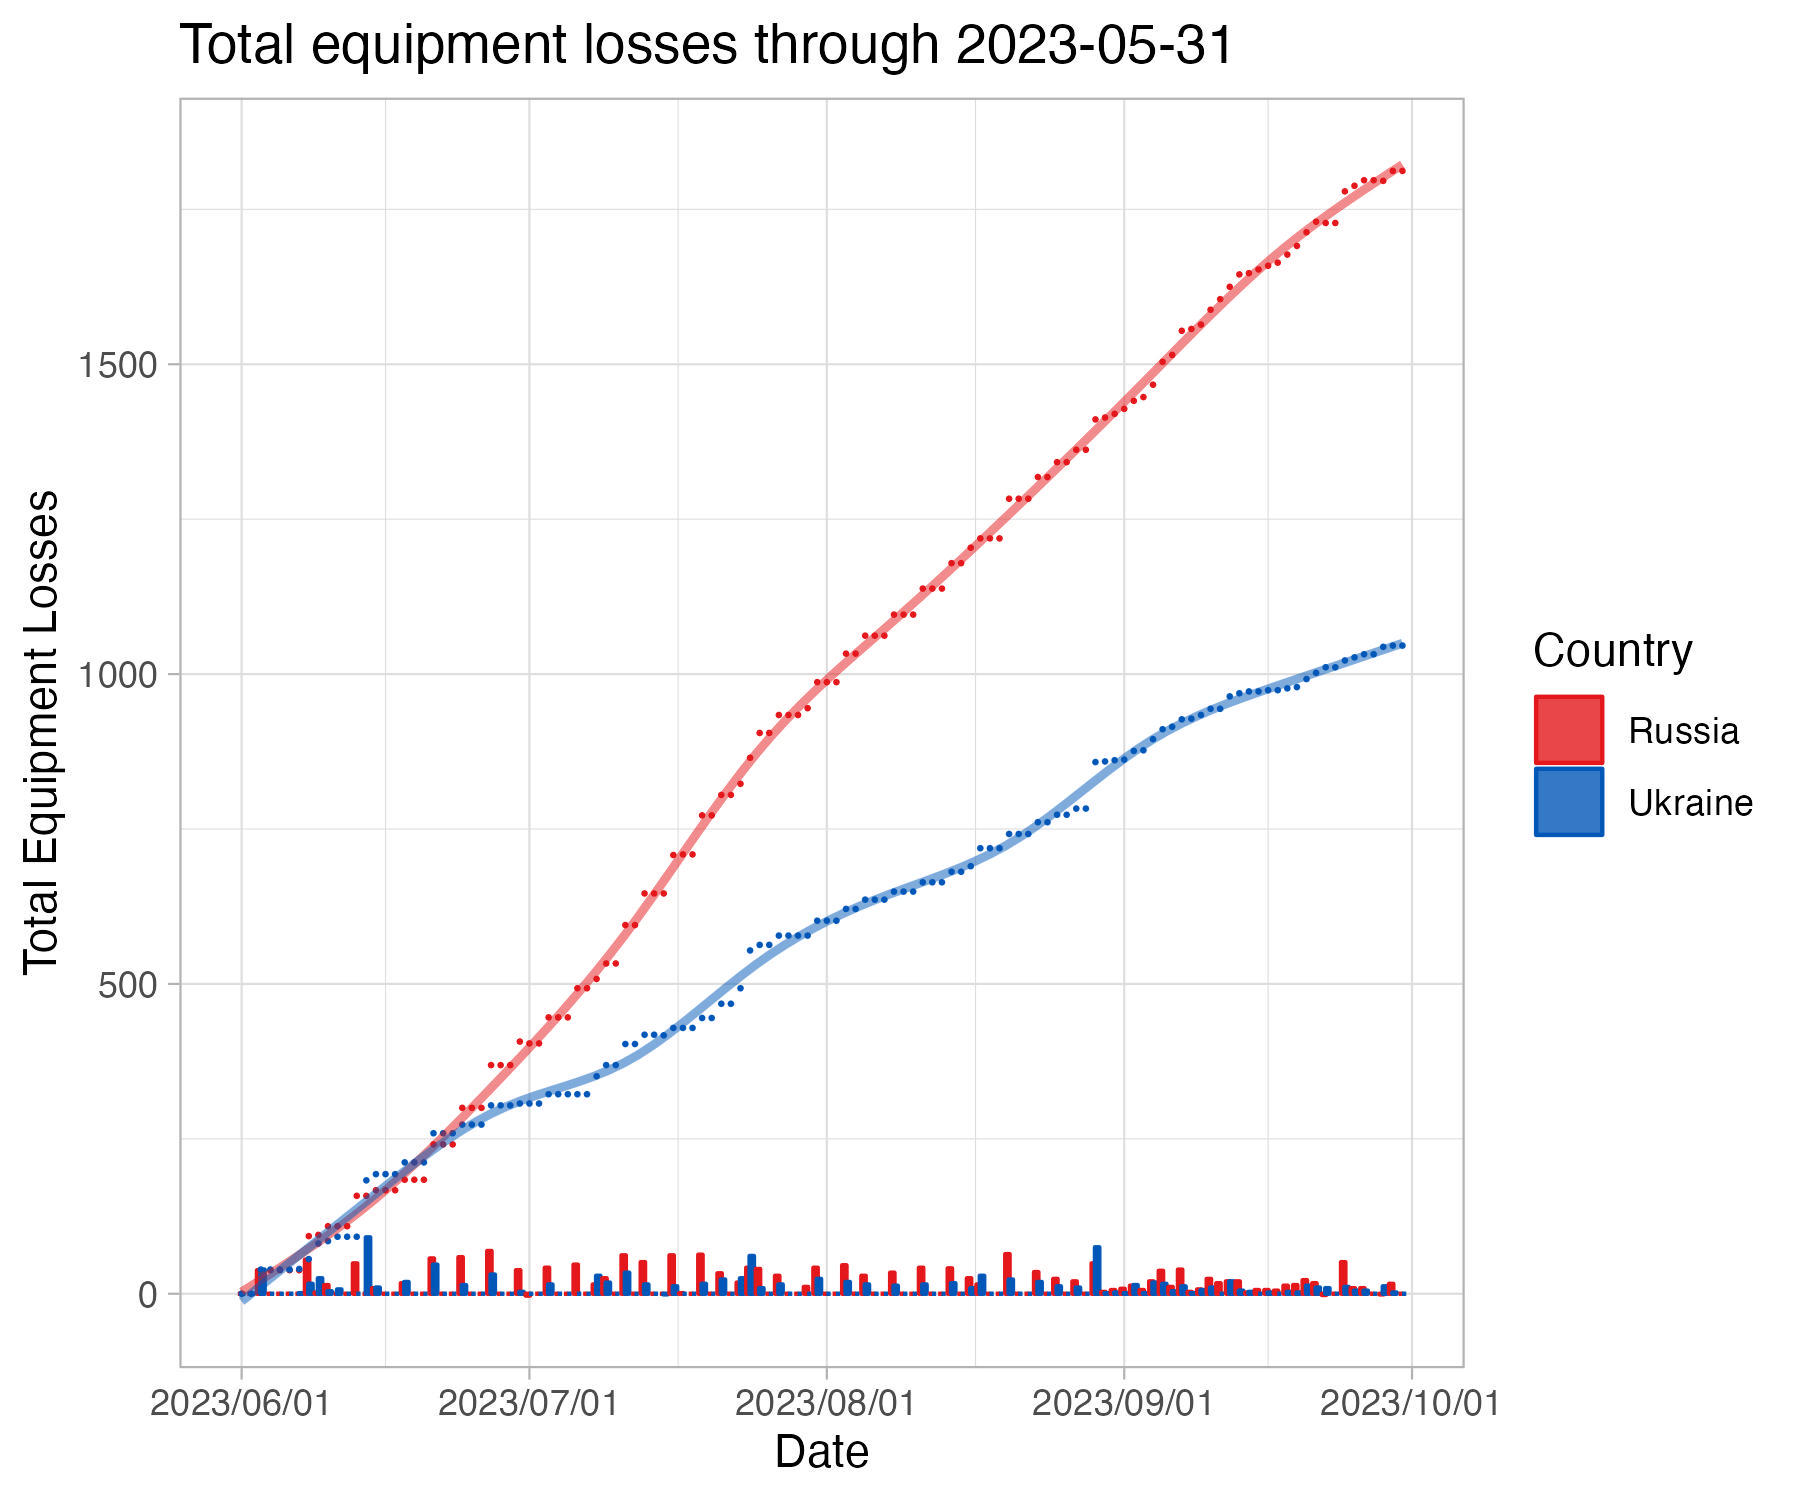
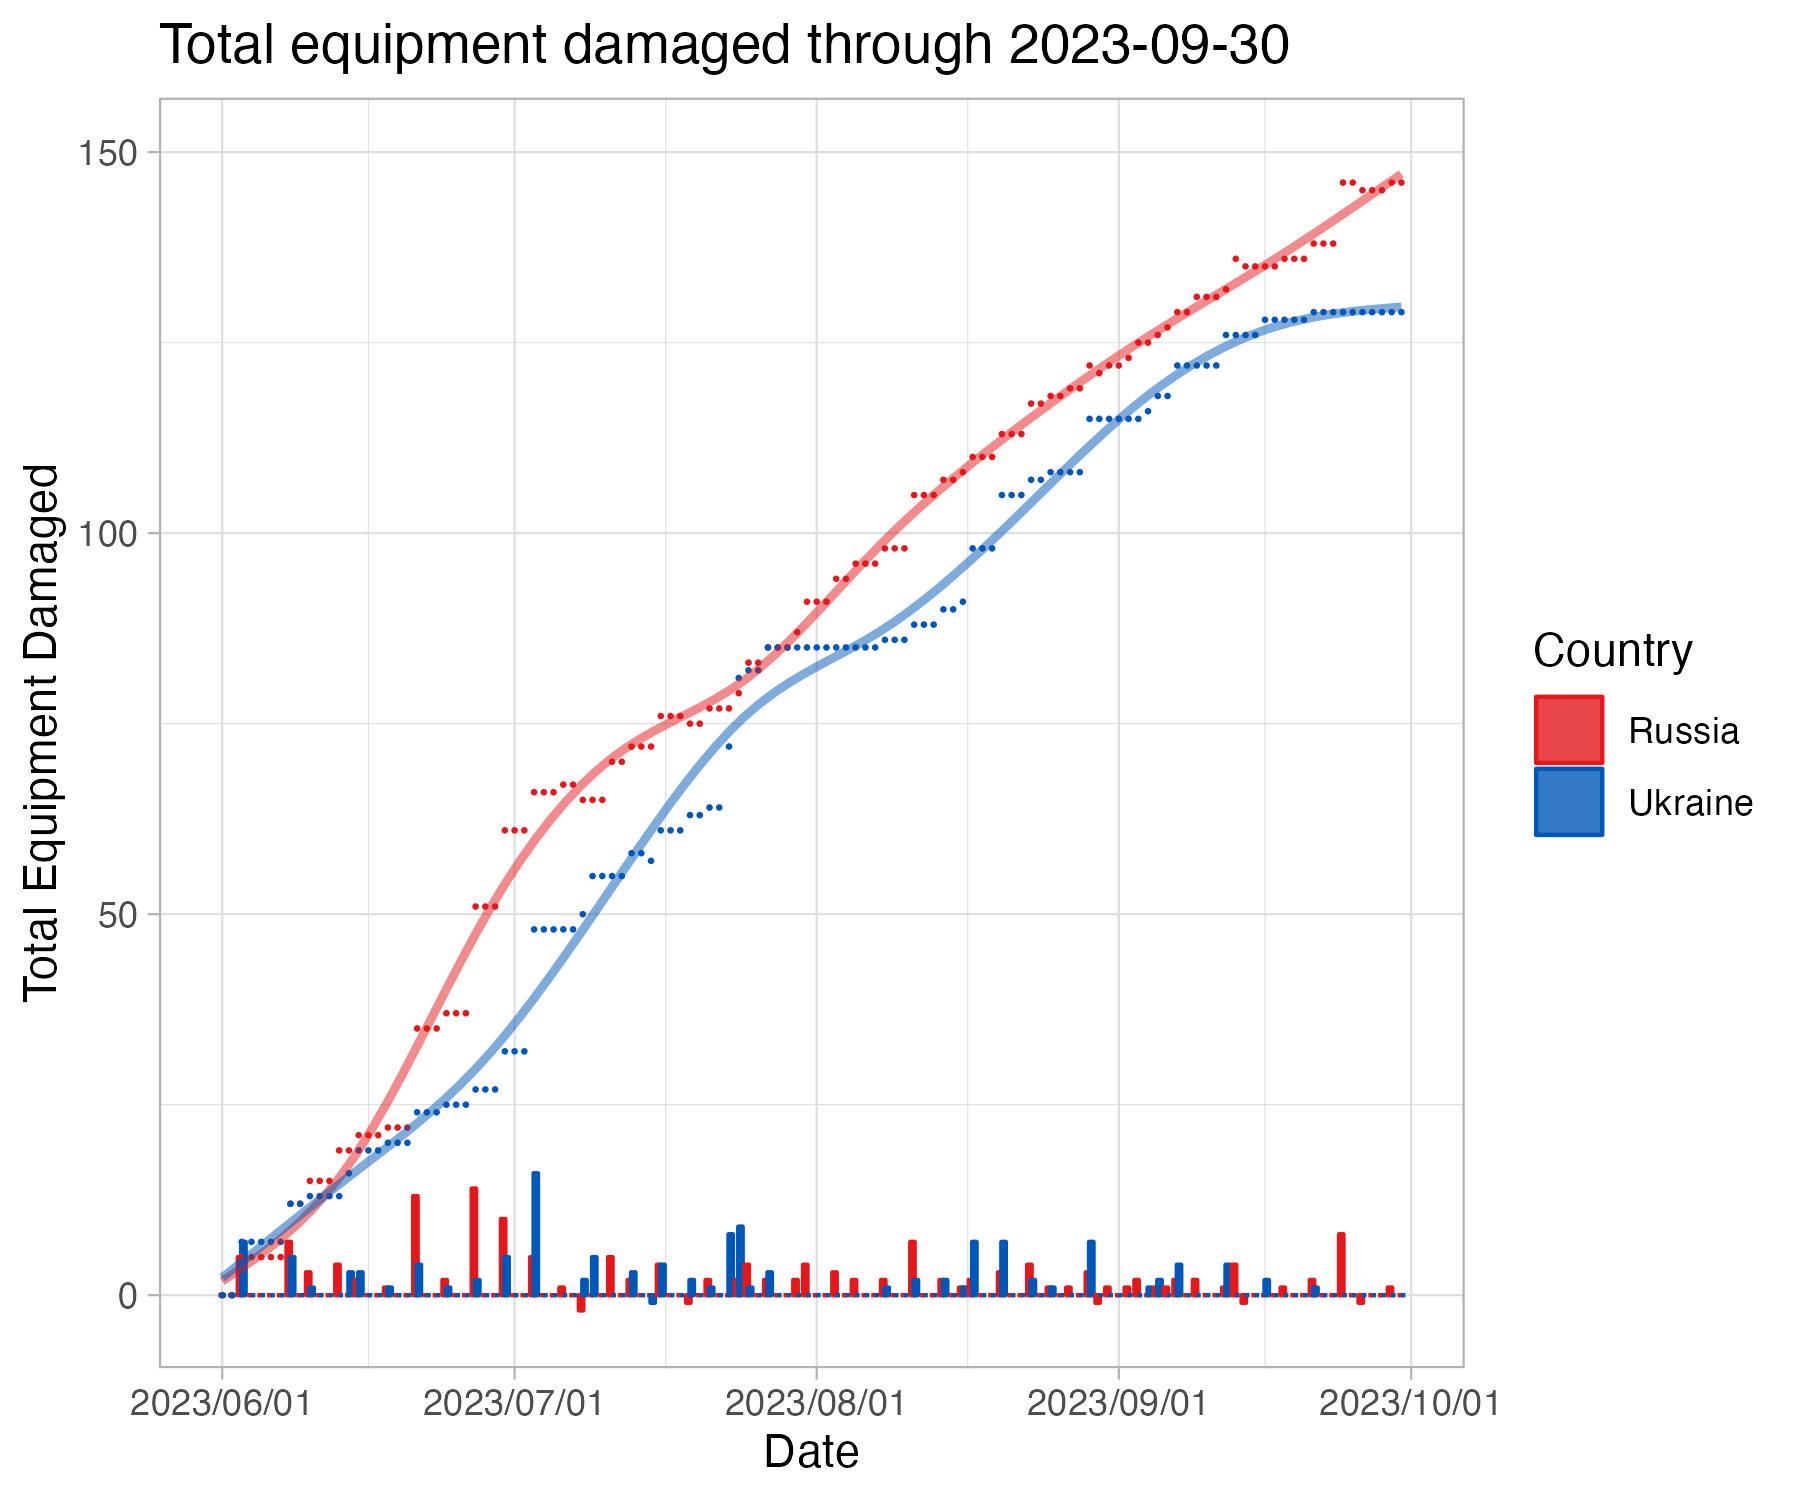
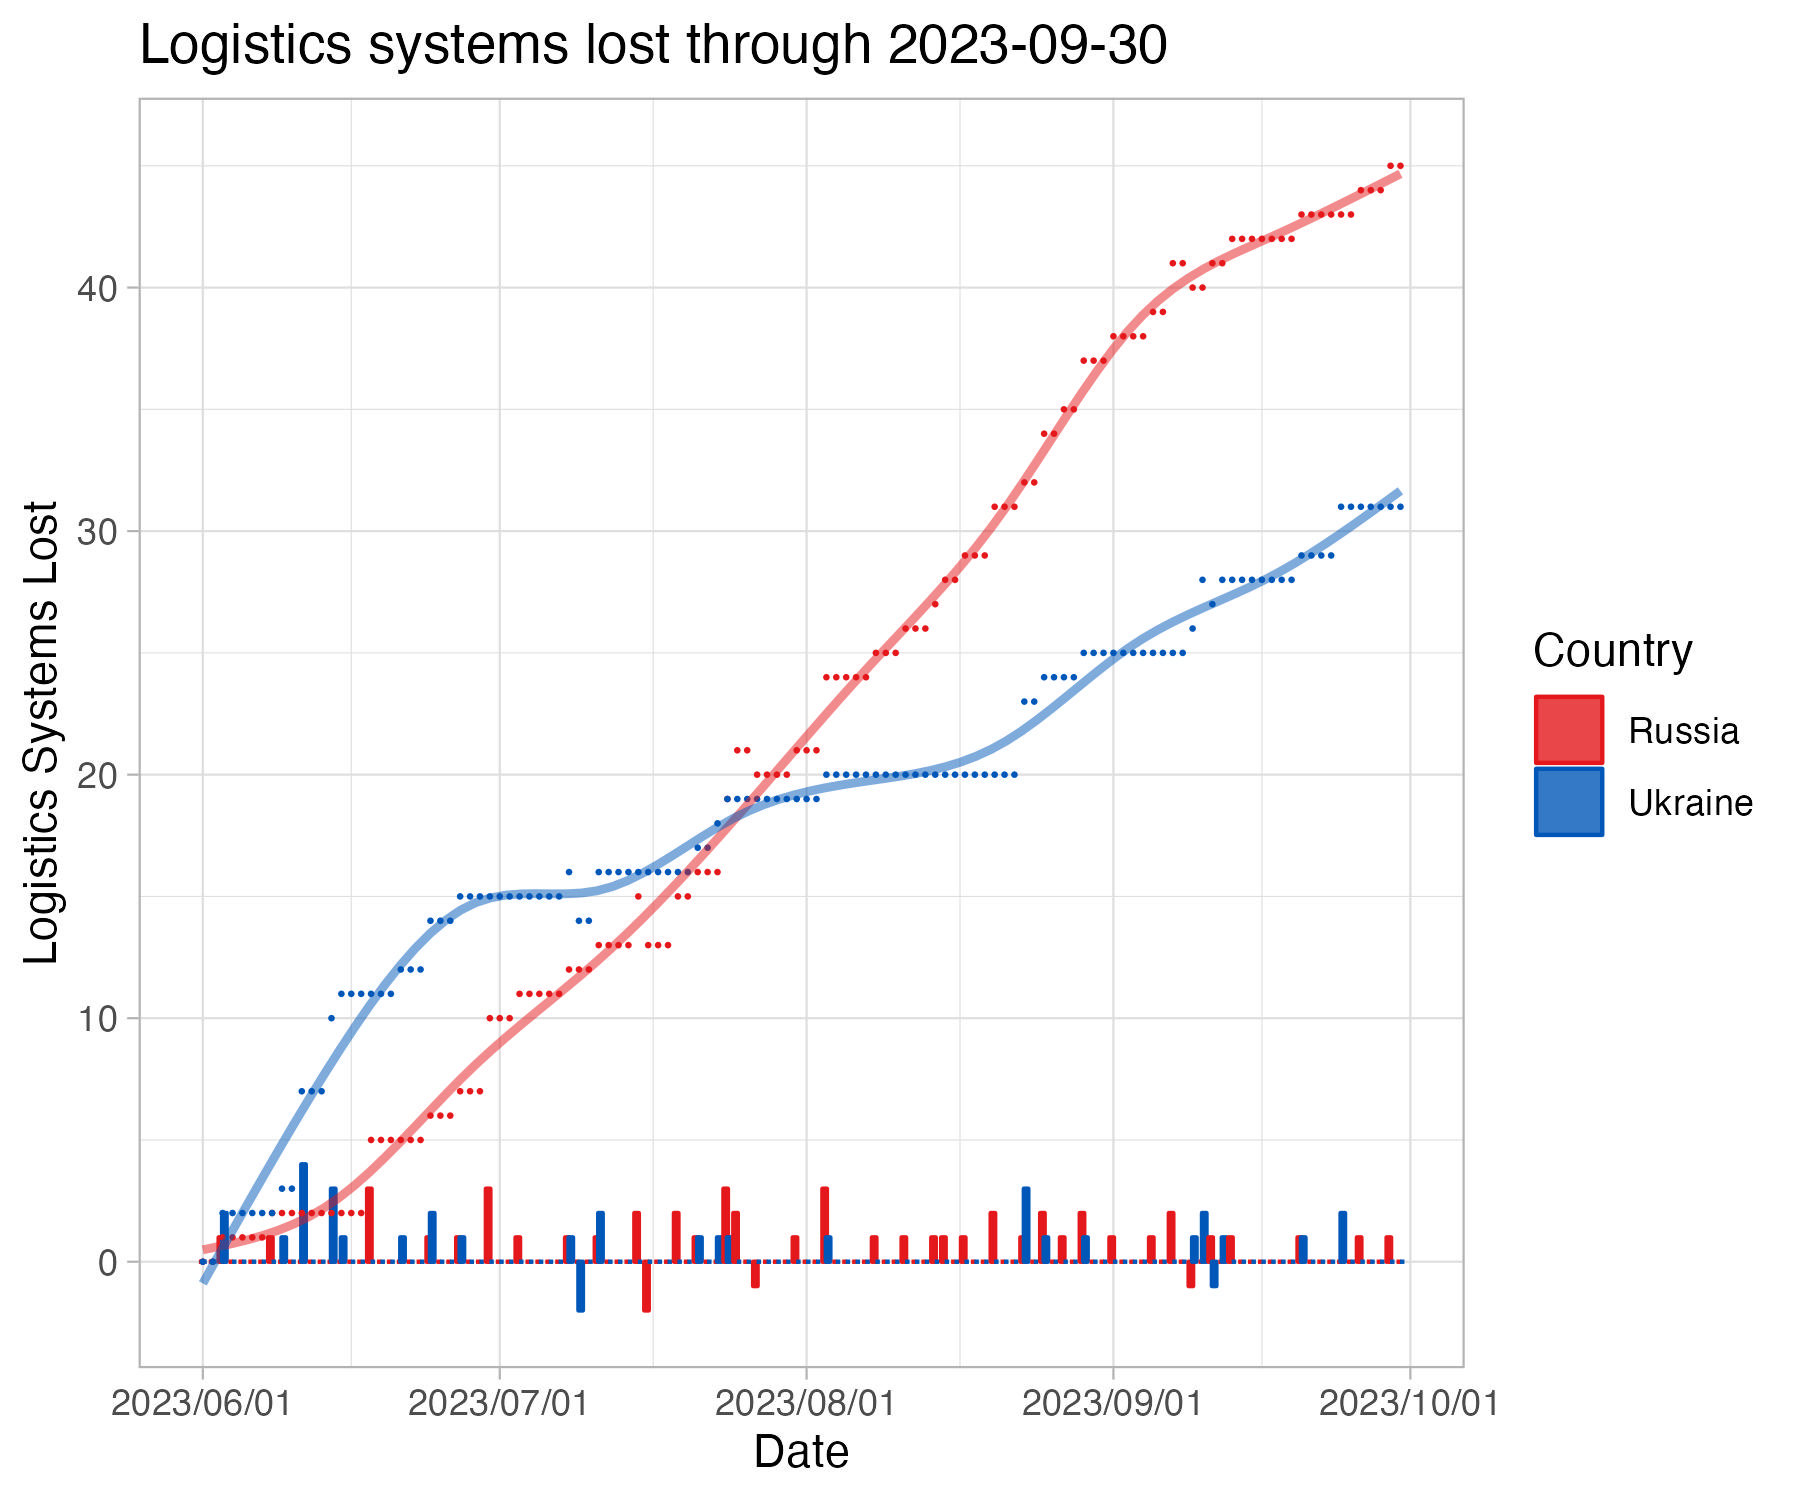
The following plots are based on the main project file, though they start their indexing at June 1st to match the current offensive.
Strategic Objective: Eliminate or make unfeasible Russia's land bridge to Crimea Result: Ongoing, but full success unlikely
Using data from Oryx's site, I've put together a quick tracker to visualize equipment losses since Russia's February 24th invasion of Ukraine. This is only equipment that is independently verified, as noted by Oryx:
This list only includes destroyed vehicles and equipment of which photo or videographic evidence is available. Therefore, the amount of equipment destroyed is significantly higher than recorded here. Small arms, munitions, civilian vehicles, trailers and derelict equipment (including aircraft) are not included in this list. All possible effort has gone into discerning the status of equipment between captured or abandoned. Many of the entries listed as 'abandoned' will likely end up captured or destroyed. Similarly, some of the captured equipment might be destroyed if it can't be recovered. ATGMs and MANPADS are included in the list but not included in the ultimate count. The Soviet flag is used when the equipment in question was produced prior to 1991.
Data is drawn from this public google sheet which is updated based on the last update for each day. As such it is a lagging indicator, dependent not just on when equipment is lost, but when it is discovered and documented.
Data is pulled daily from Oryx's site using Daniel Scarnecchia's scraper tool, and then pushed to the public google sheet, where synthetic calculations are performed for equipment categories (to preserve transparency).
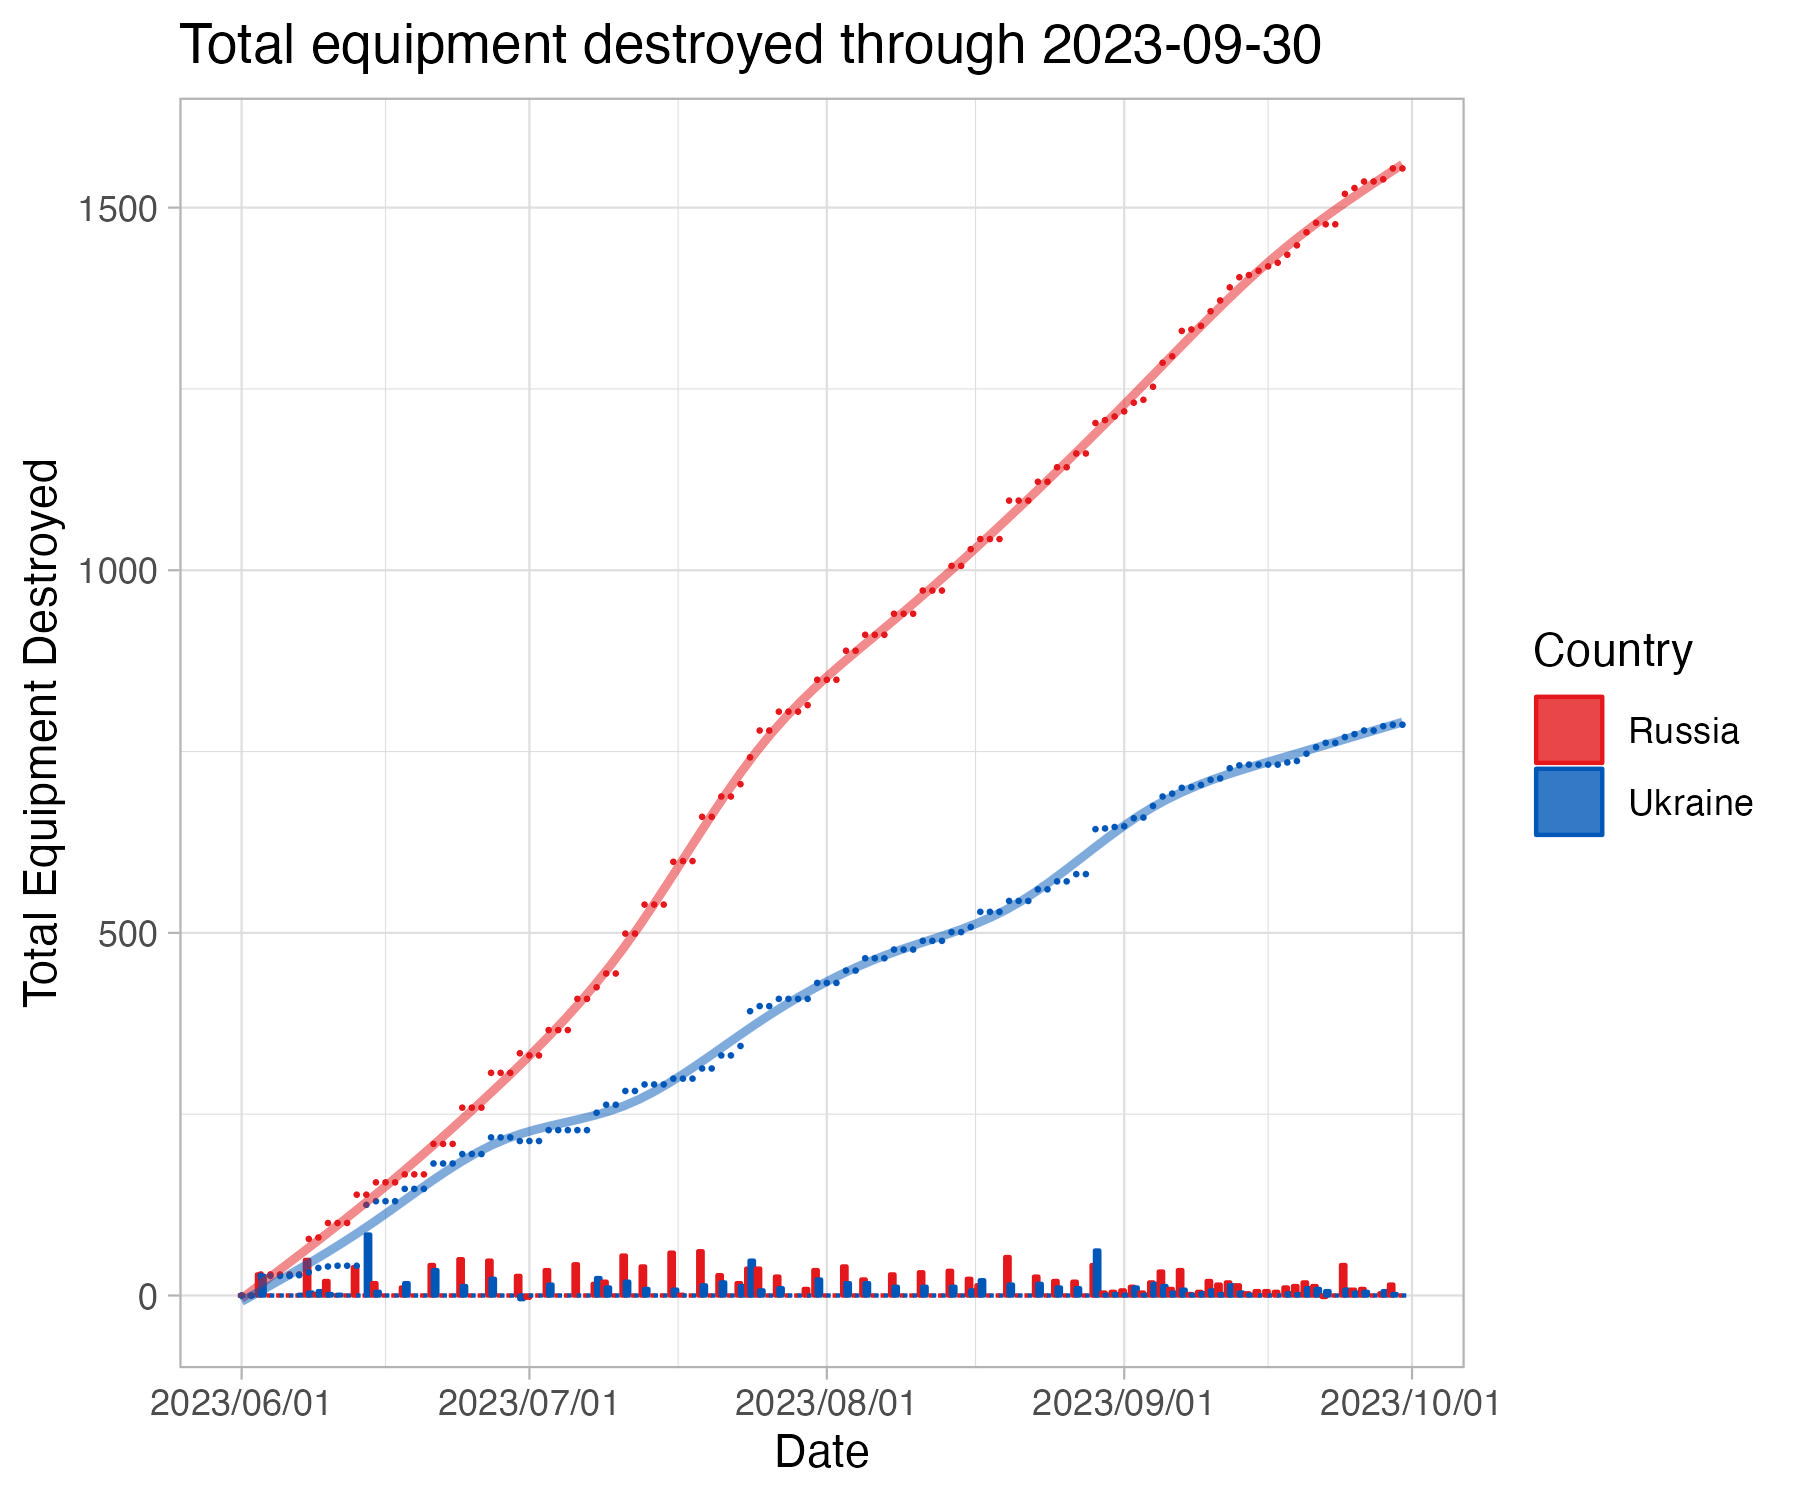
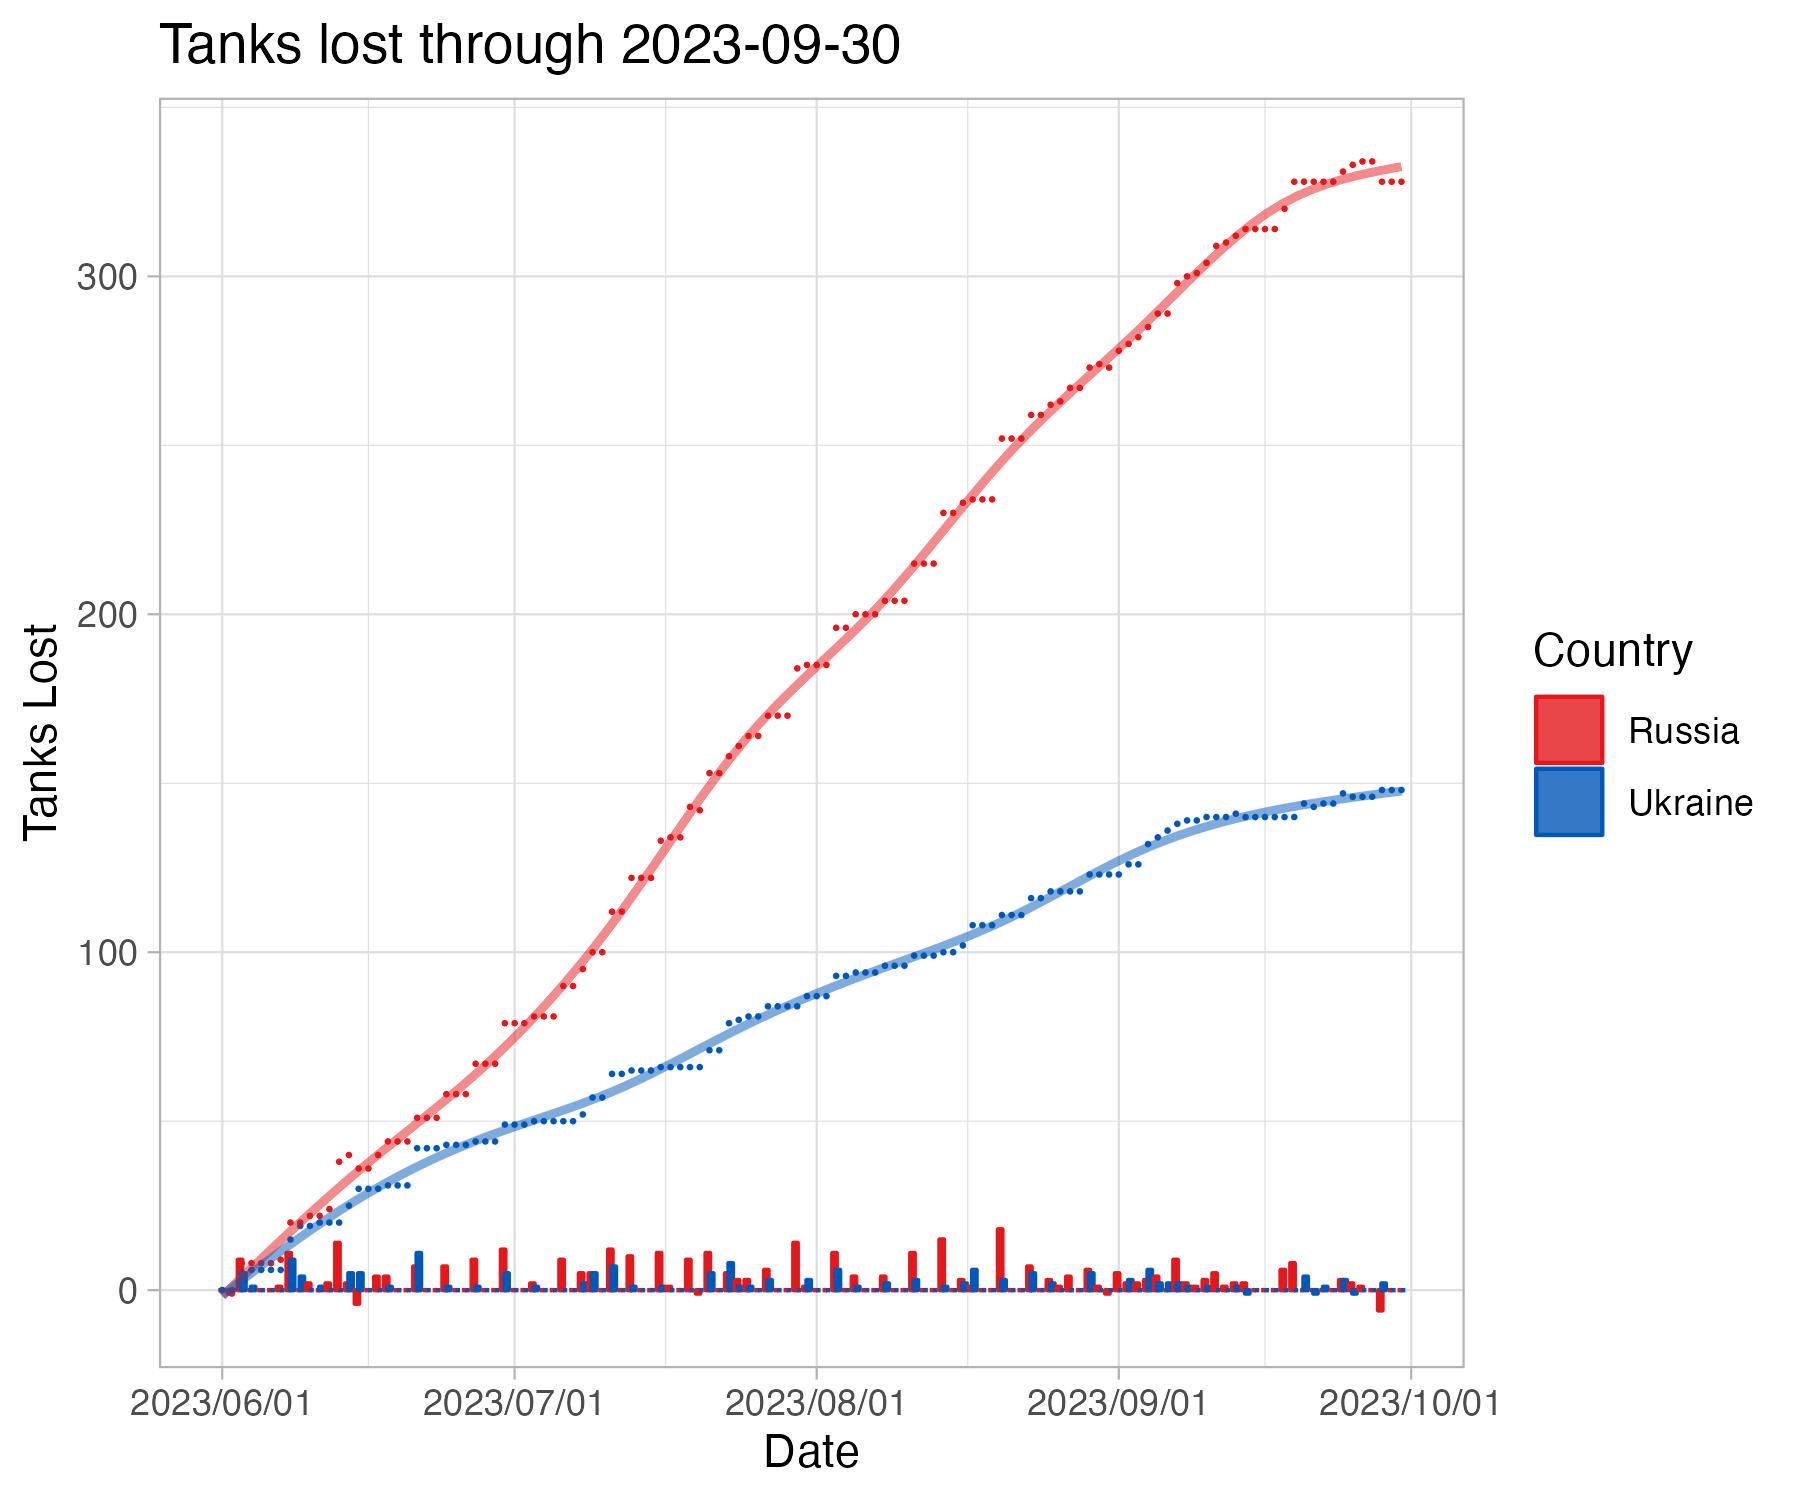
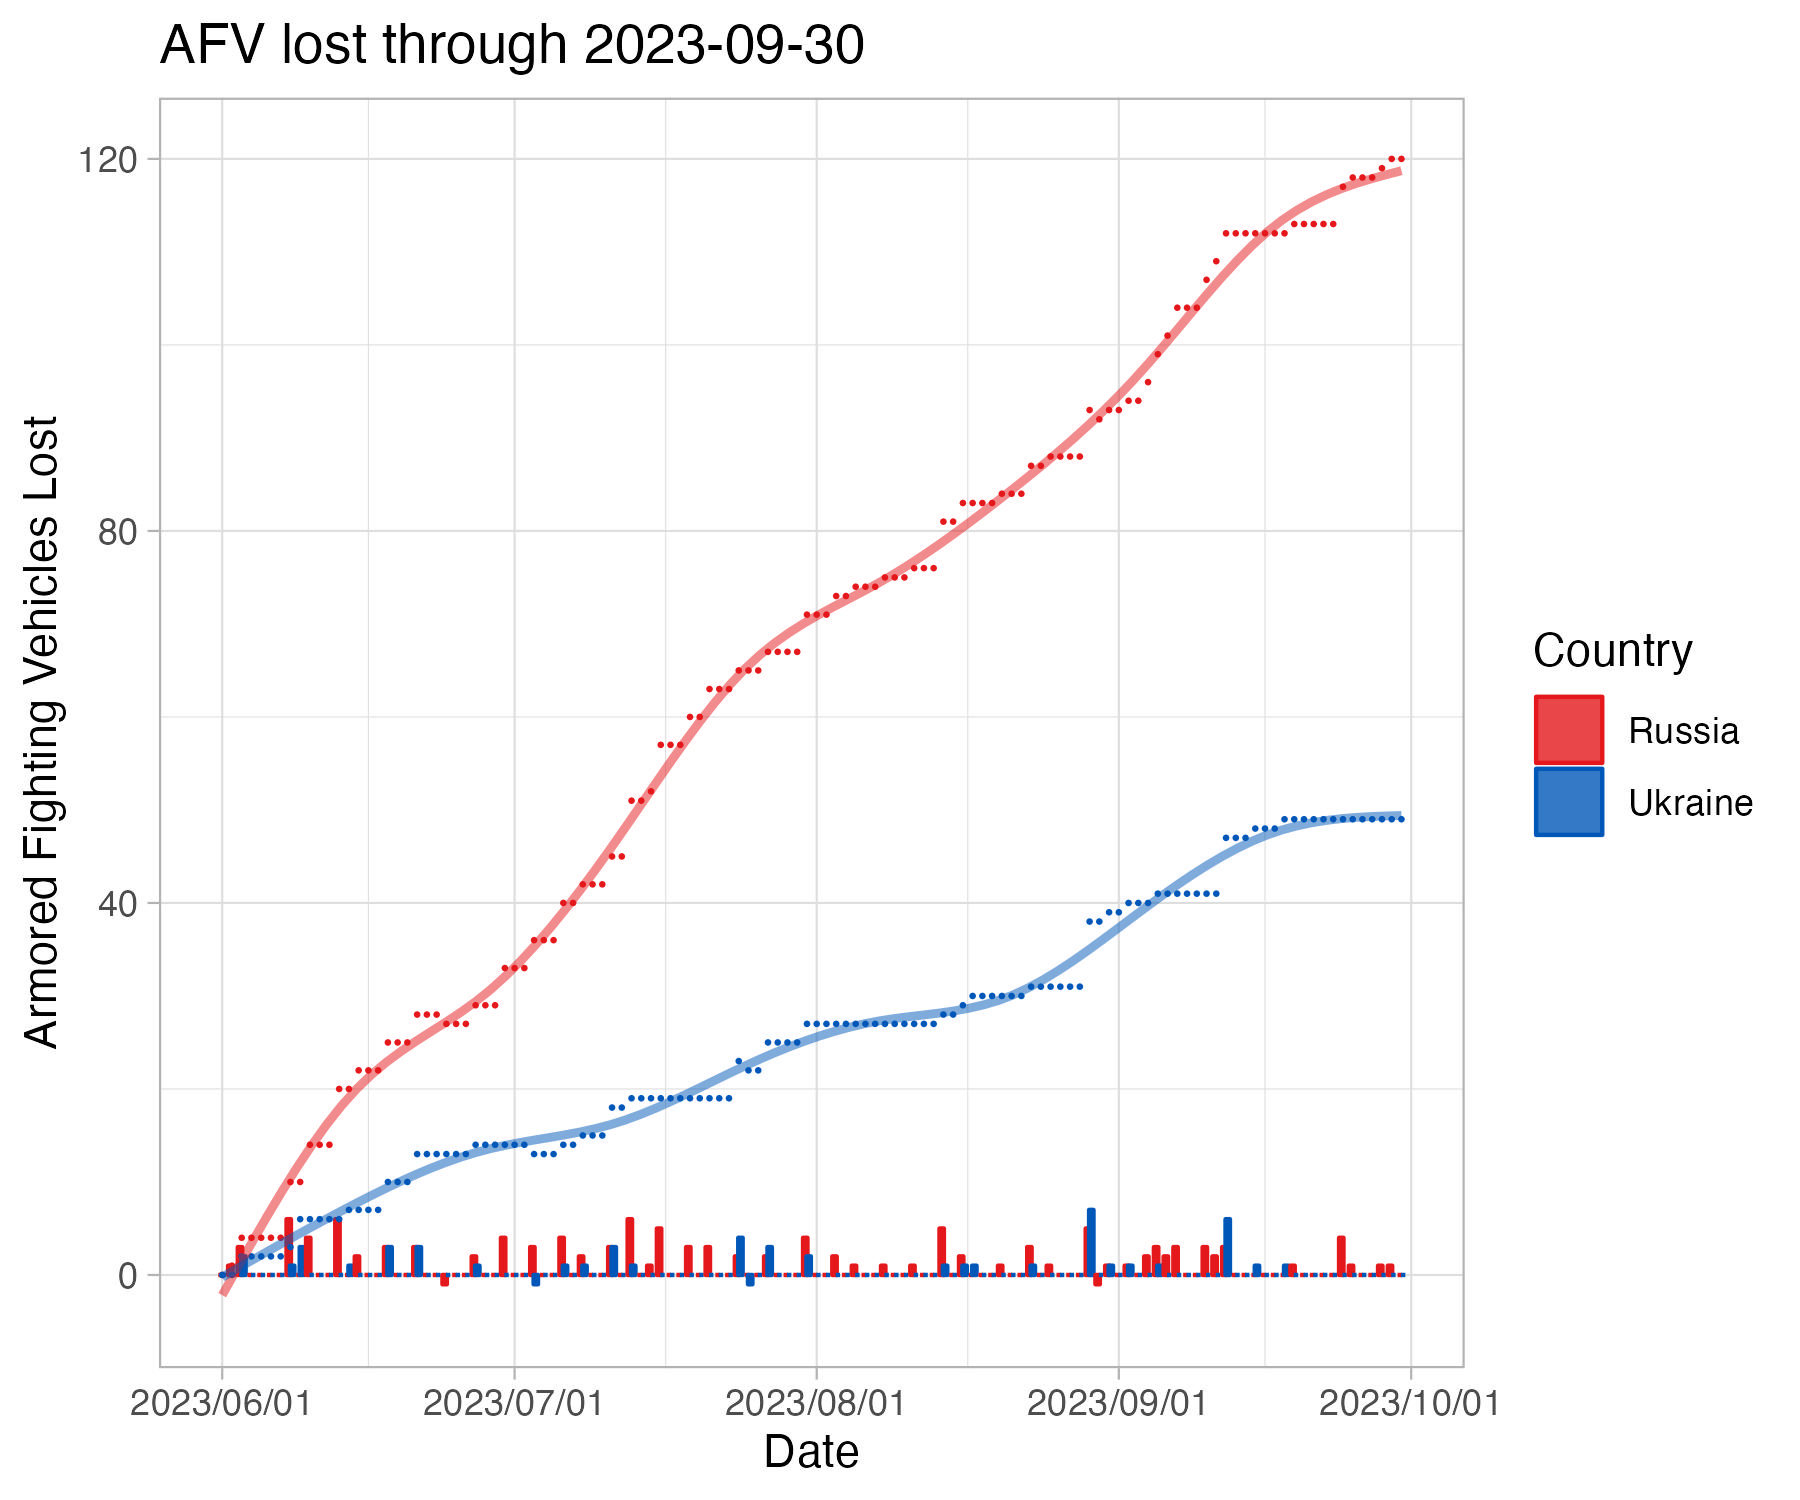
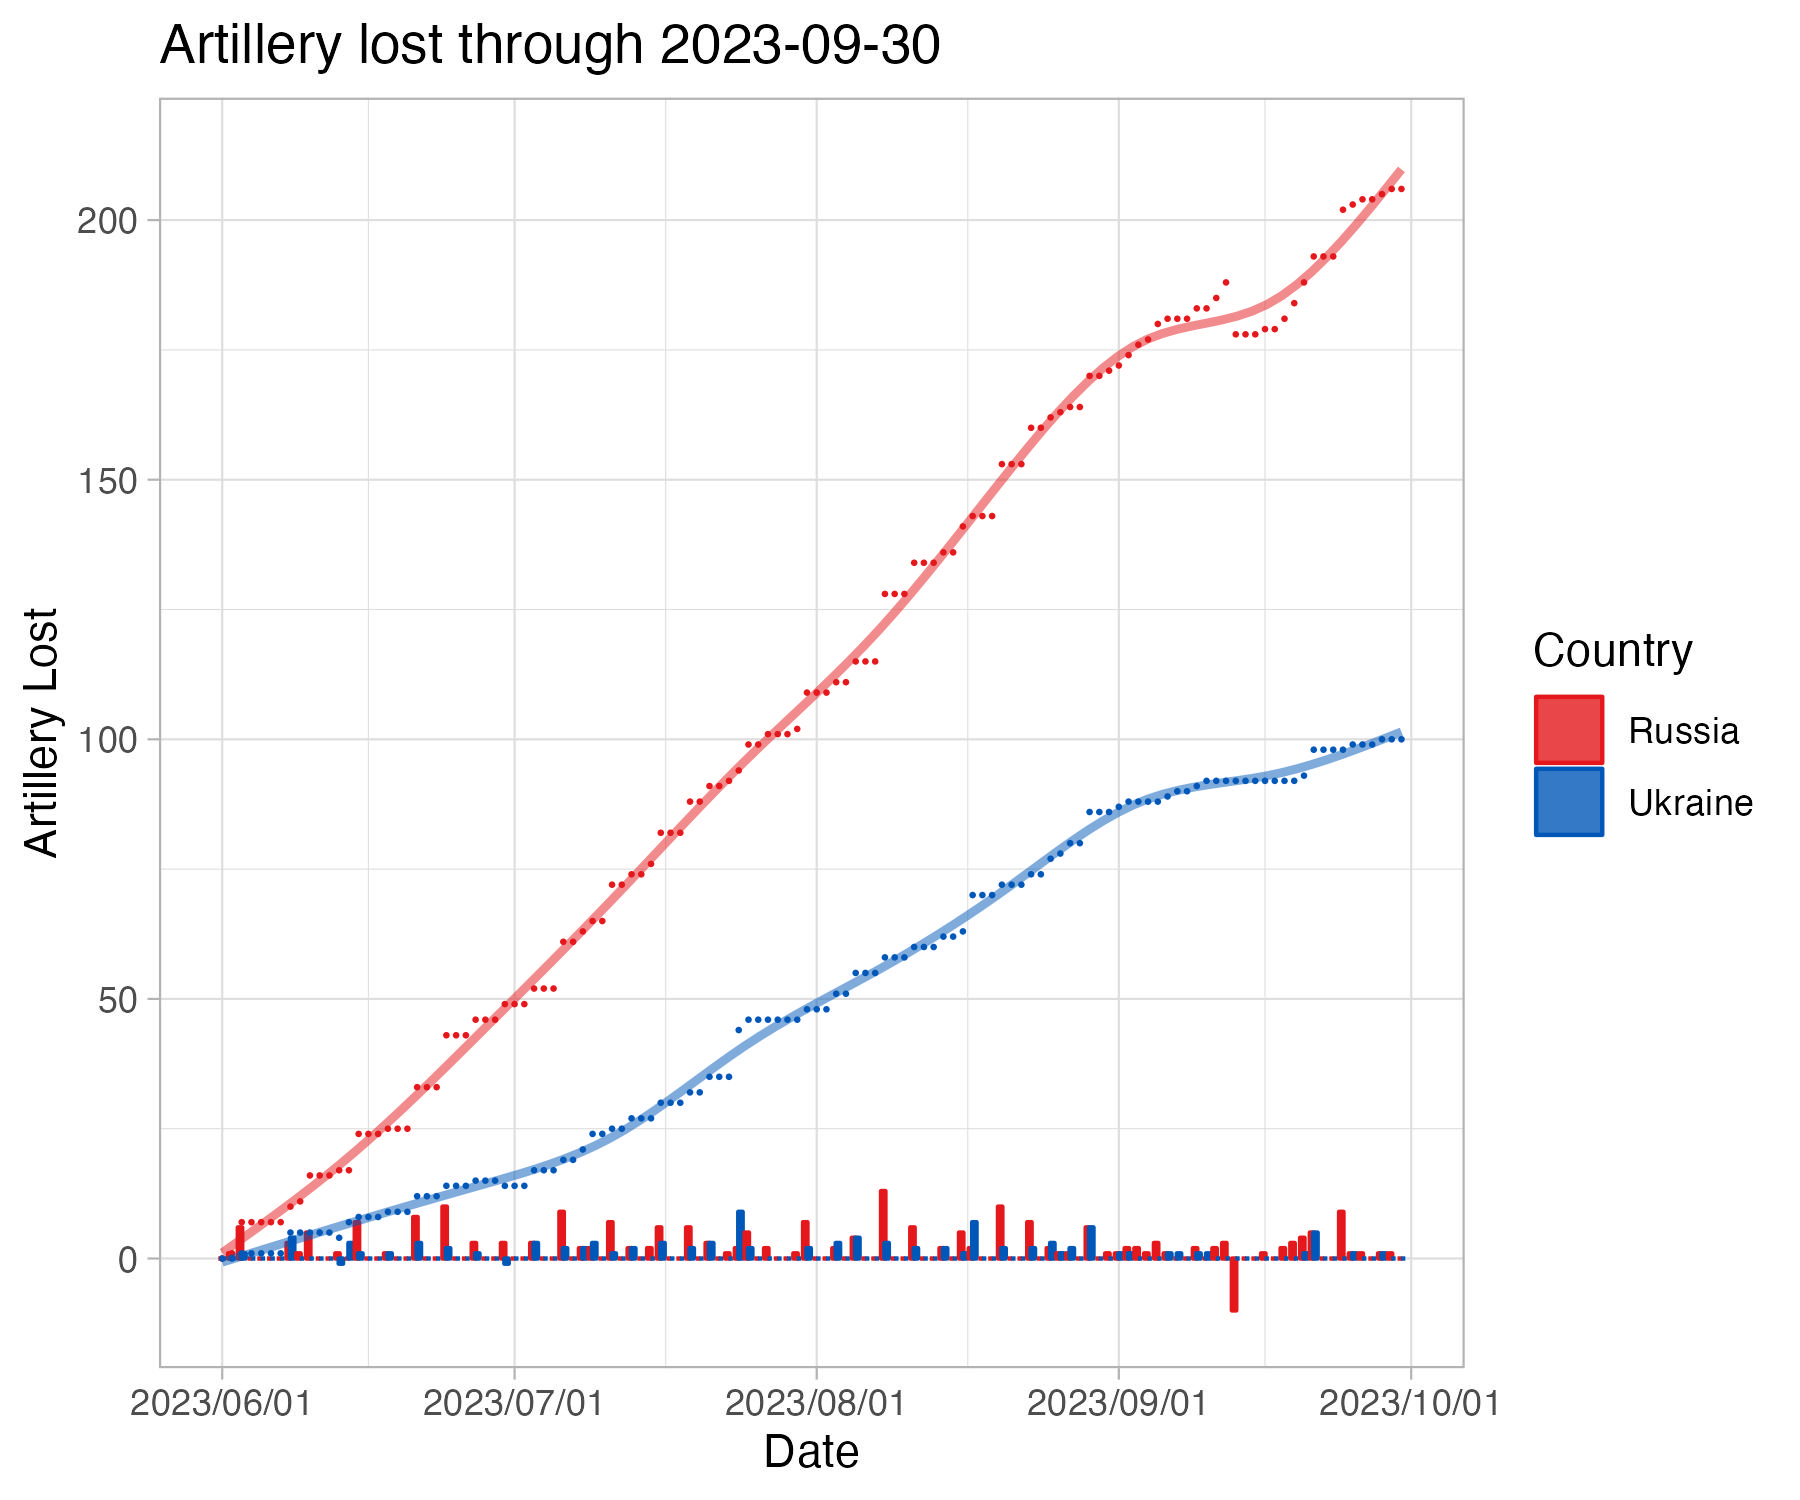
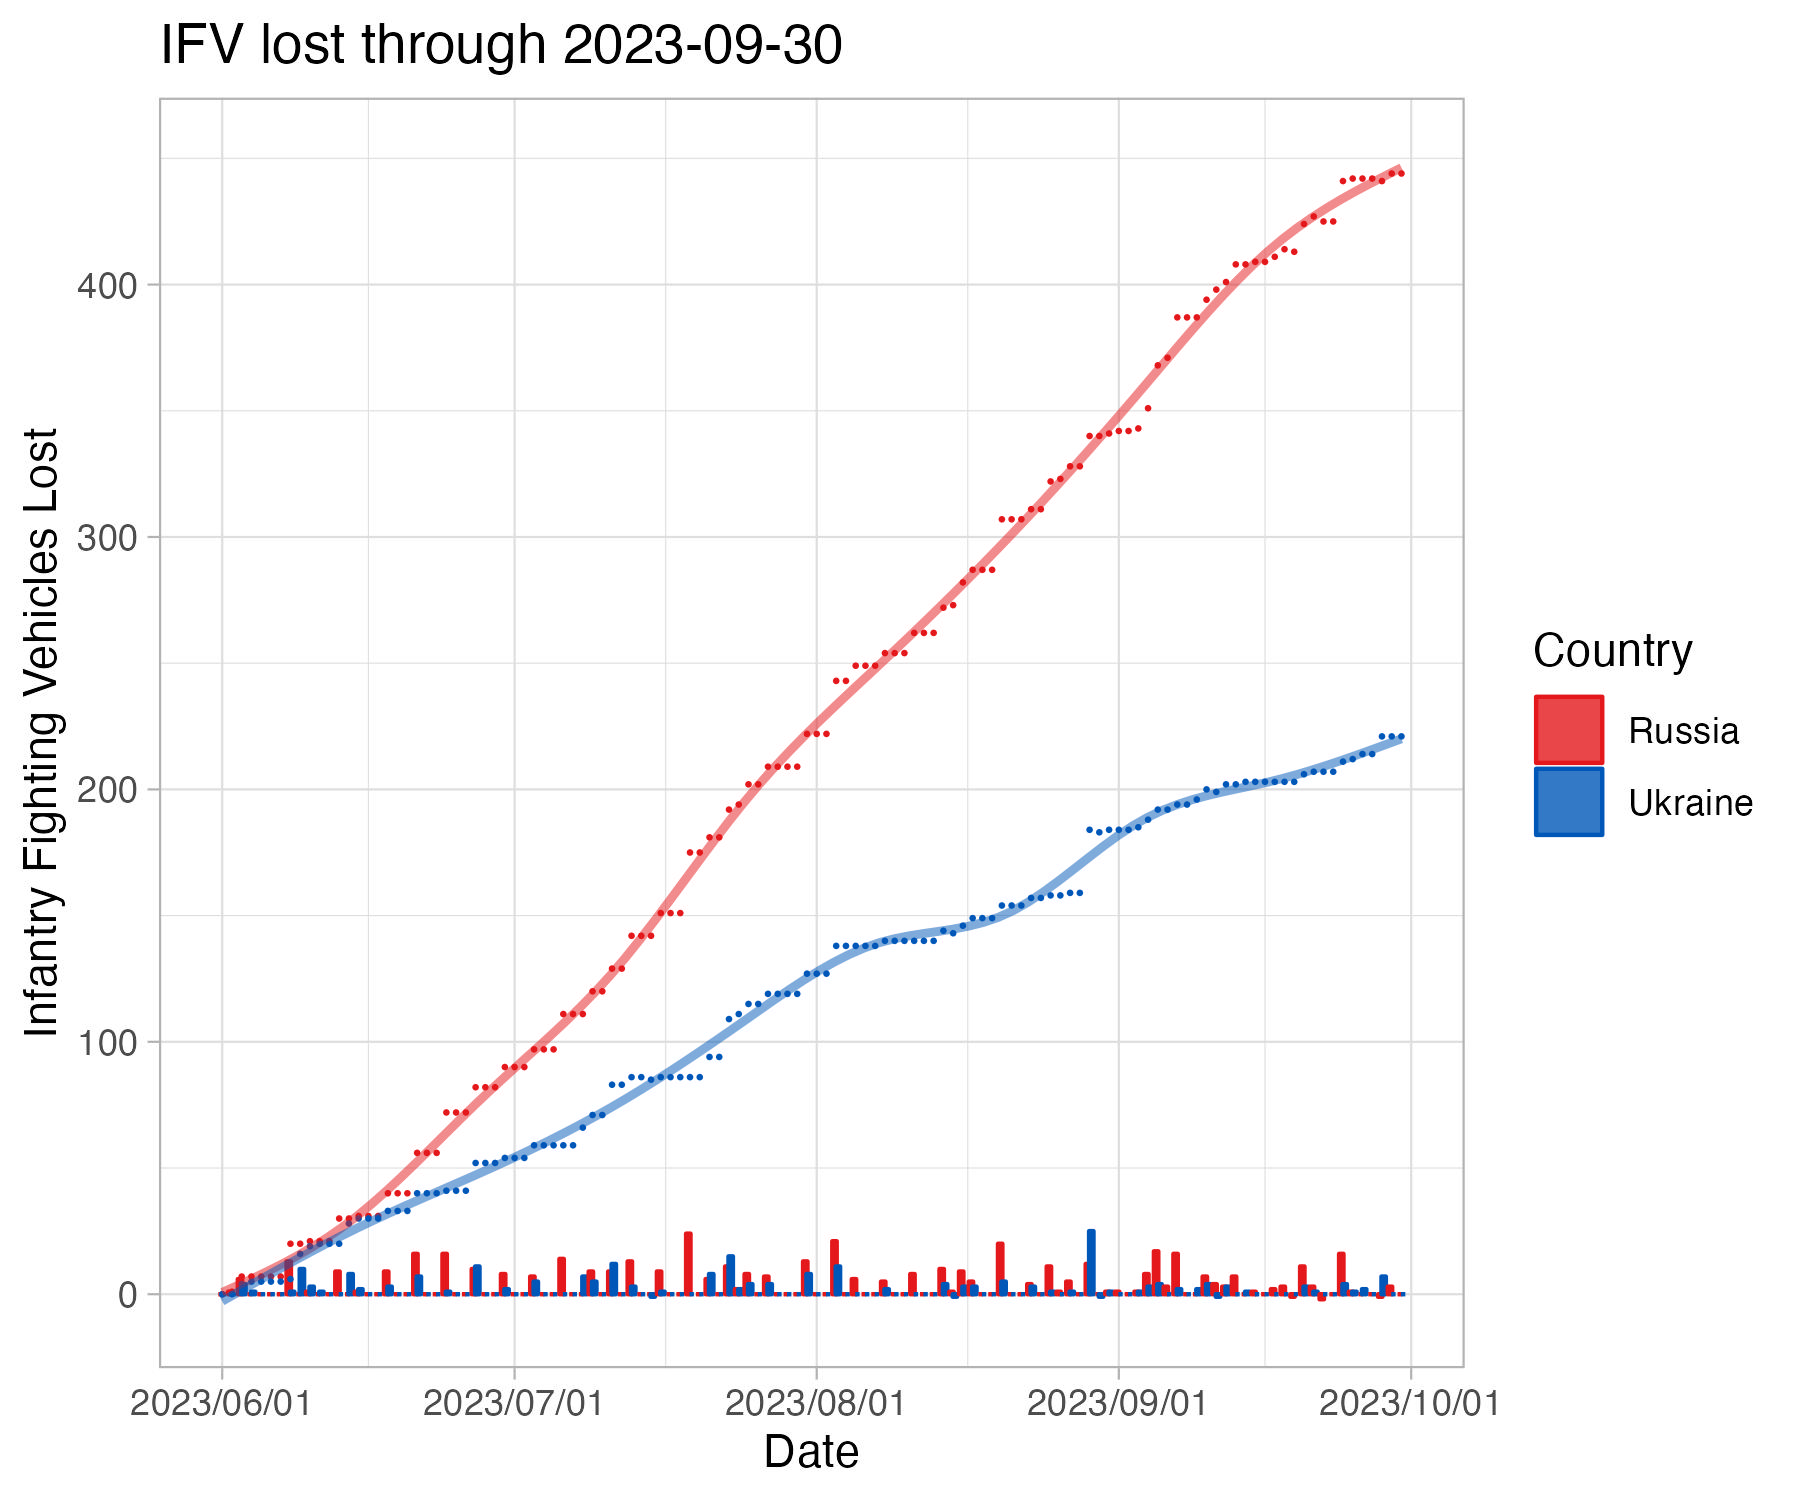
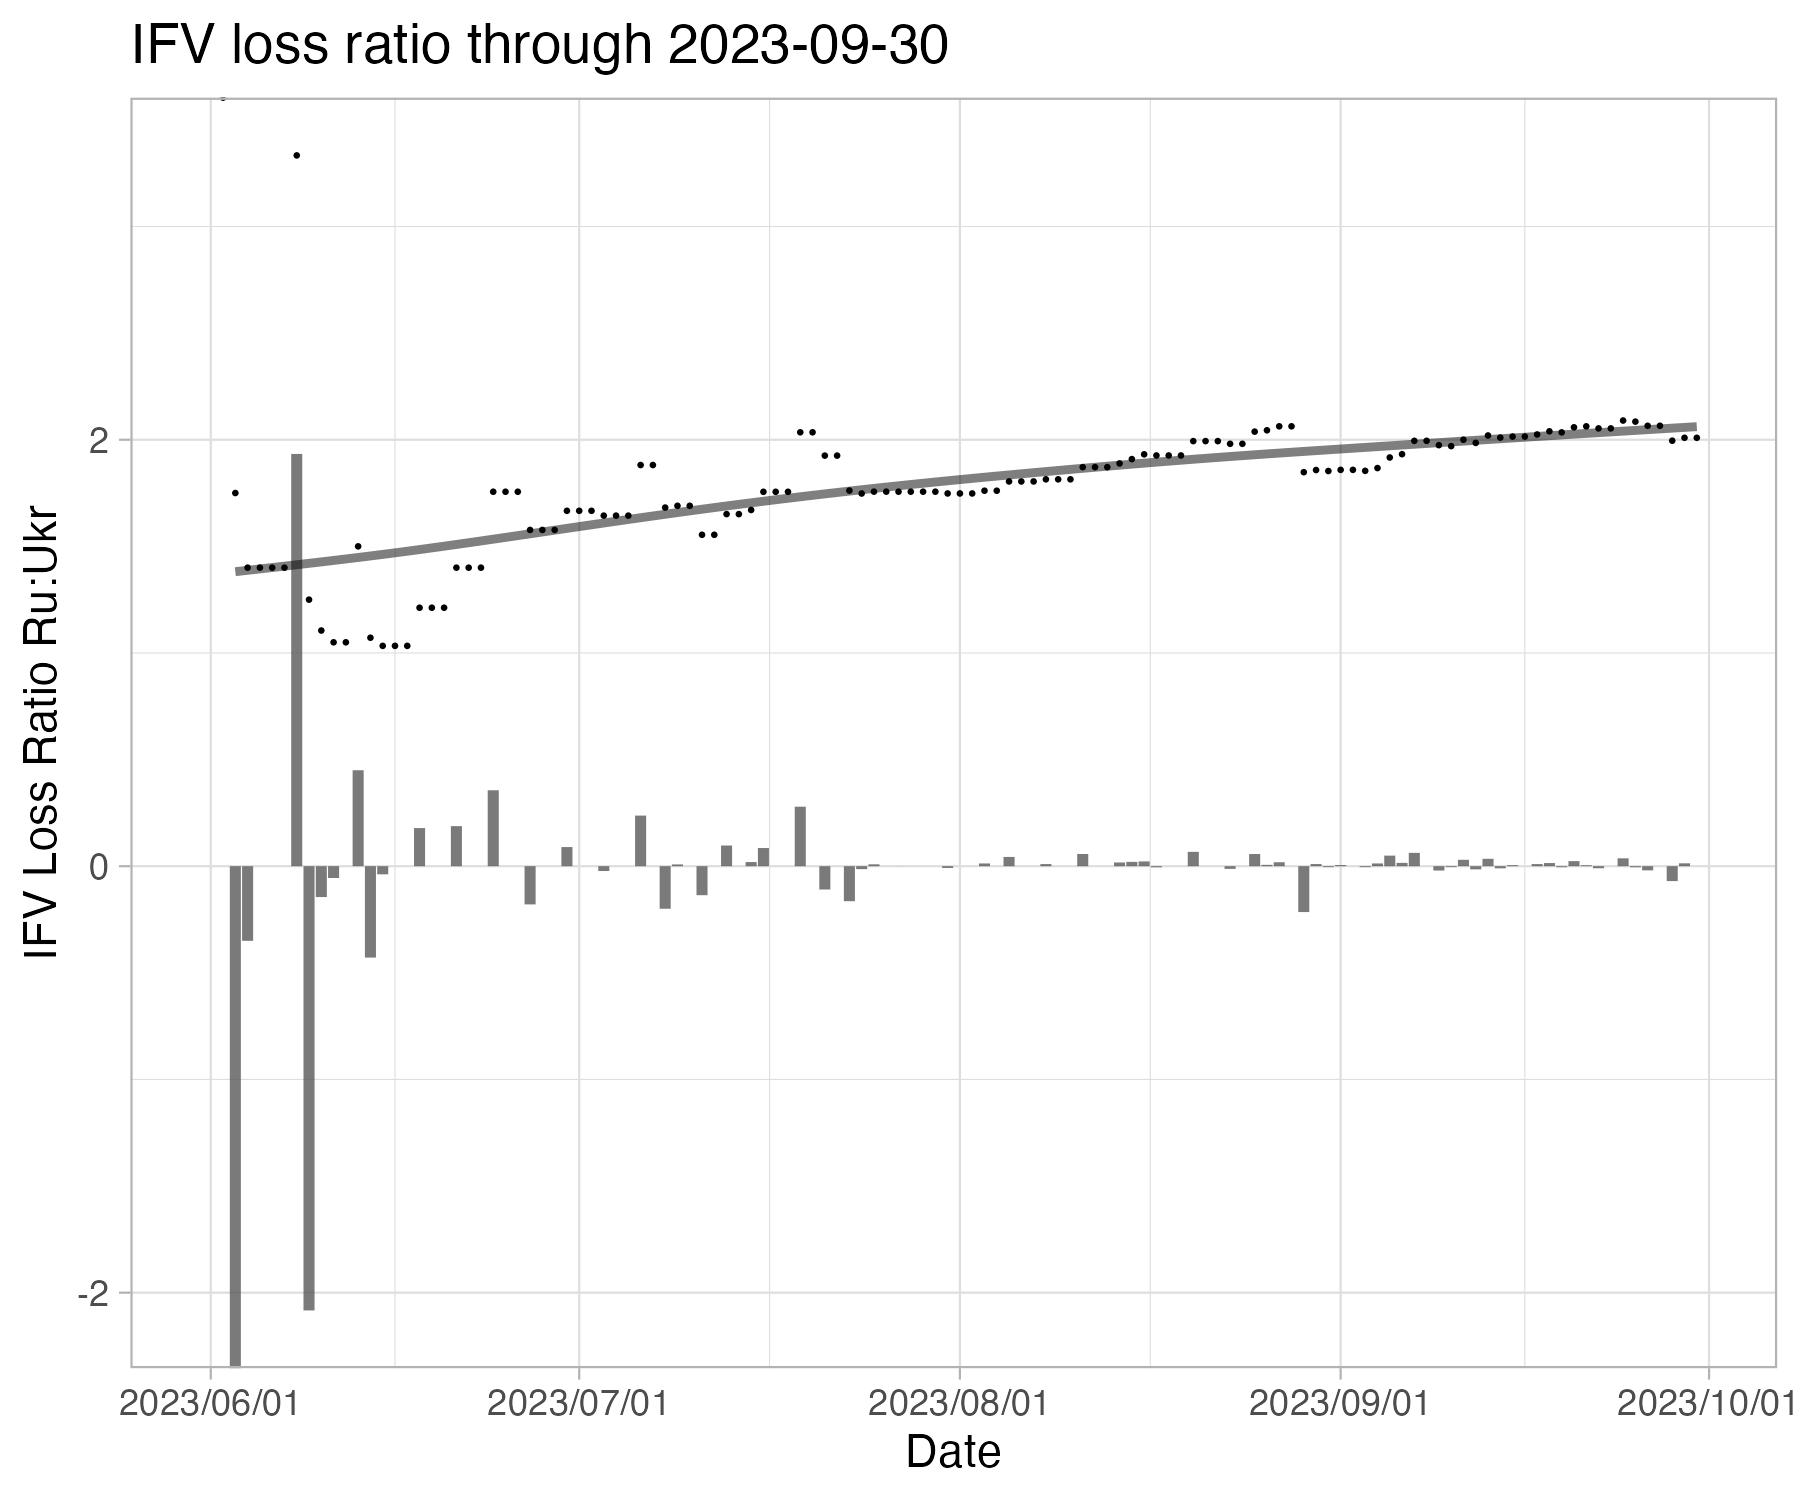
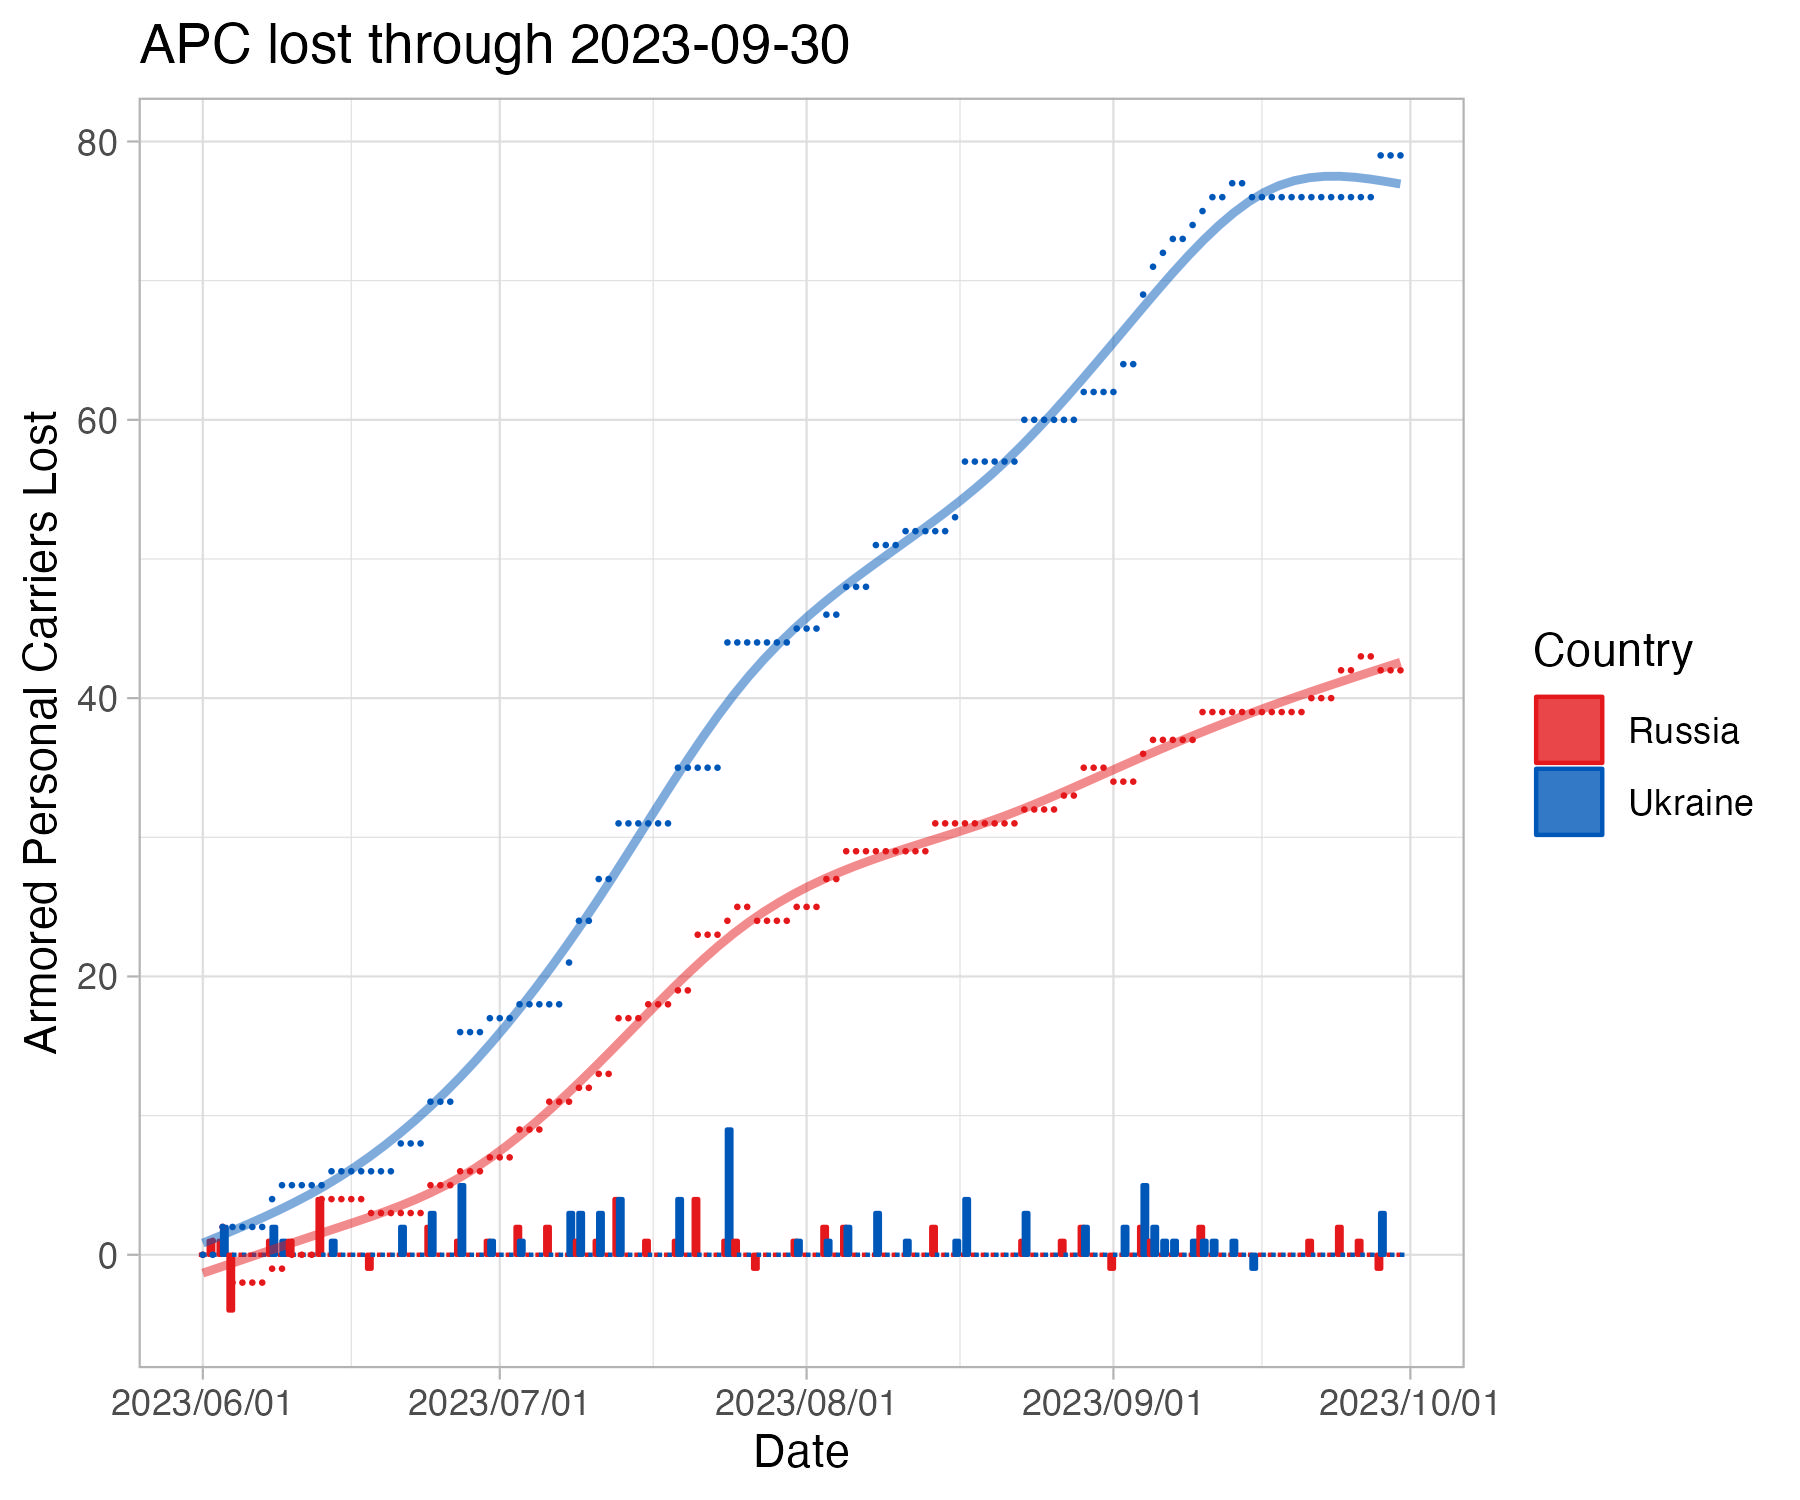
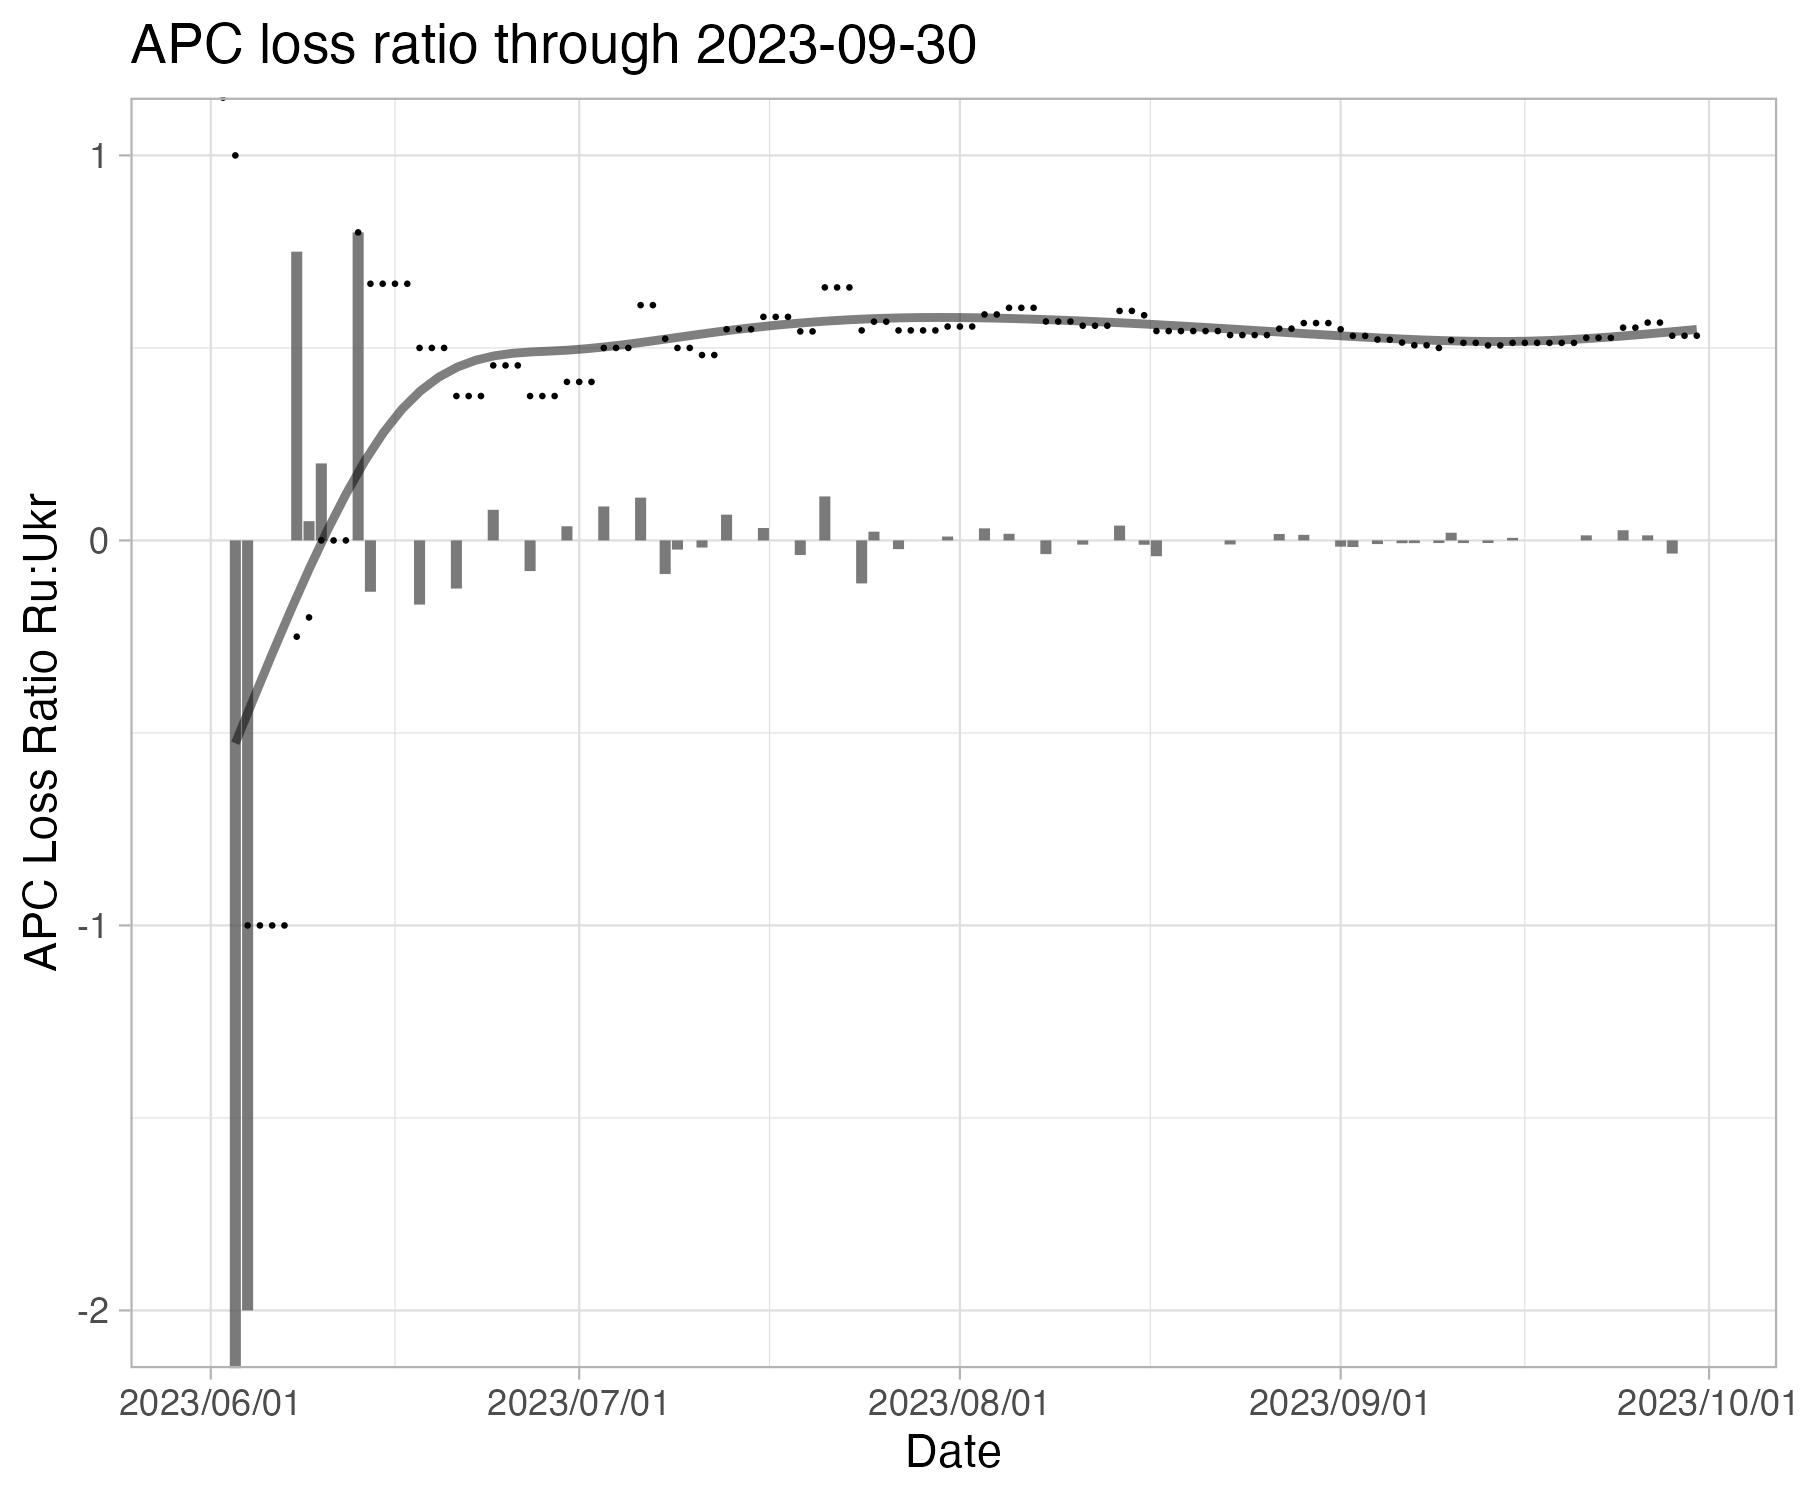
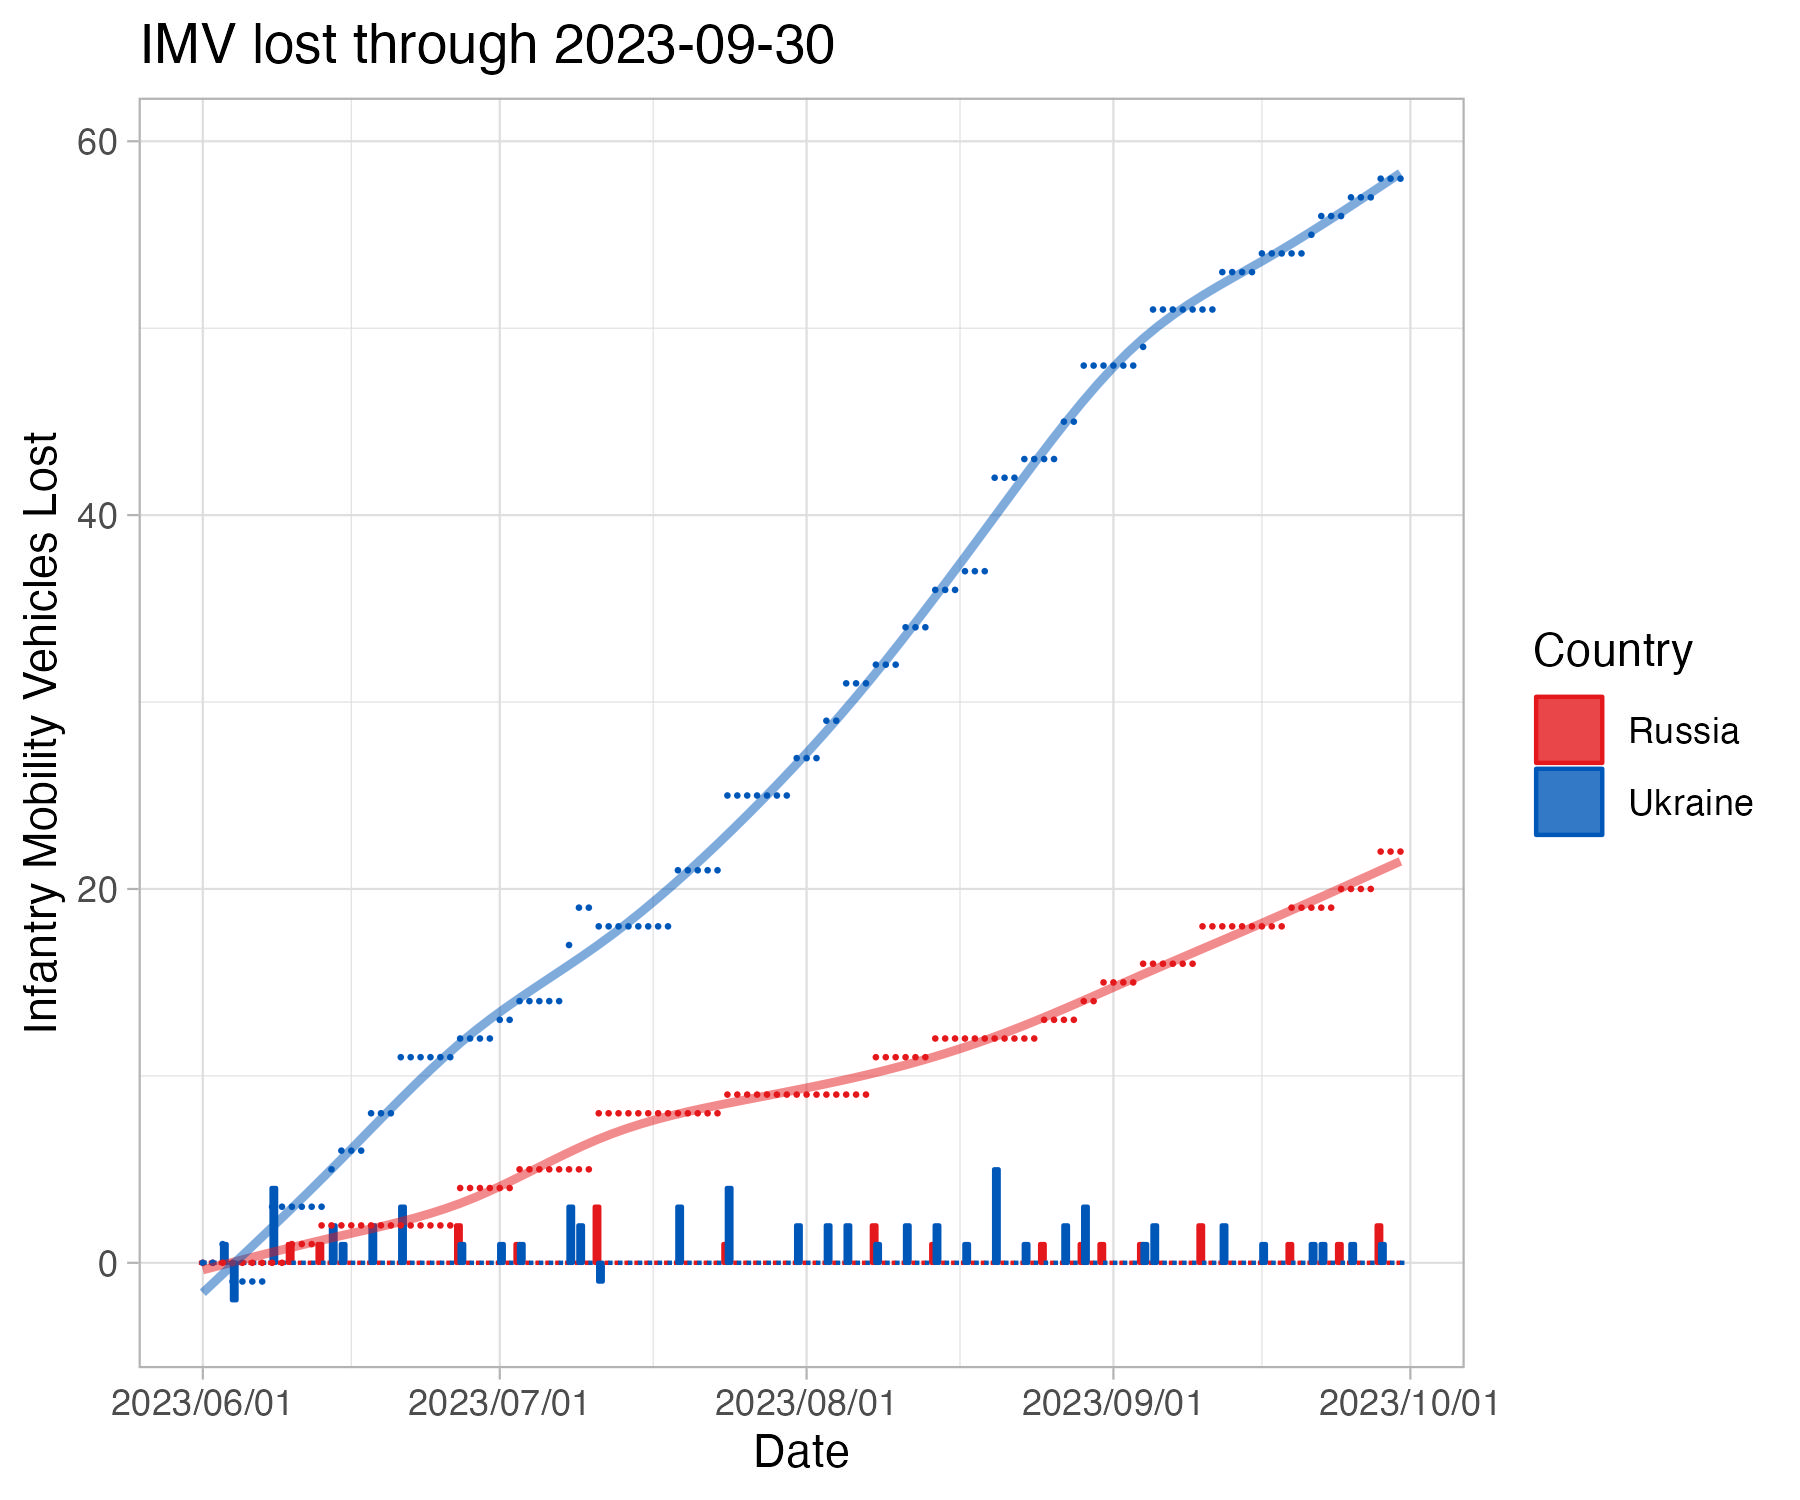
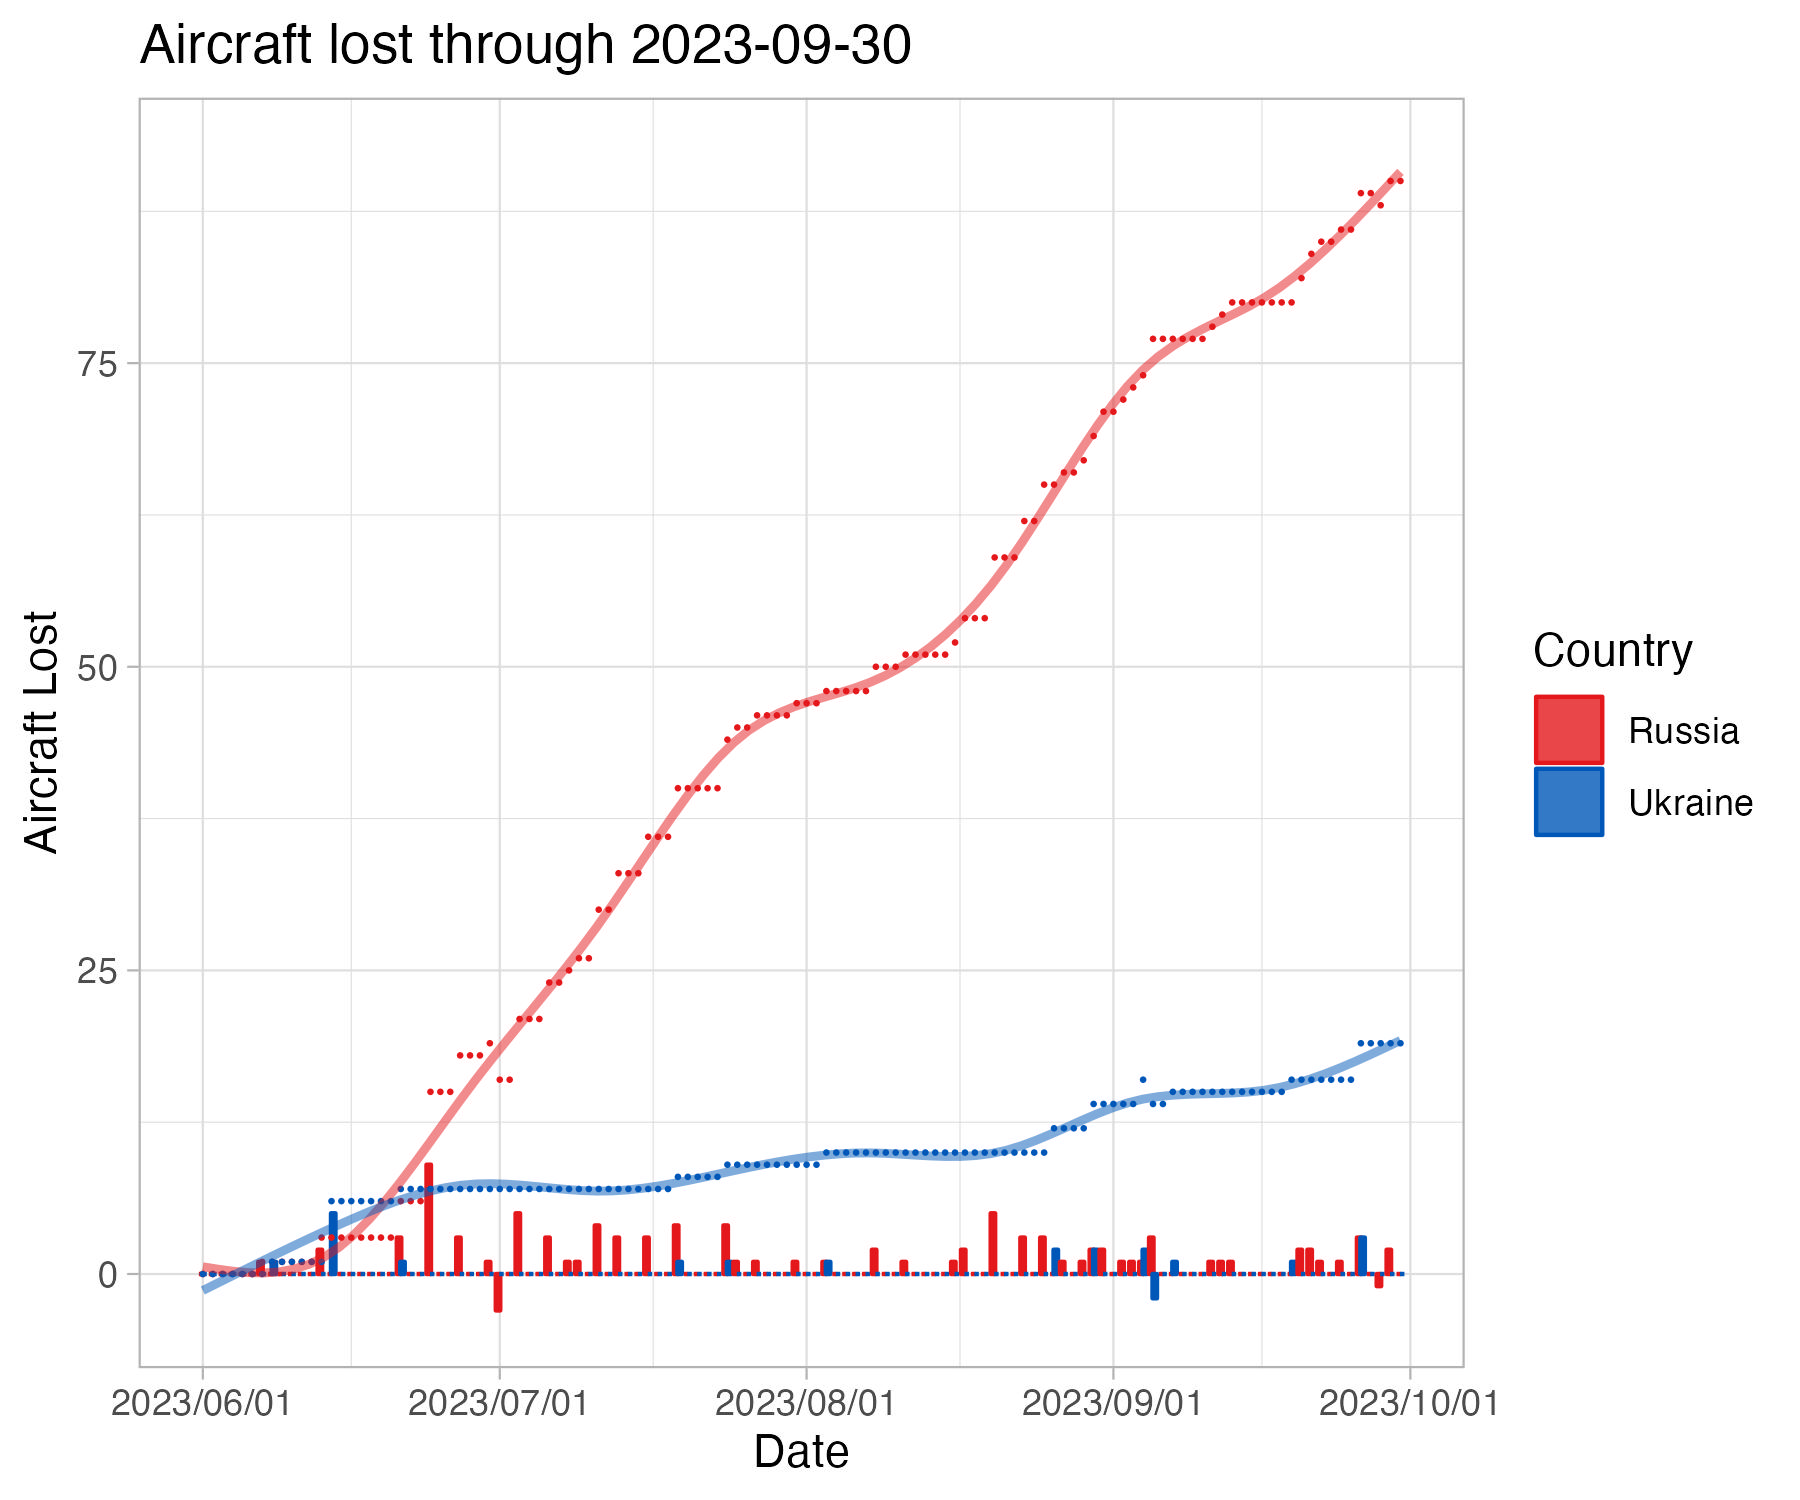
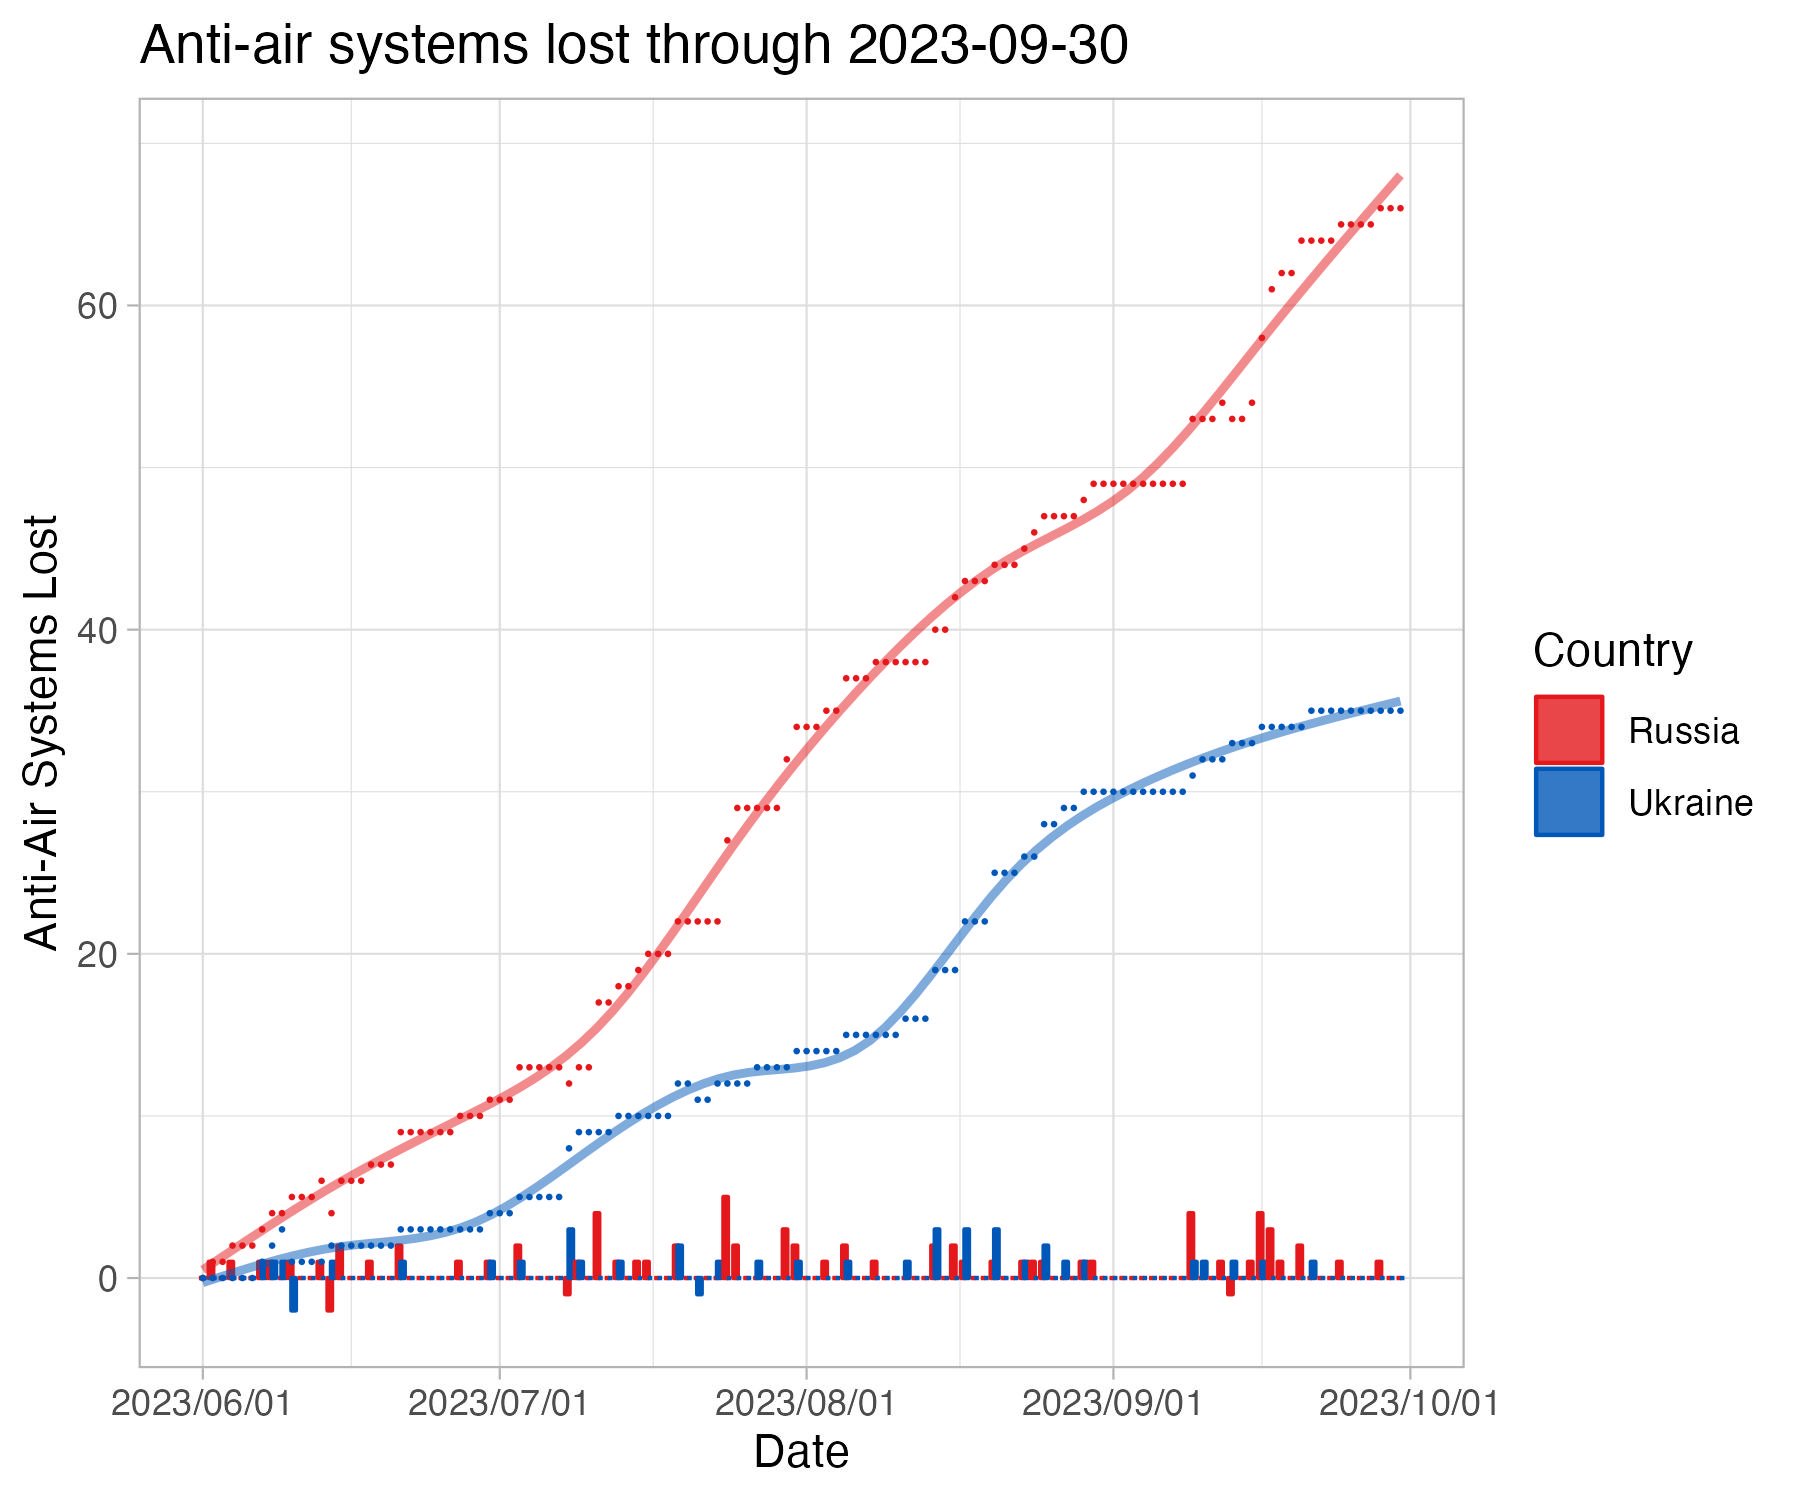
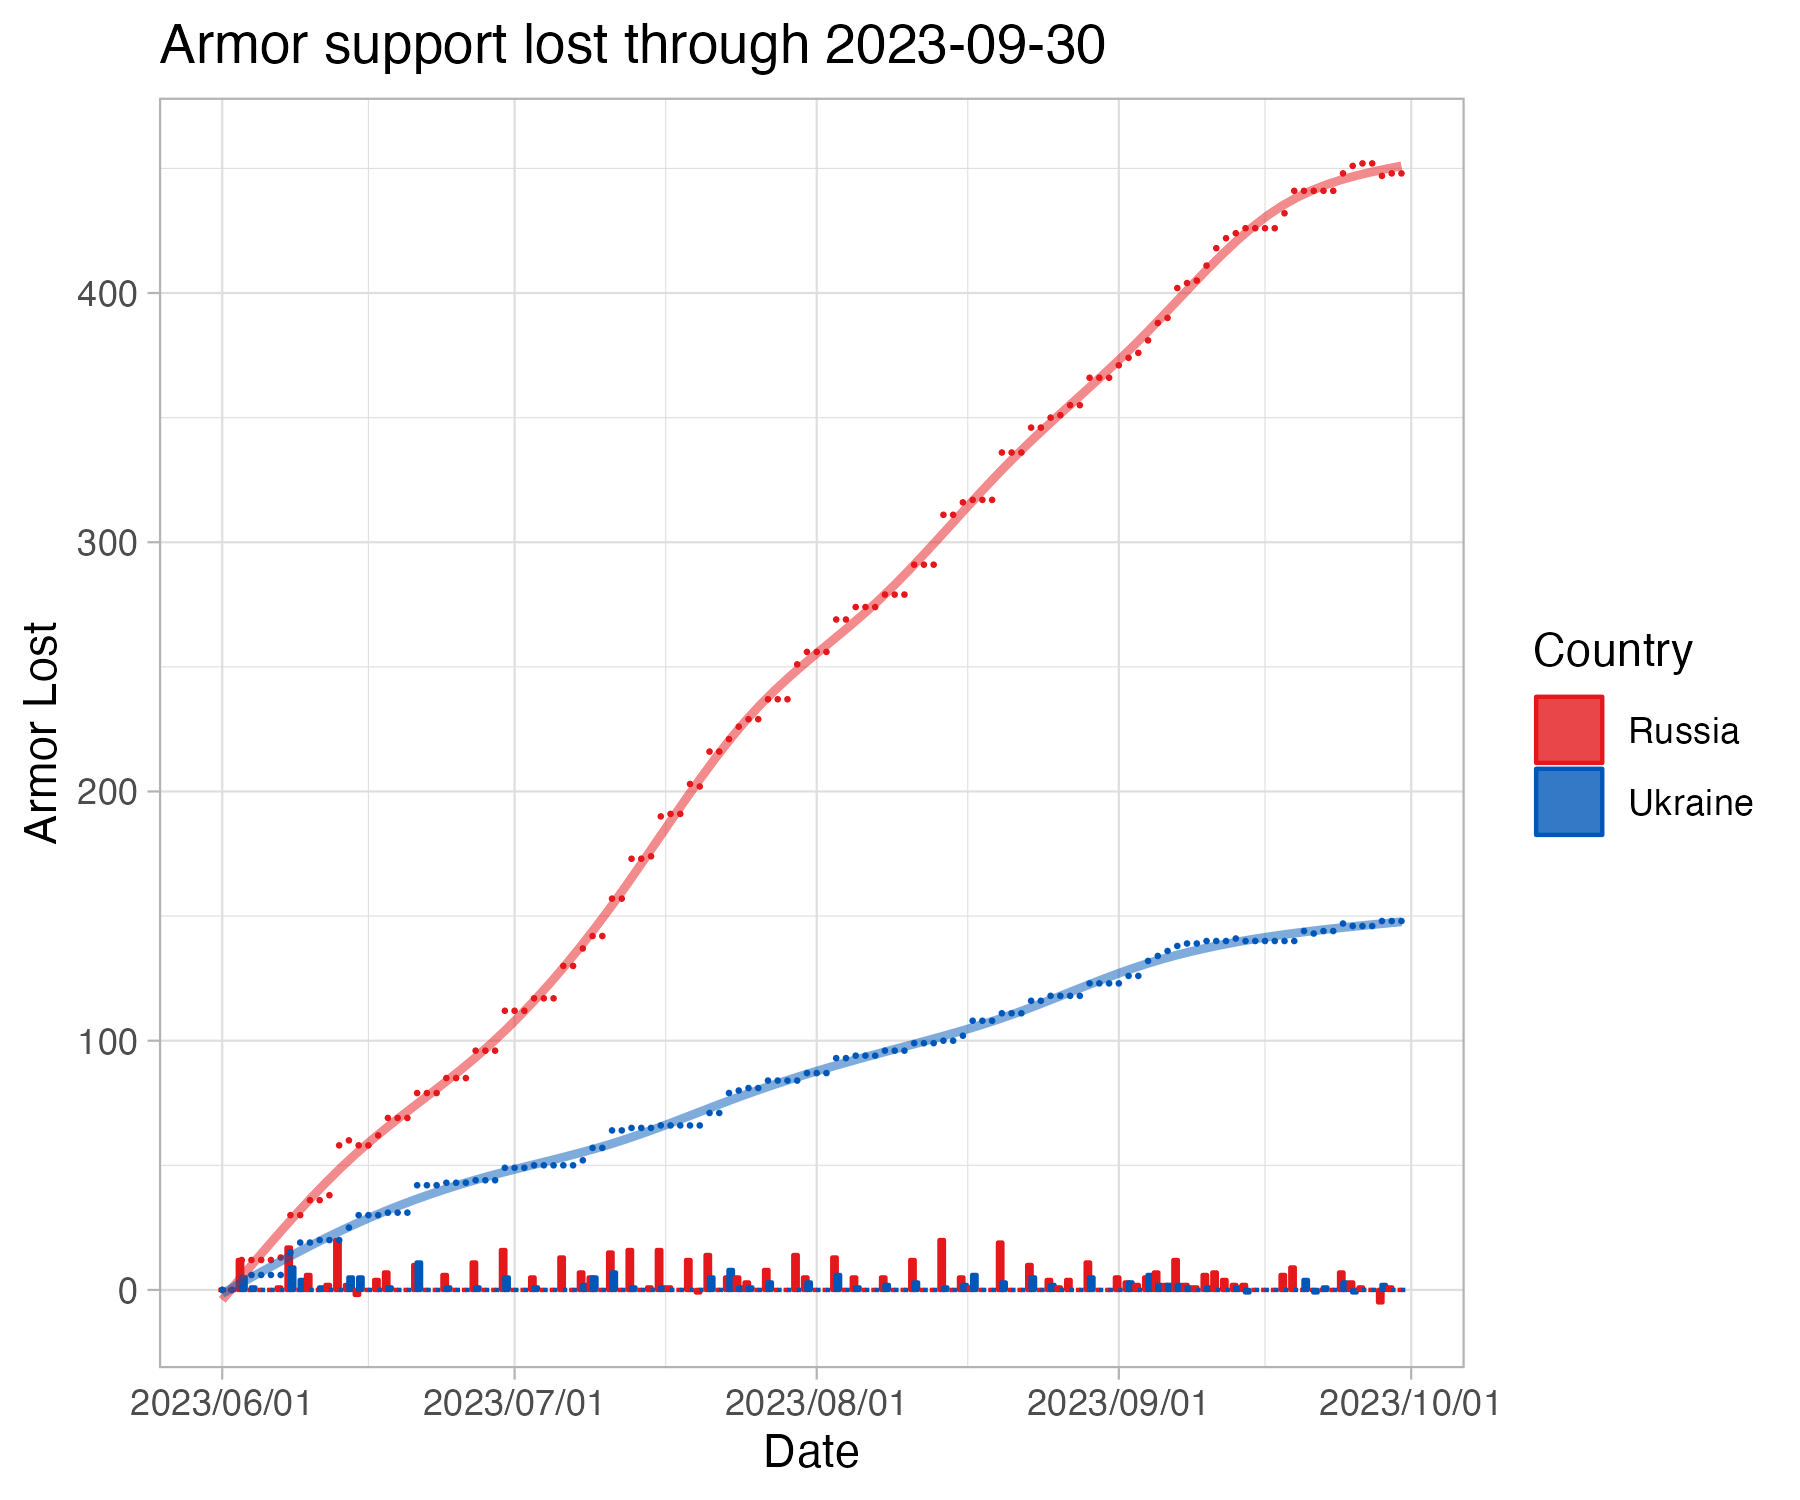
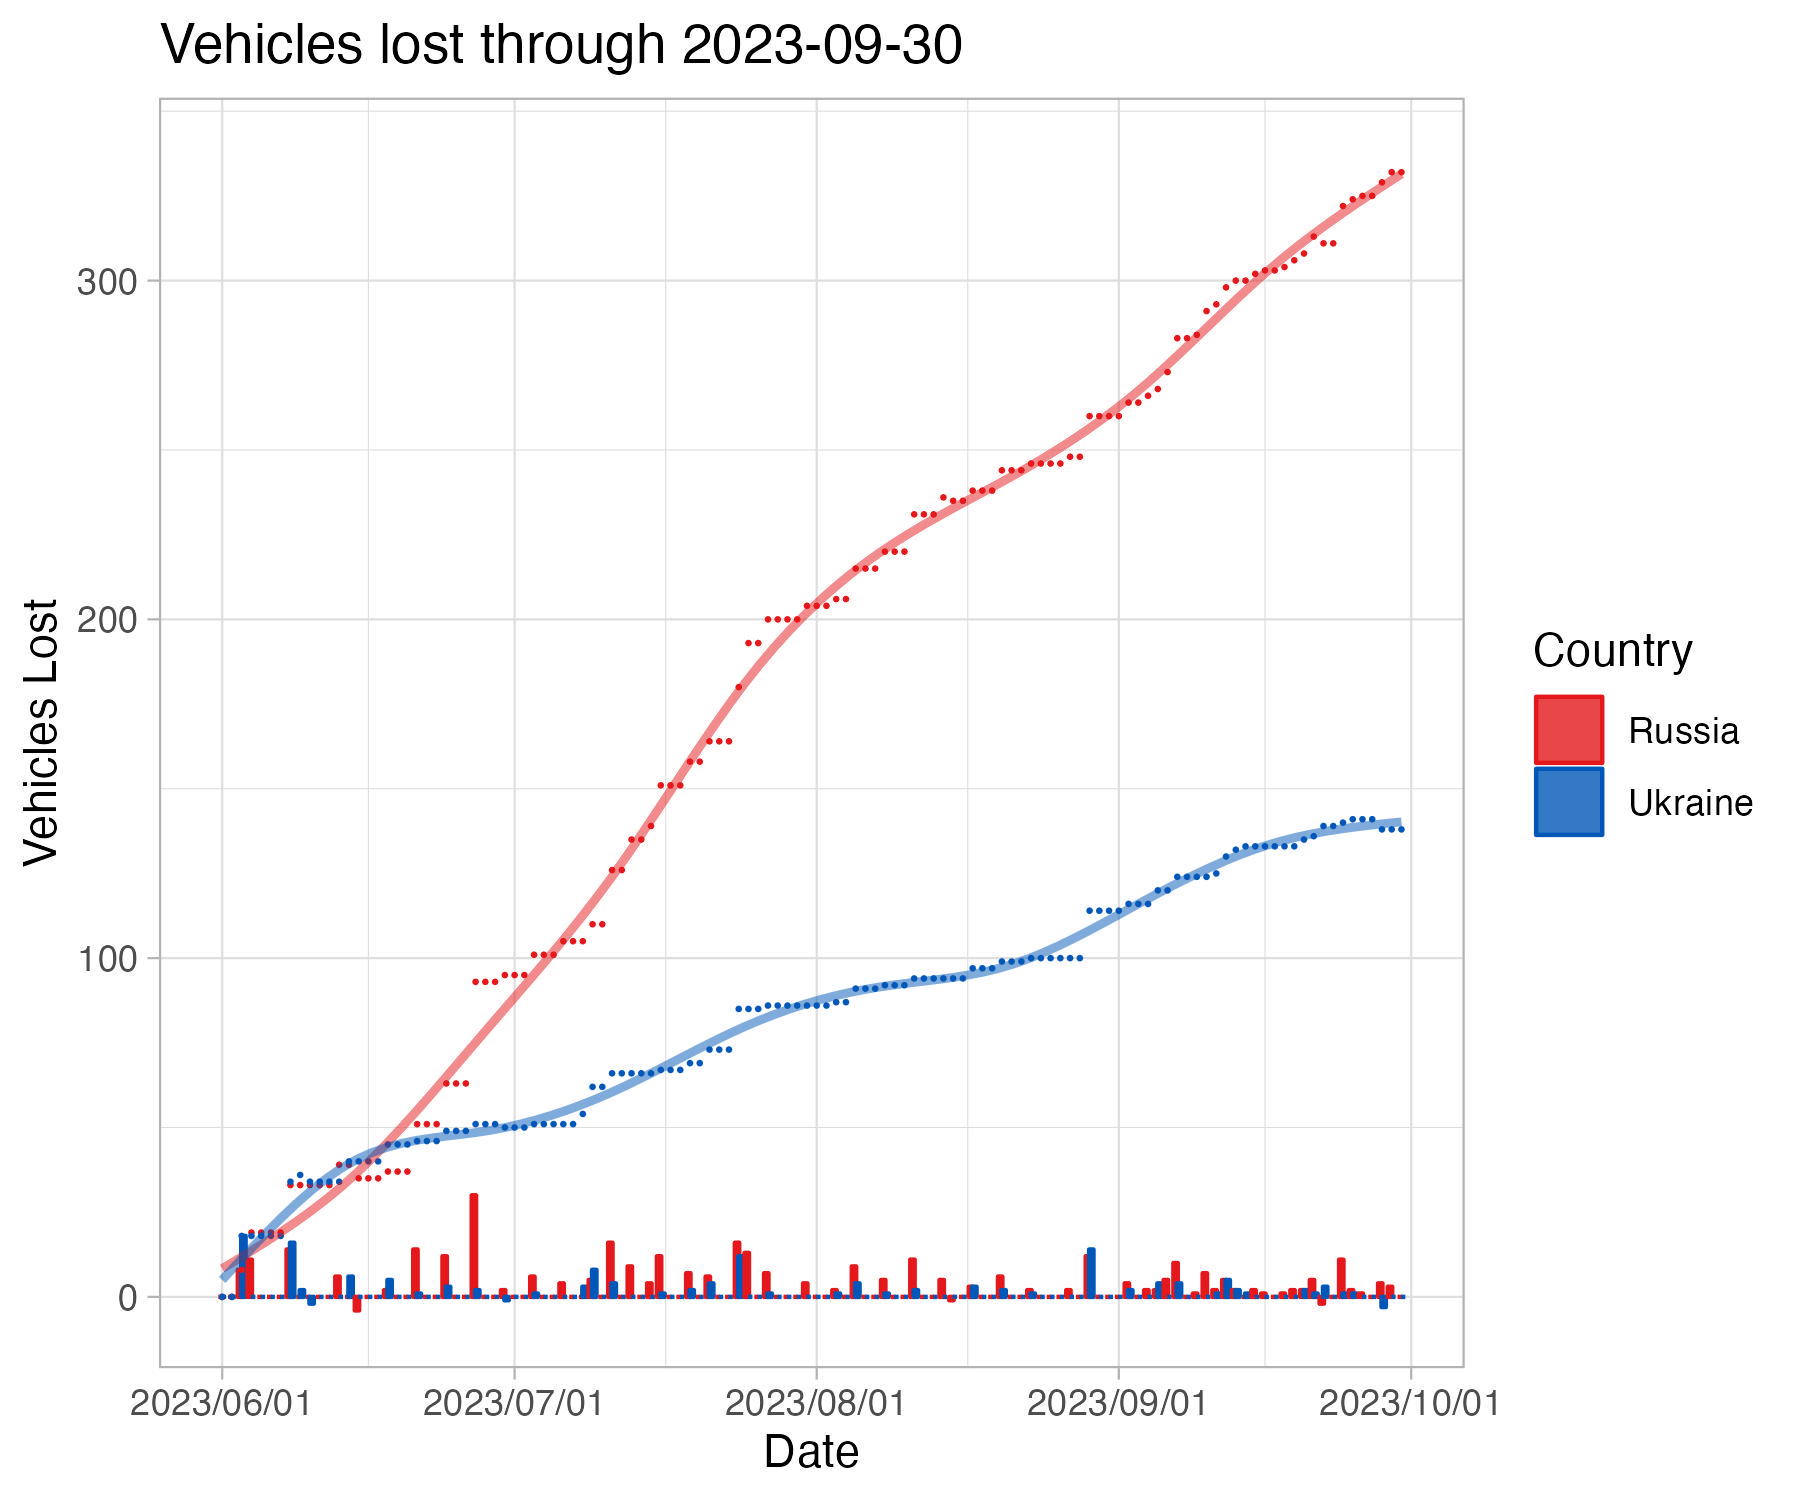
Points (red = Russia, blue = Ukraine) represent cumulative losses for each day, bars represent daily losses. The line represents a general additive model smooth on cumulative losses to date; the shaded grey band represents the 95% confidence interval based on extant variation (e.g. point scatter). A wider grey band means more uncertainty, a narrower grey band means less uncertainty.
Please keep in mind that this is empirical, not interpretive, analysis. A concern raised about the available data is that it undercounts Ukrainian losses. This is possible not just because of bias (note that pro-Russian sources are monitored as well) but because areas under Russian control are less likely to have photo documentation. Fog of war is very real. There is no attempt here to use a modifier to adjust numbers - analysis is strictly empirical. Any bias in the original data will be reflected in the following analyses.
Lastly, if you would like to make edits to descriptions of these data feel free to create a pull request or a new issue.
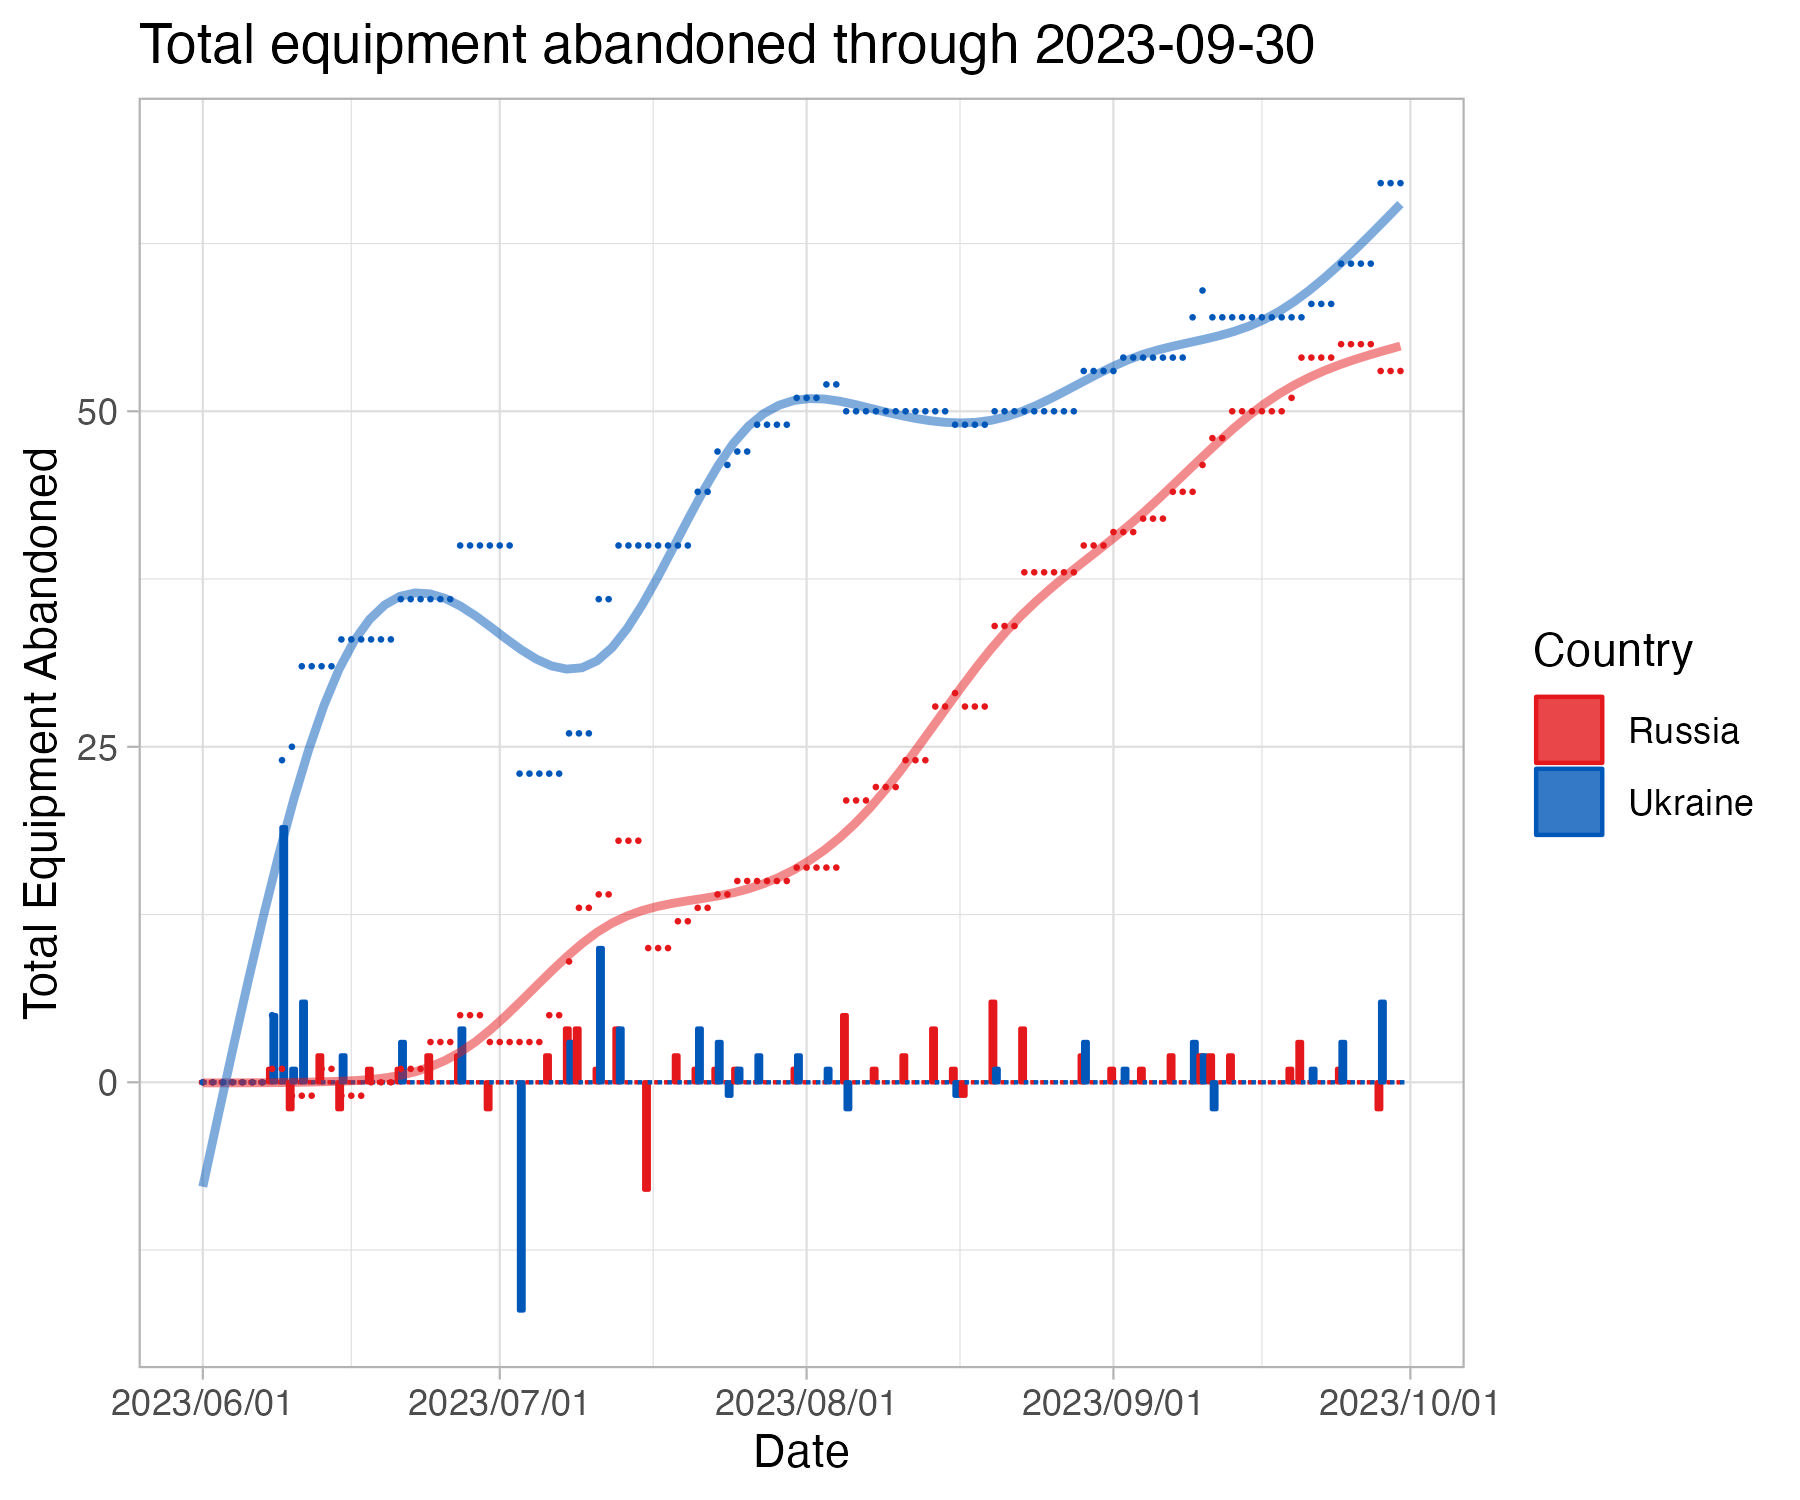
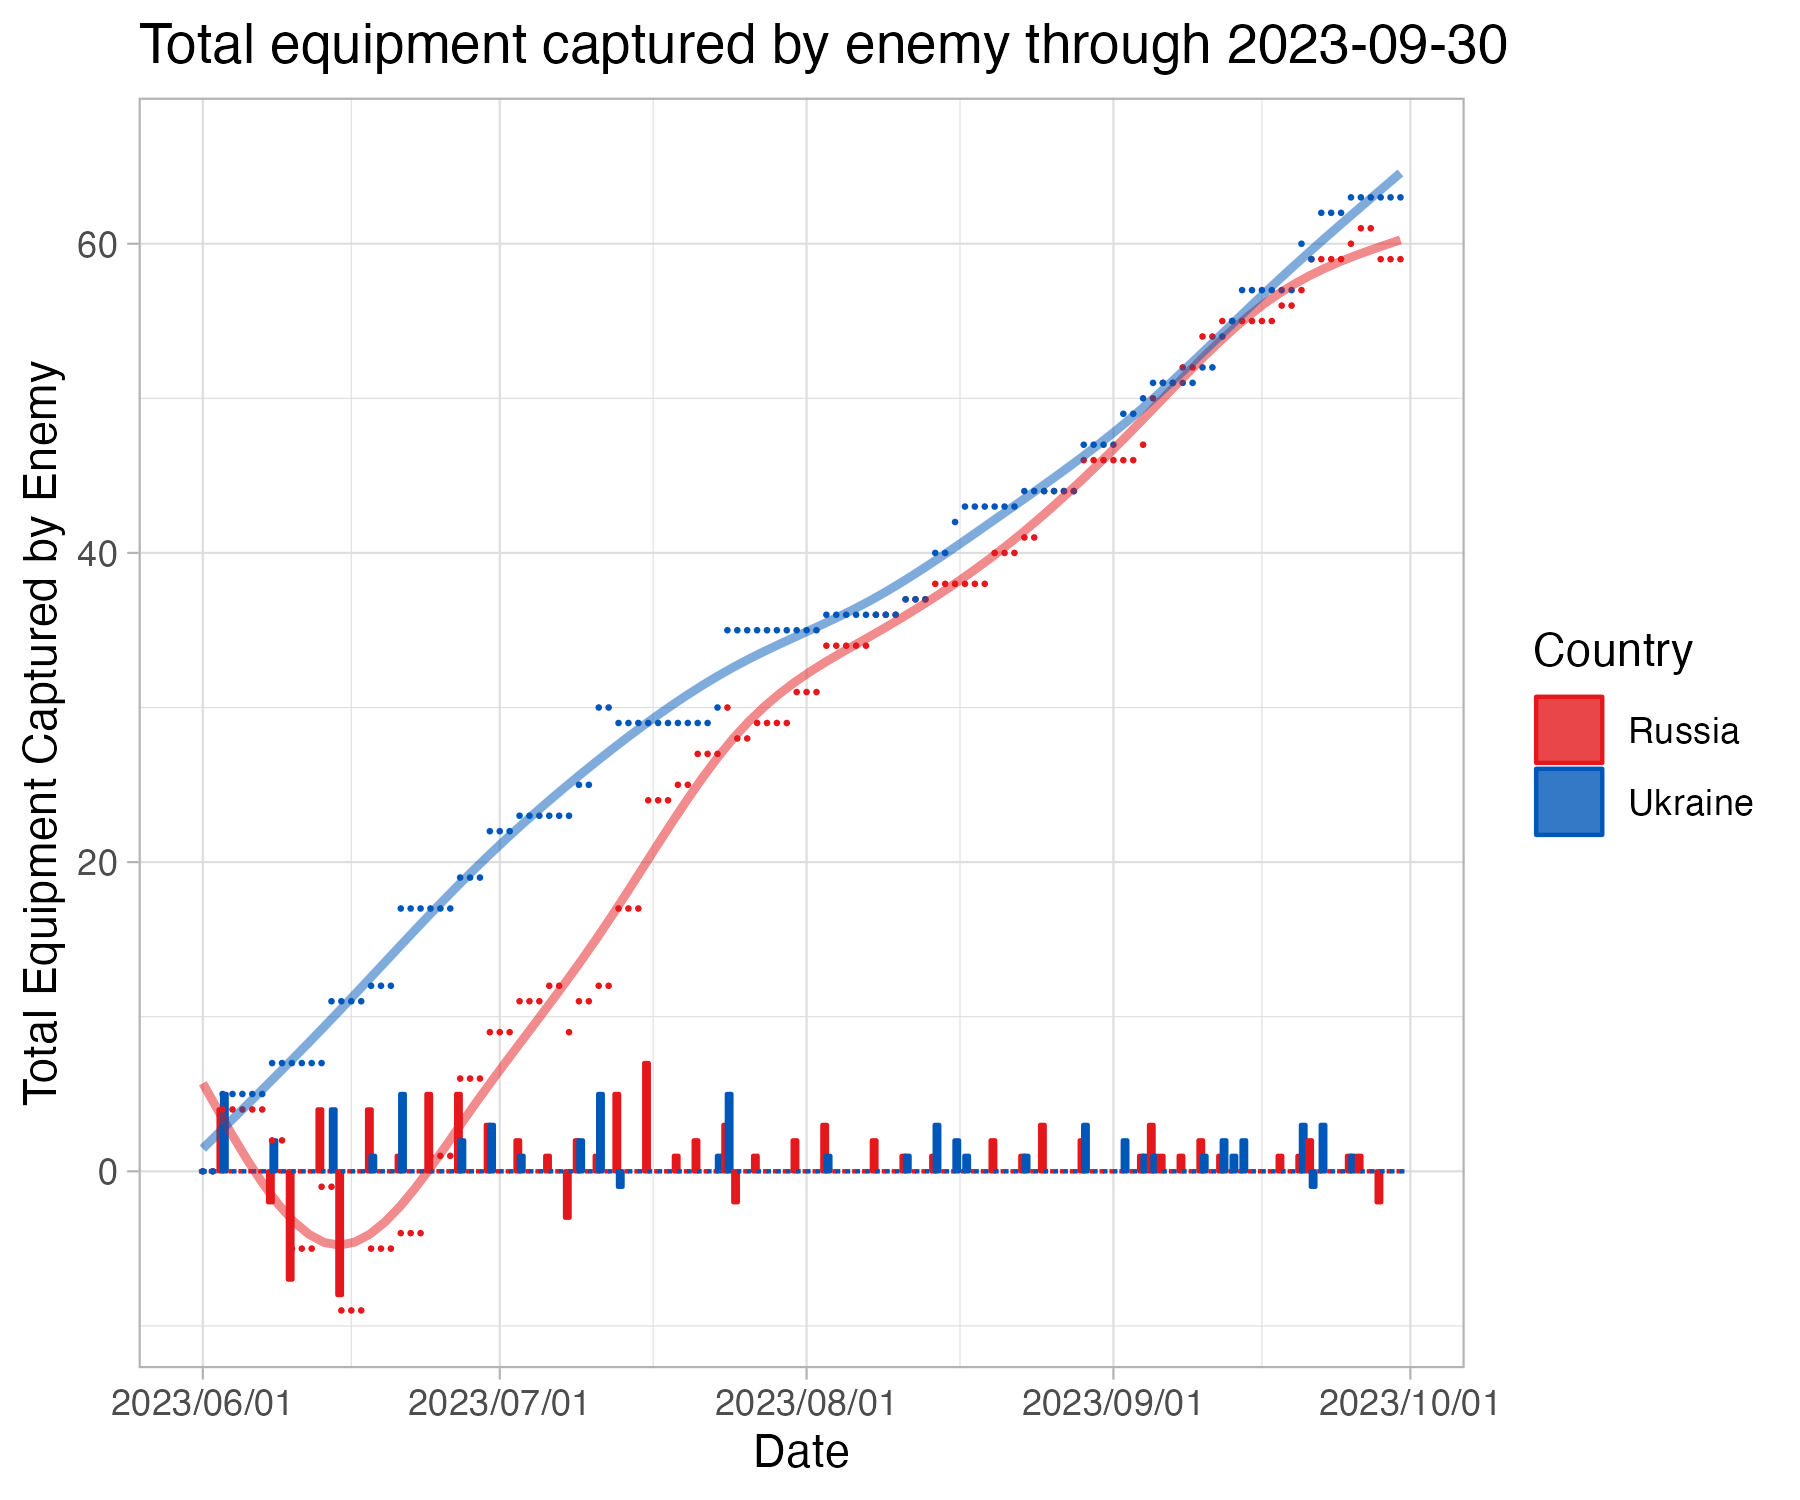
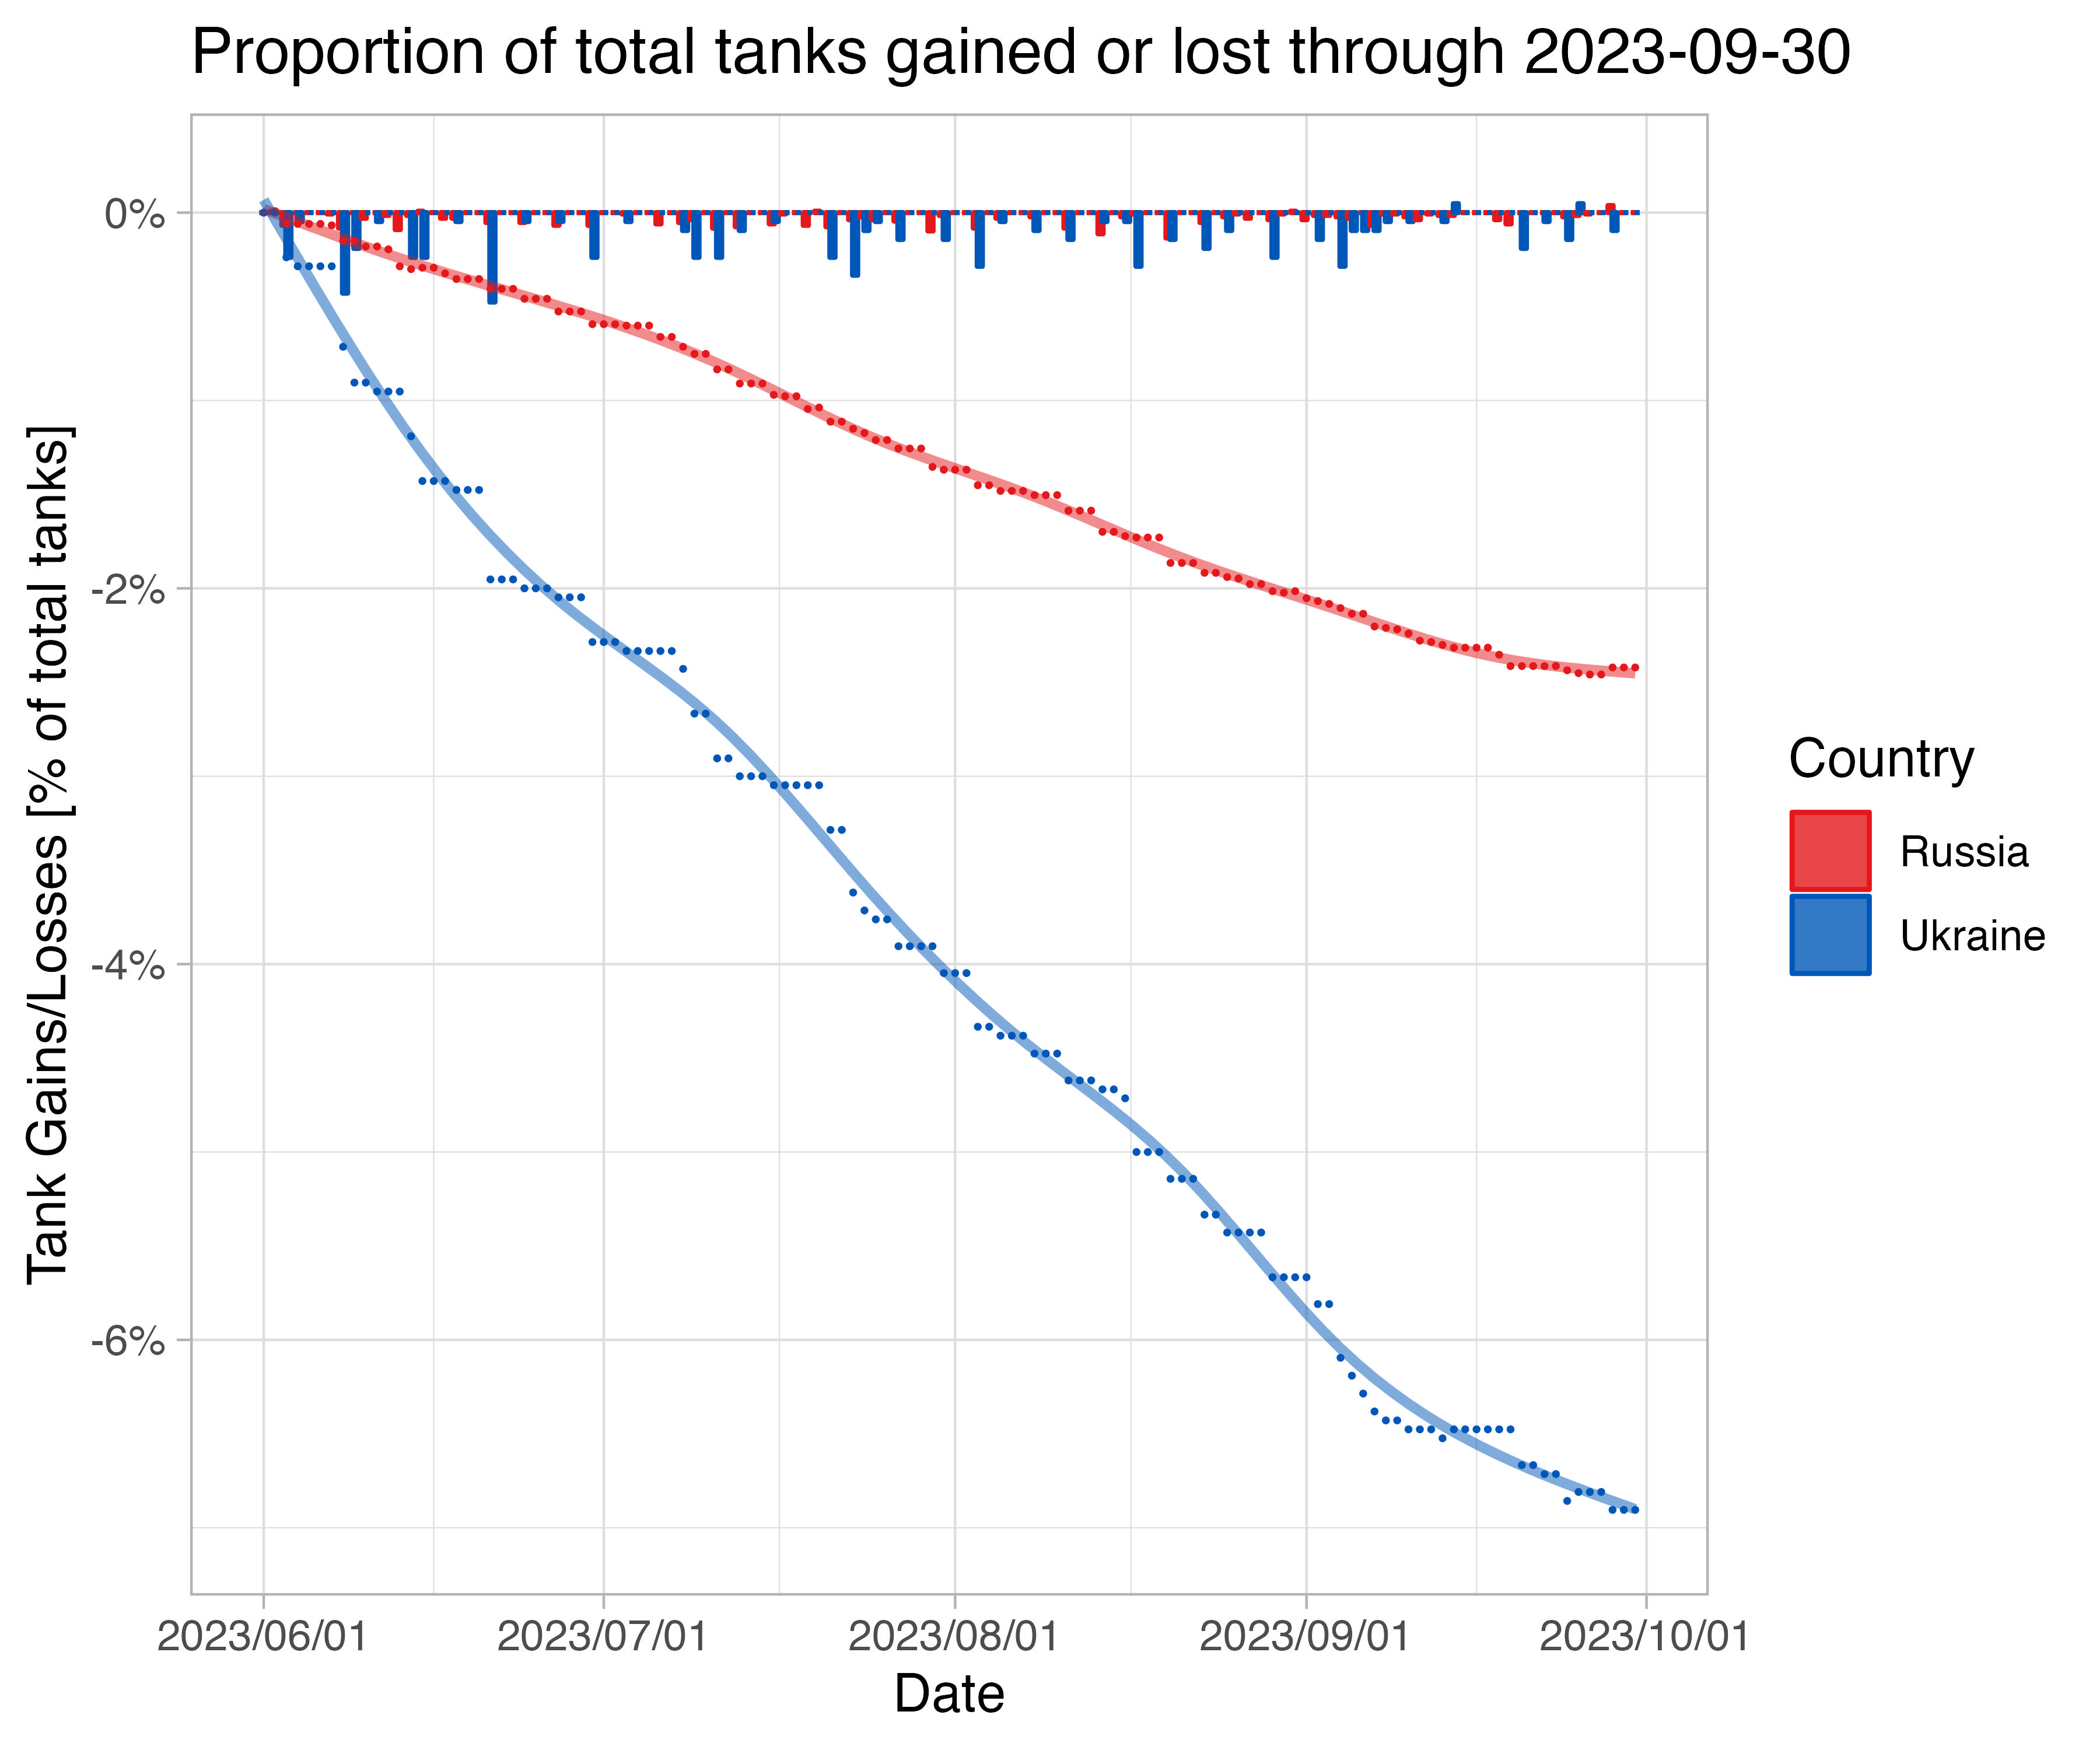
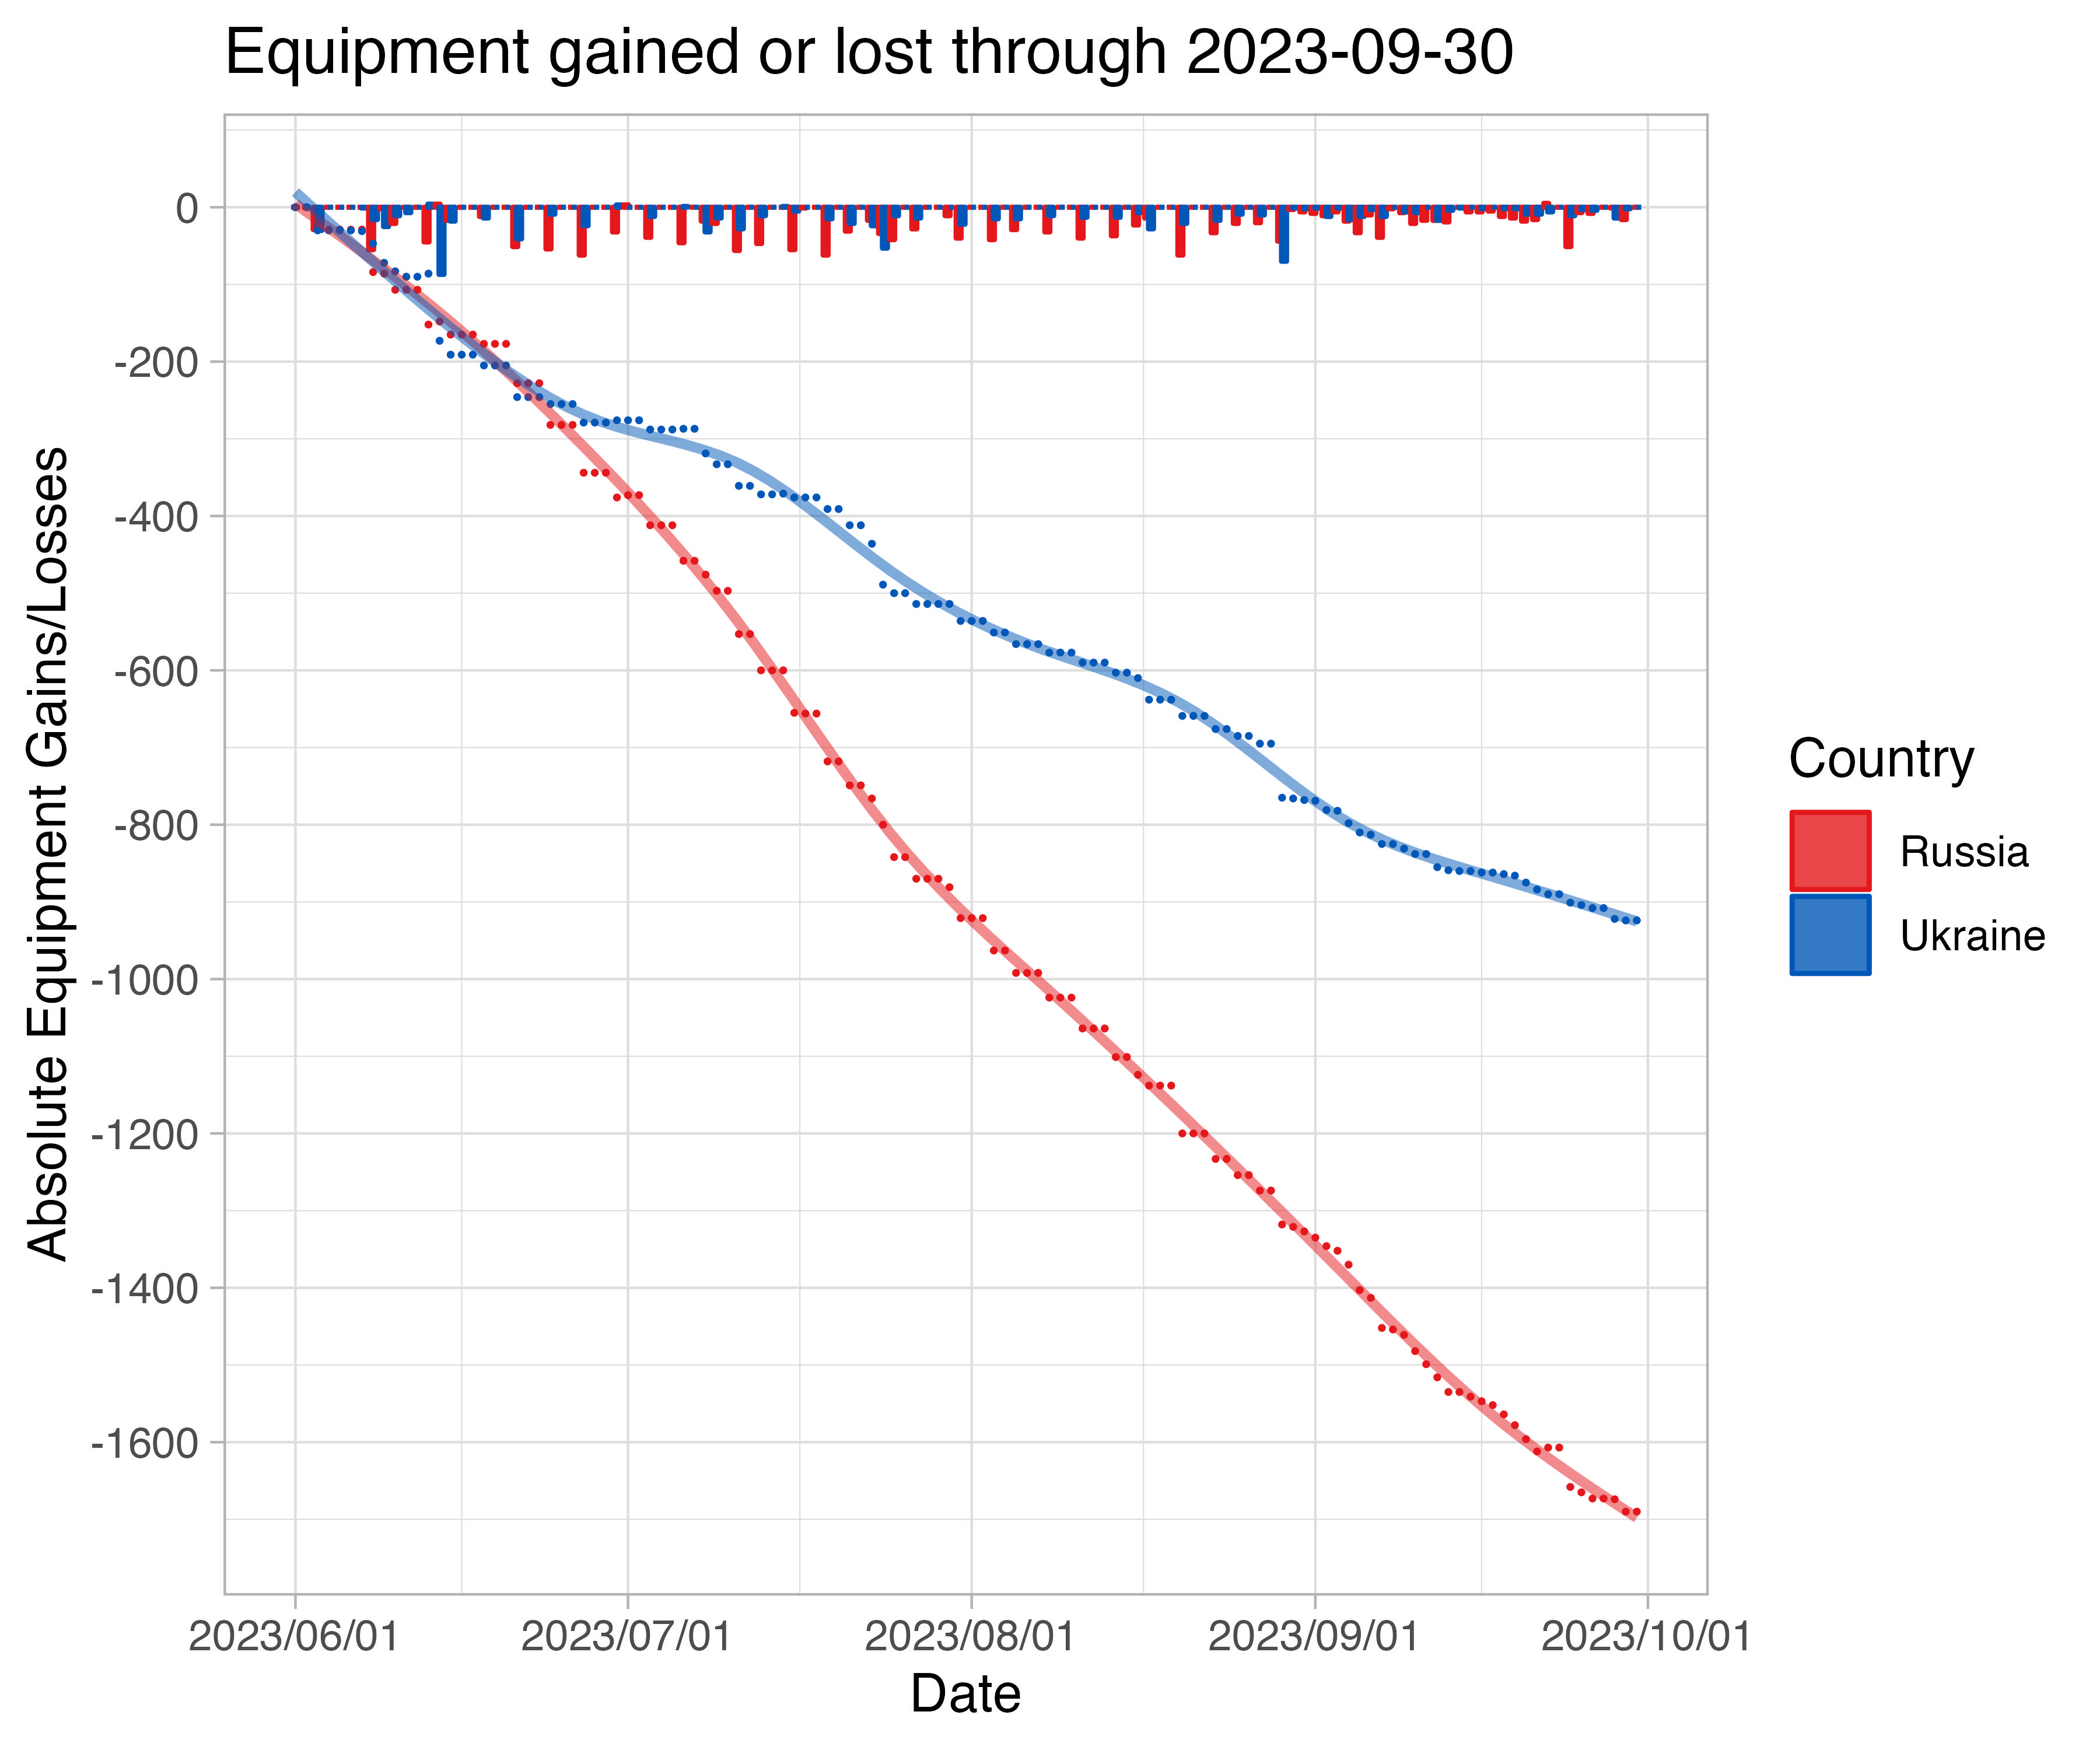 This calculation subtracts units captured by each combatant with their other loss types (destroyed, damaged, and abandoned). It is arguable if a proportion of abandoned should be included as captures. Ukraine has a net positive change in equipment - meaning that known visible evidence has more cases of new captured eqipment that of losses. Russia however has lost many more units than it has acquired from Ukraine.
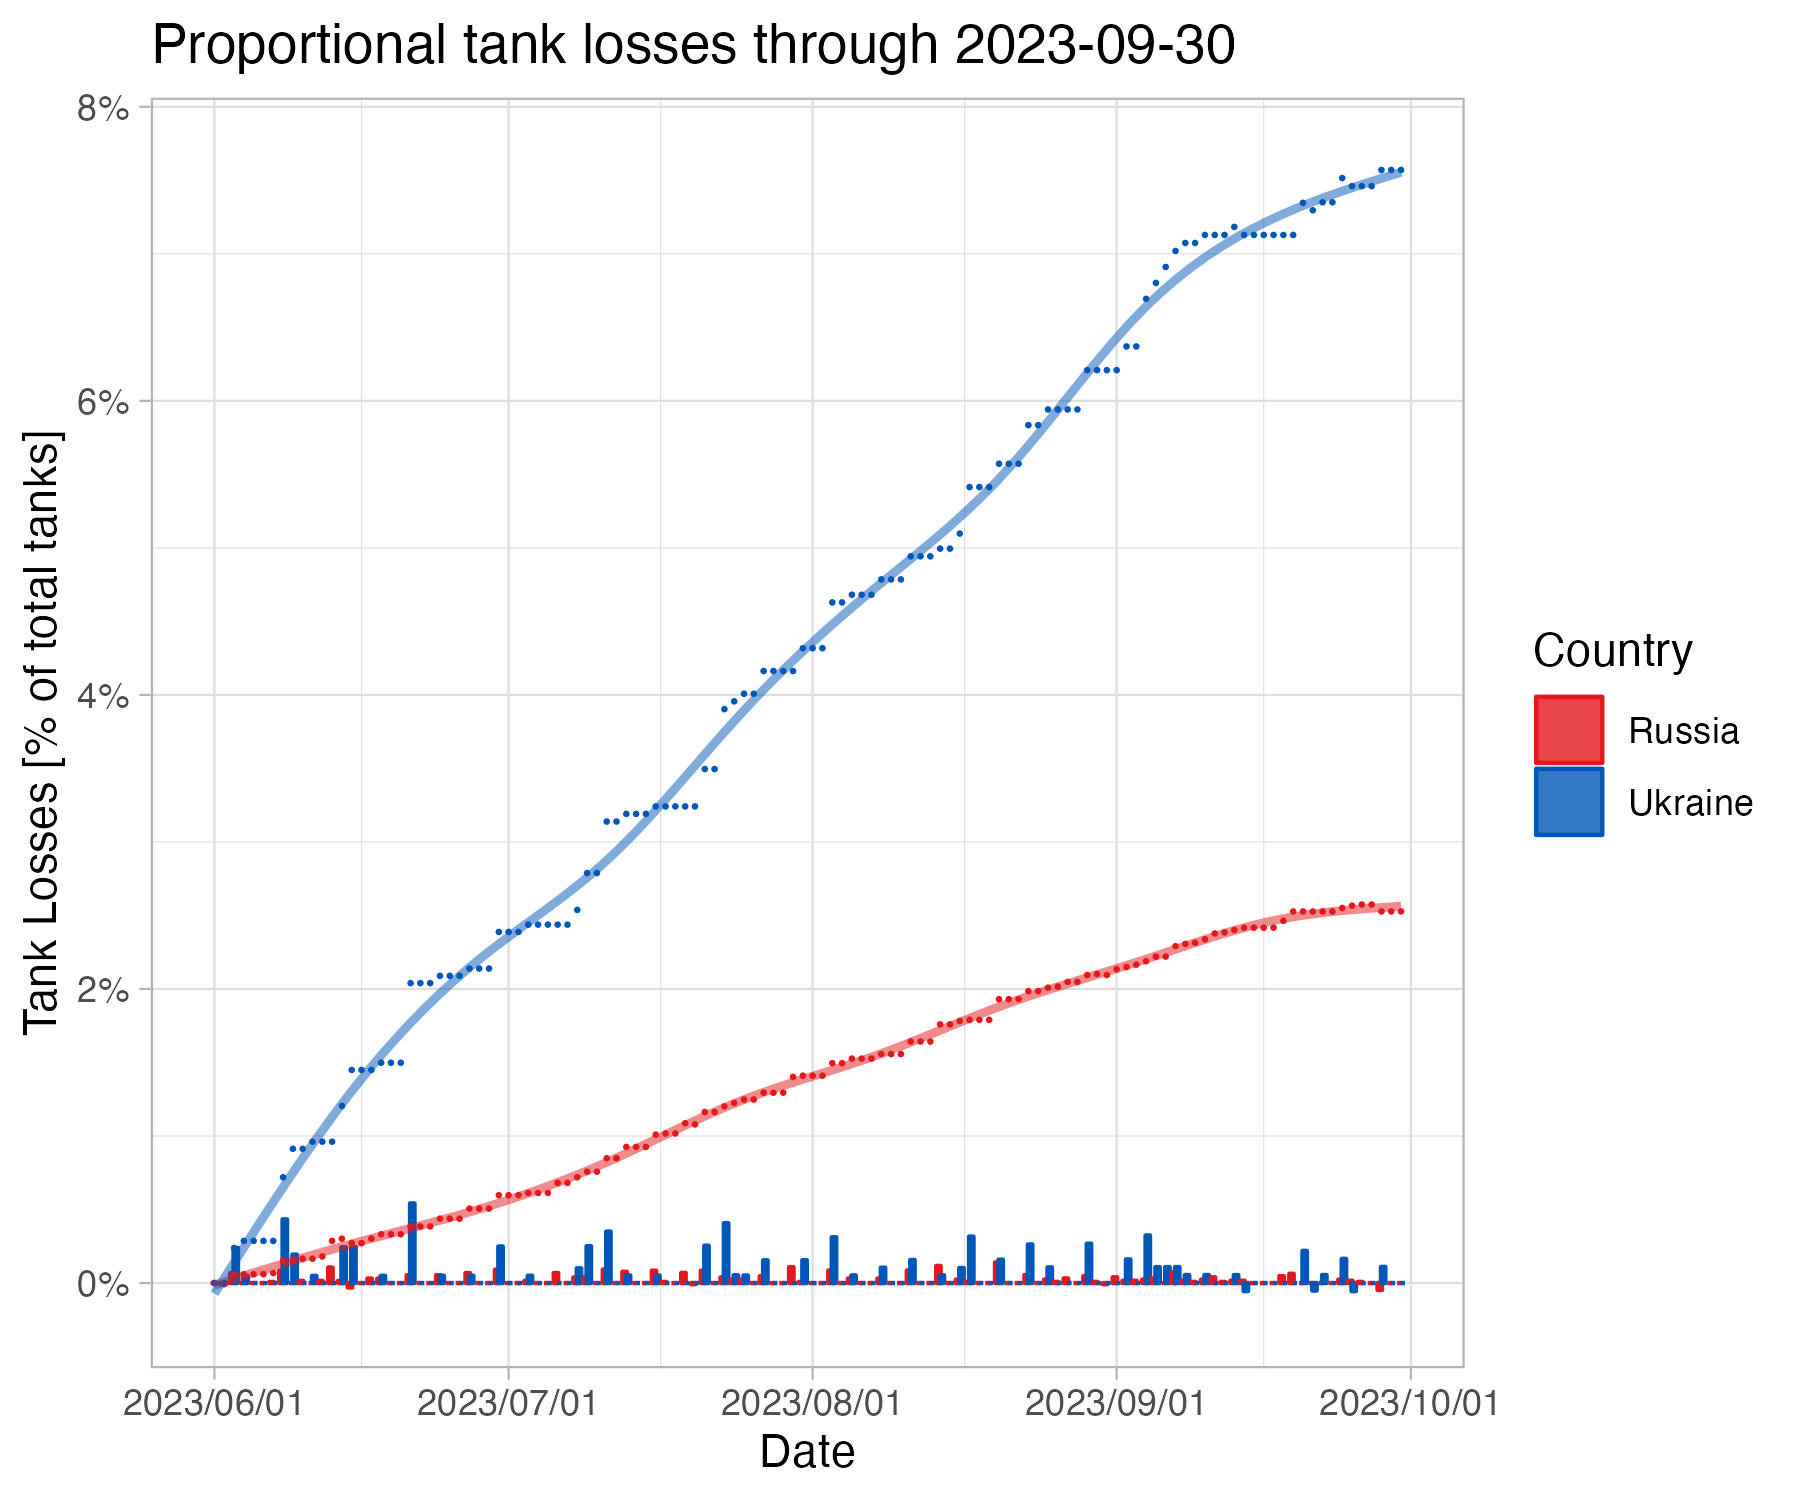
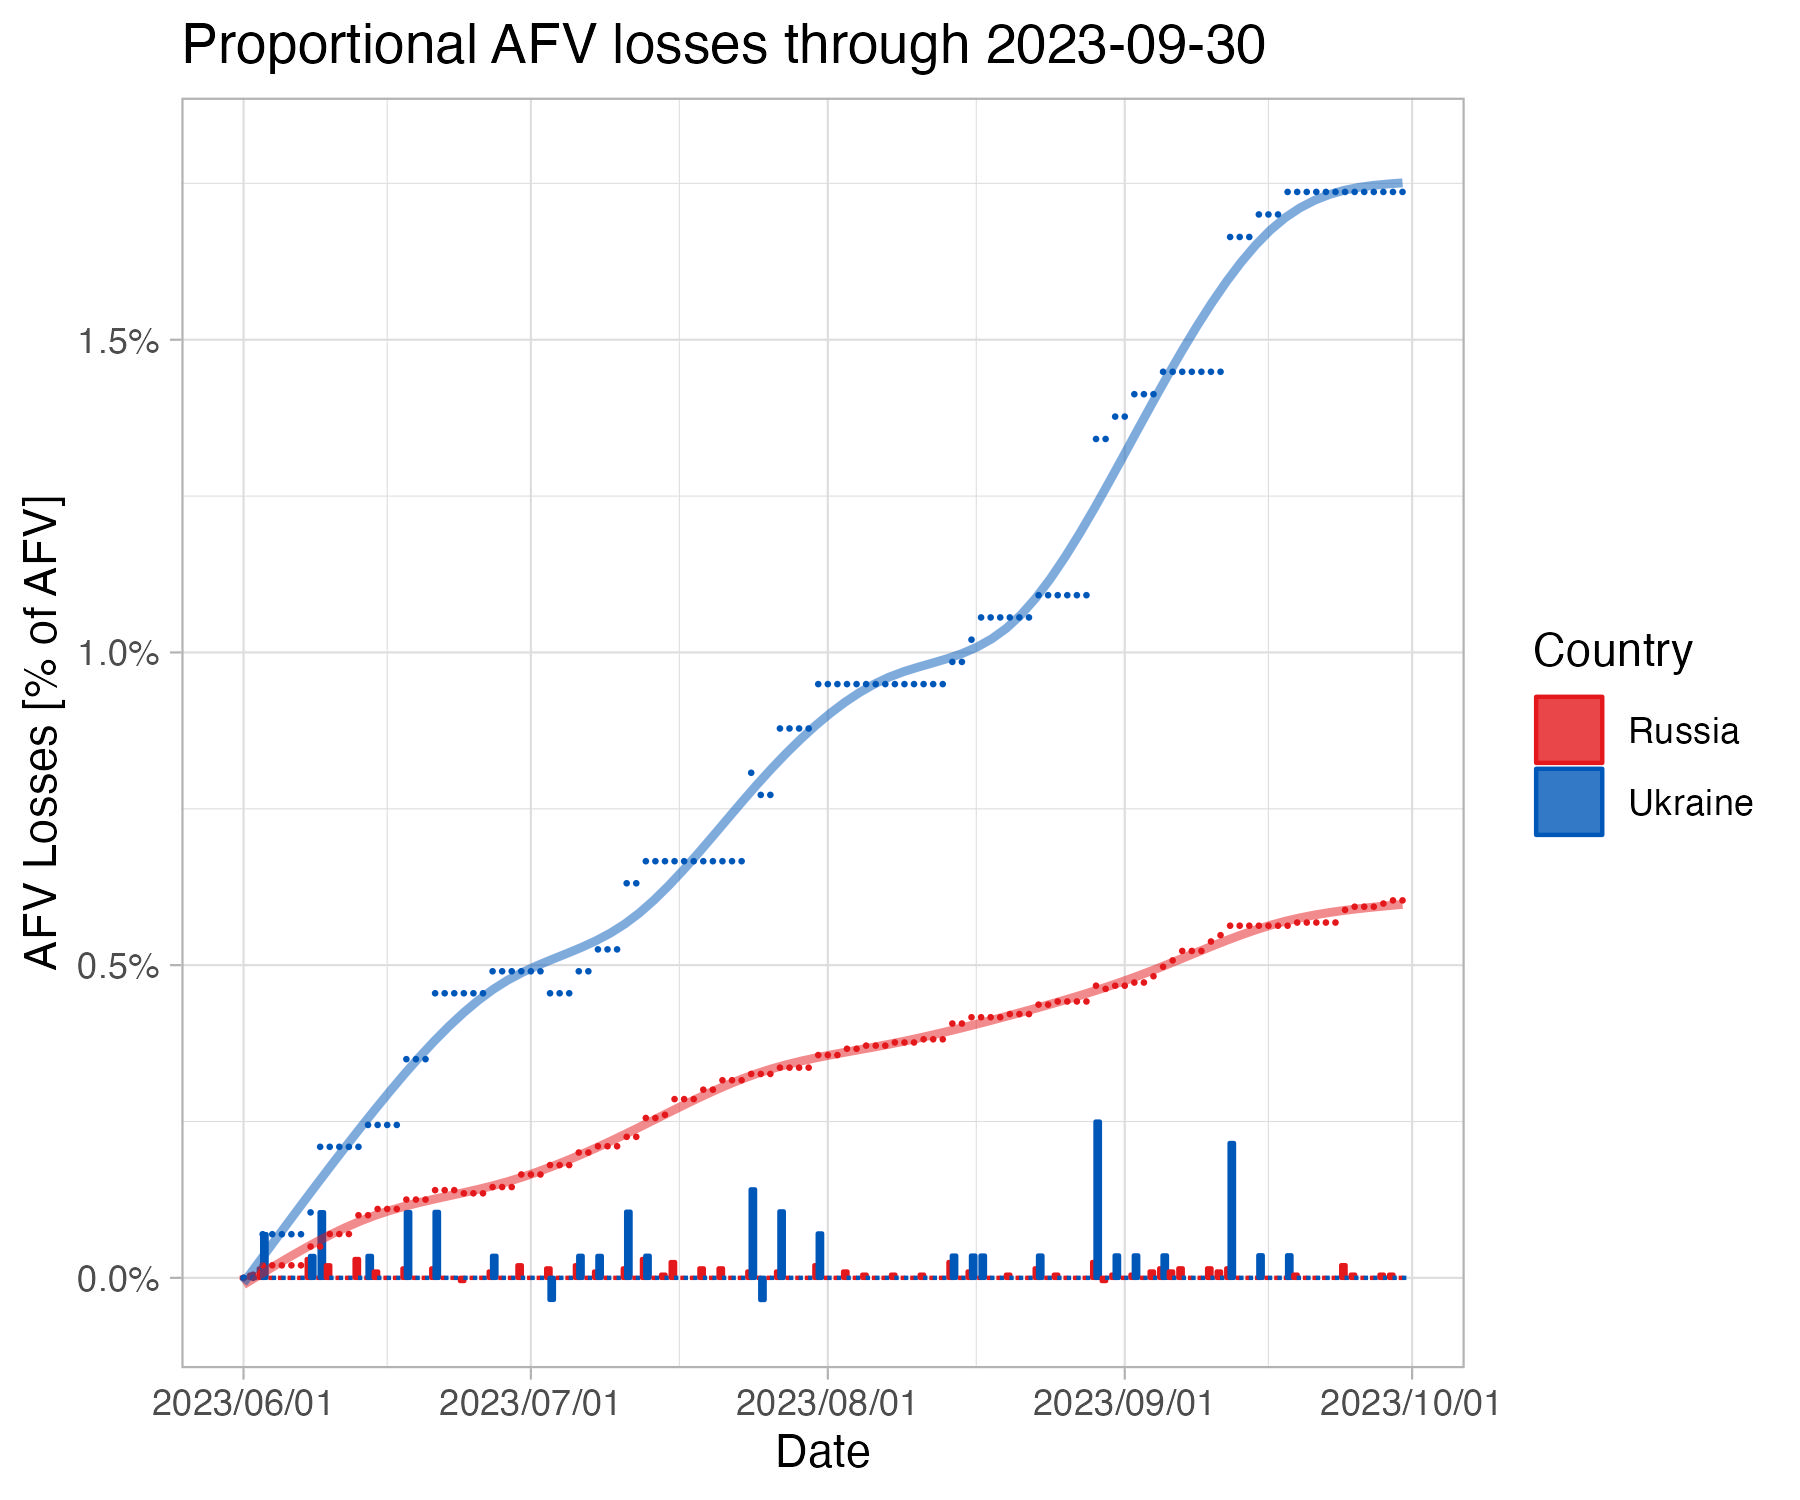
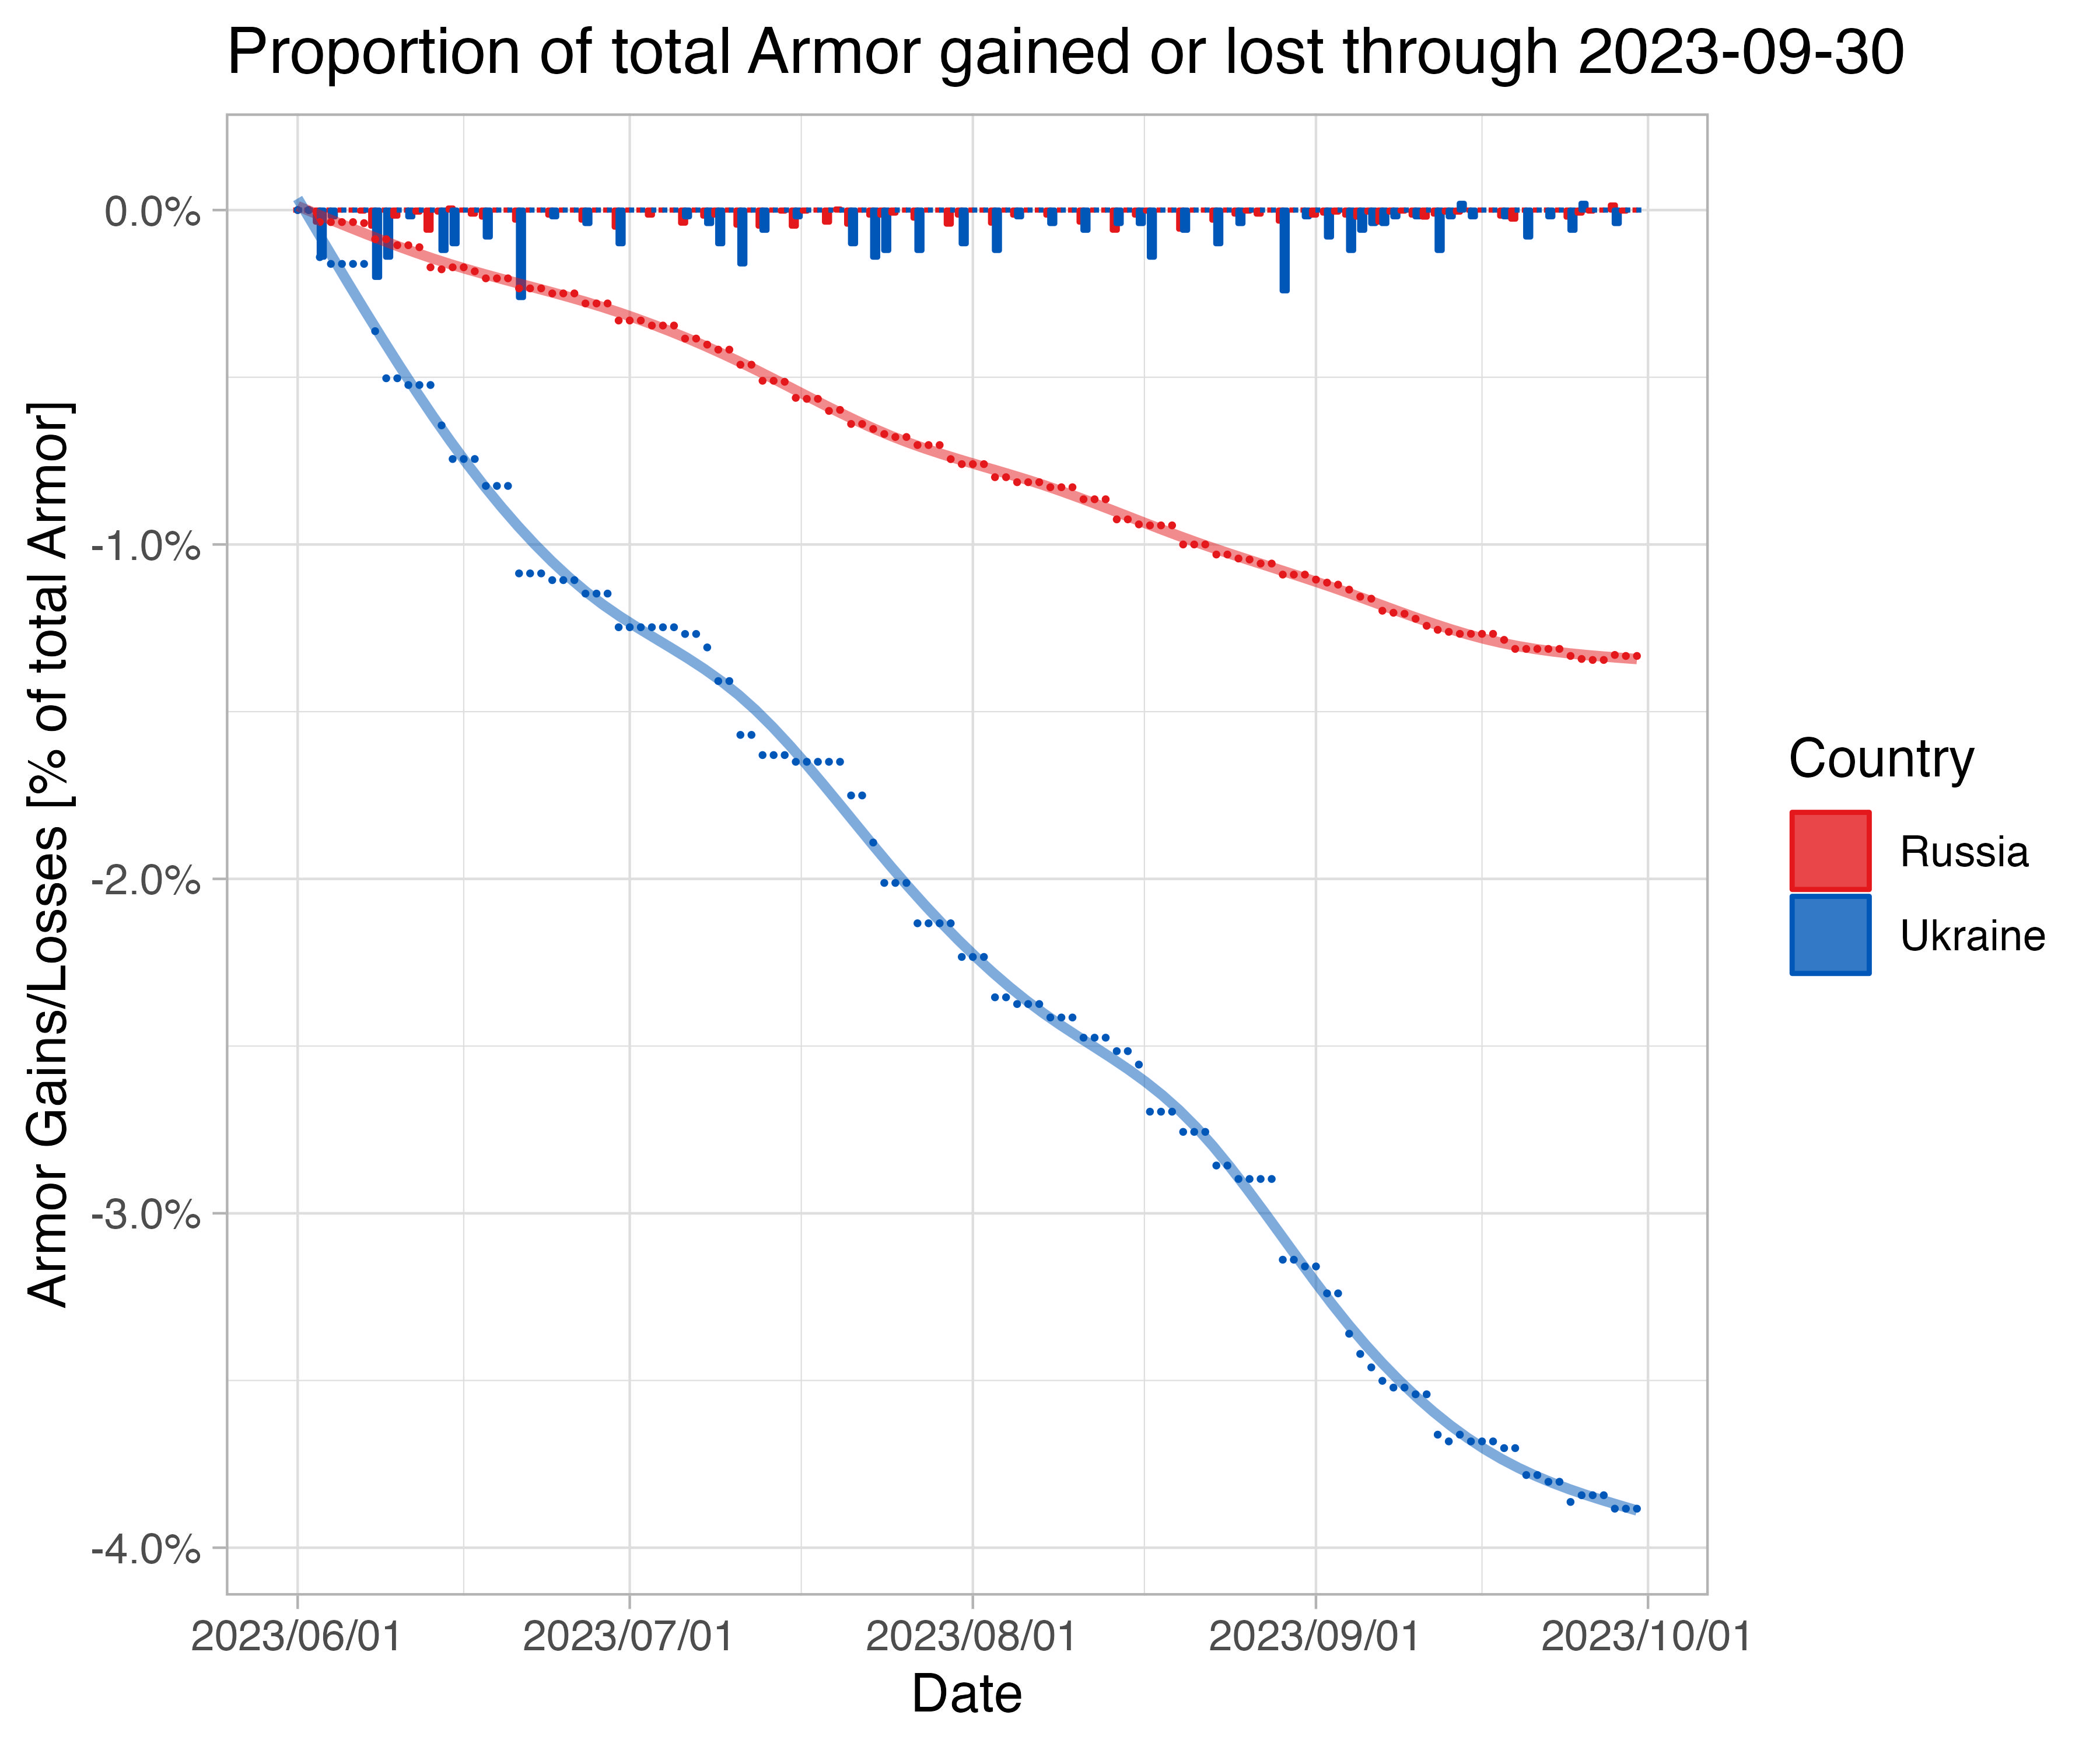
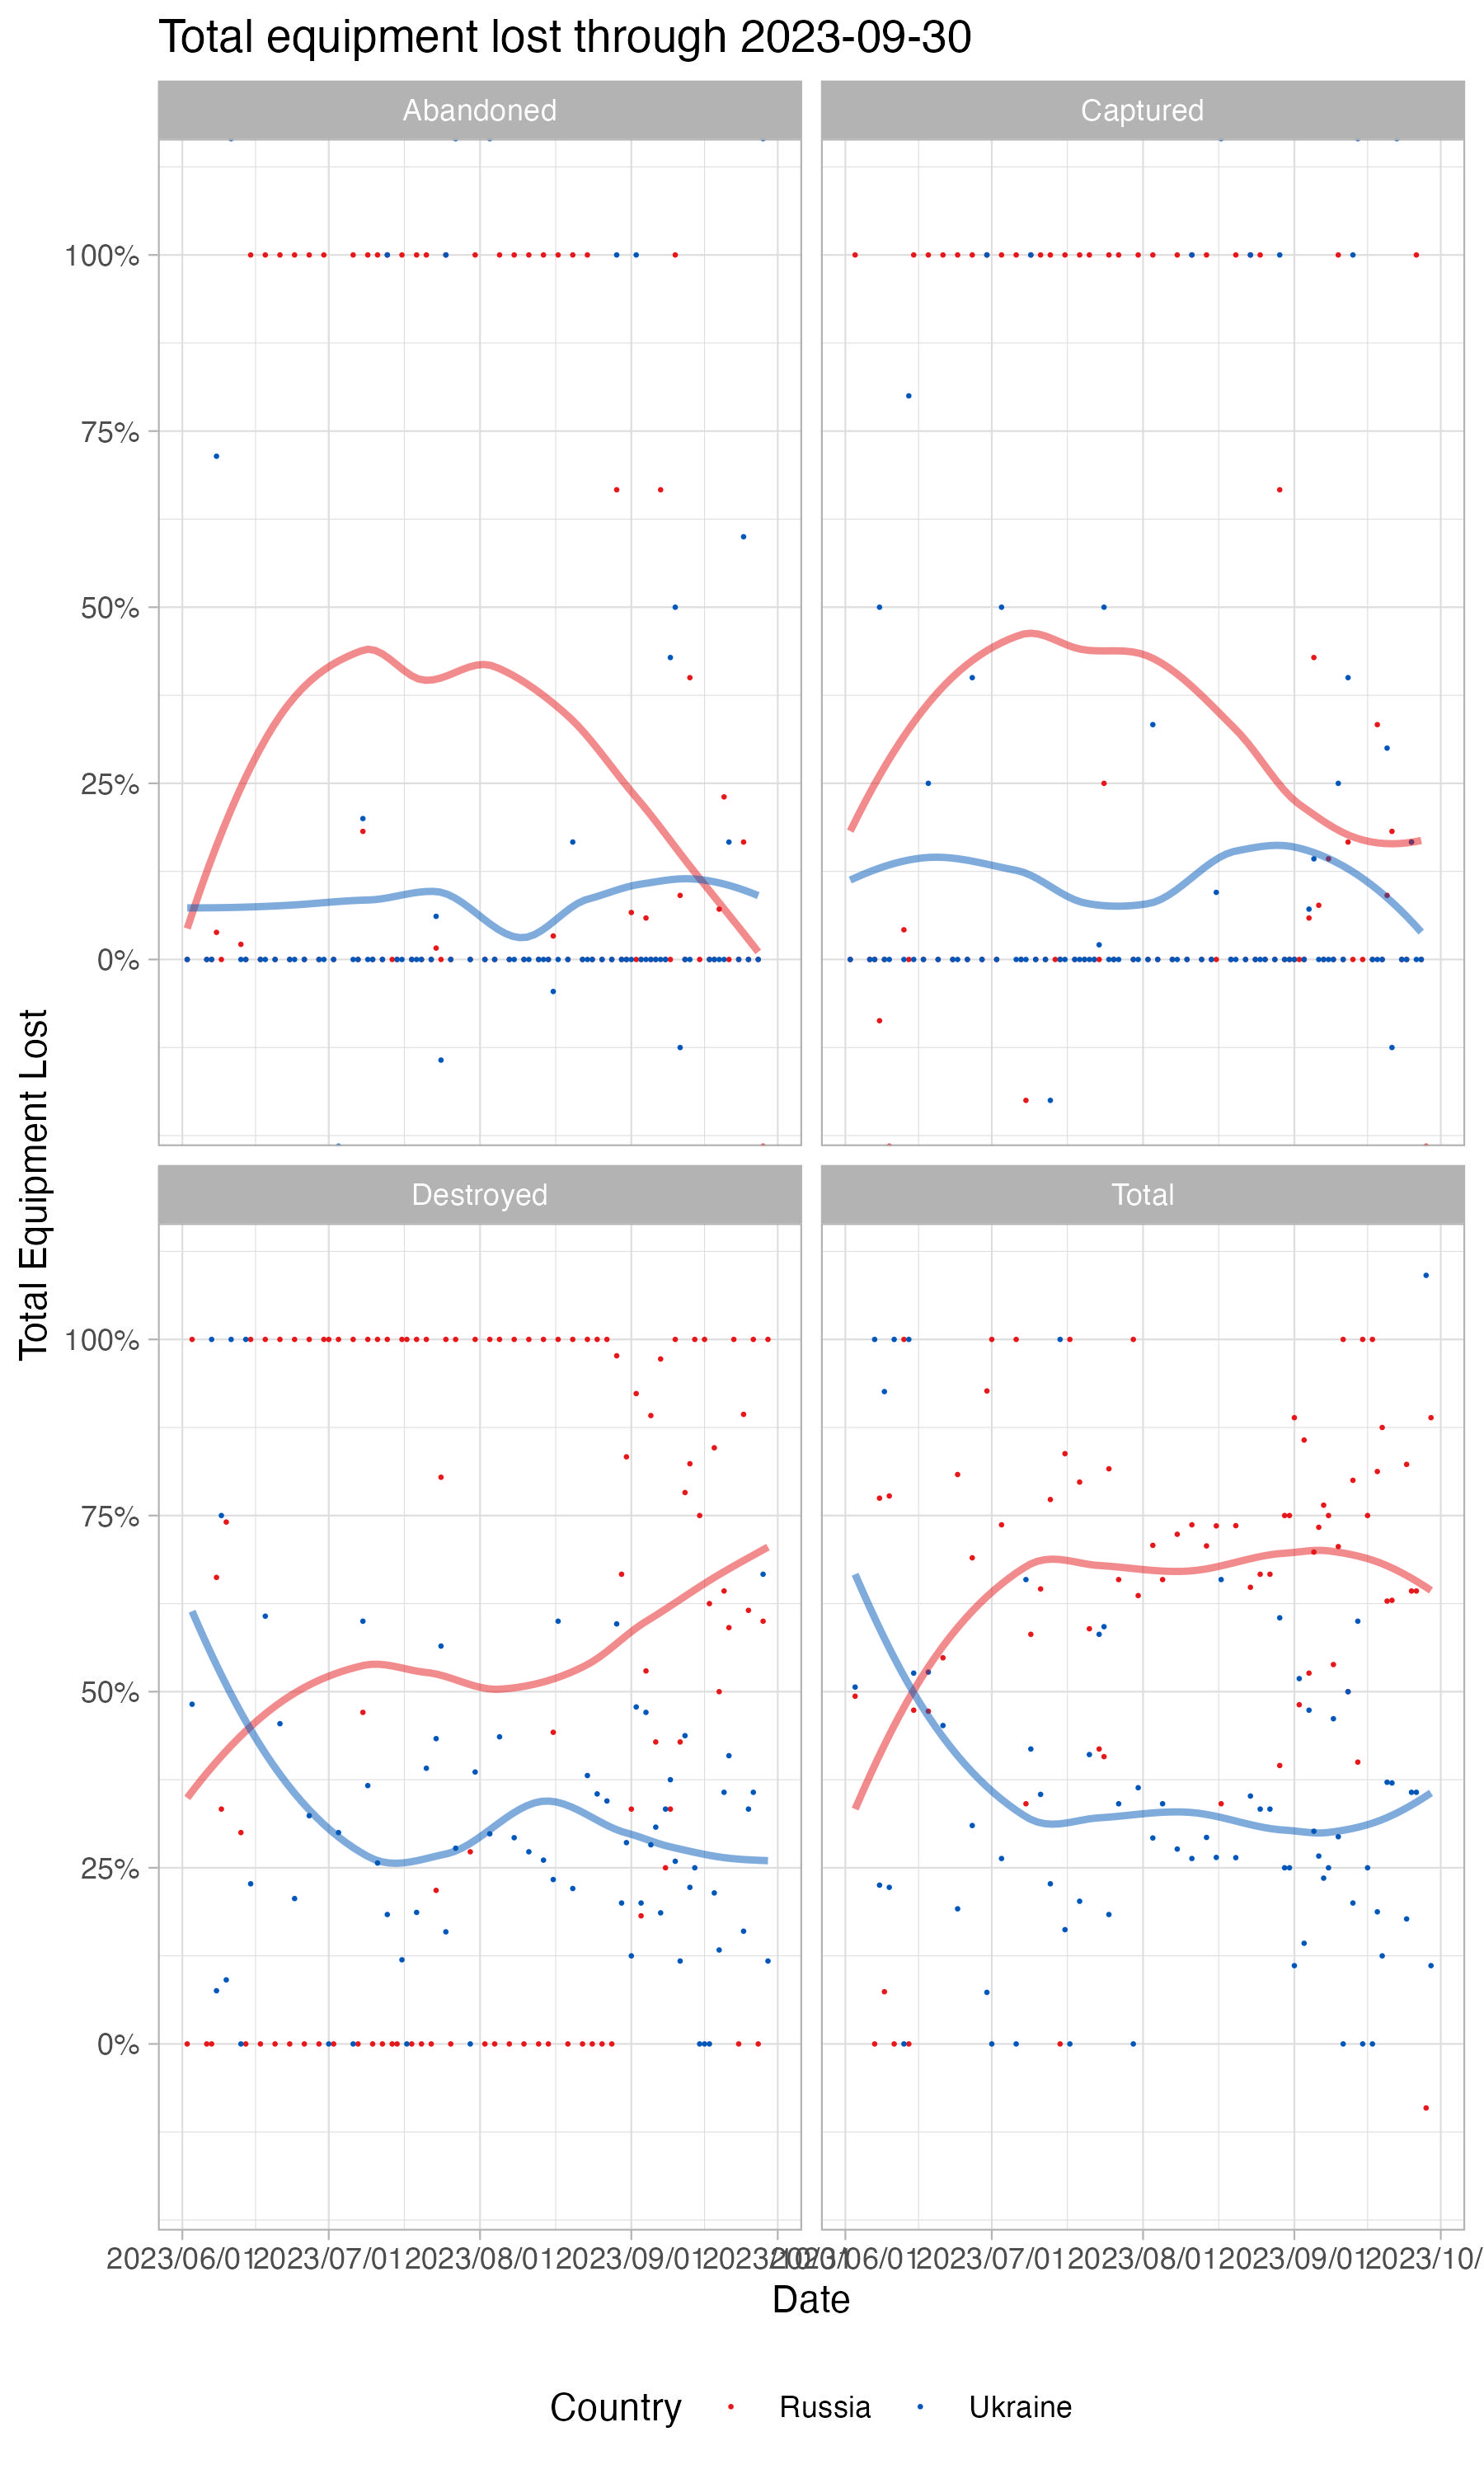 This plot shows the ratios of losses (e.g. proportion of total) for Russia and Ukraine for each loss type.
"Raw" refers to a specific type of vehicle, such as a tank or armored personnel carrier

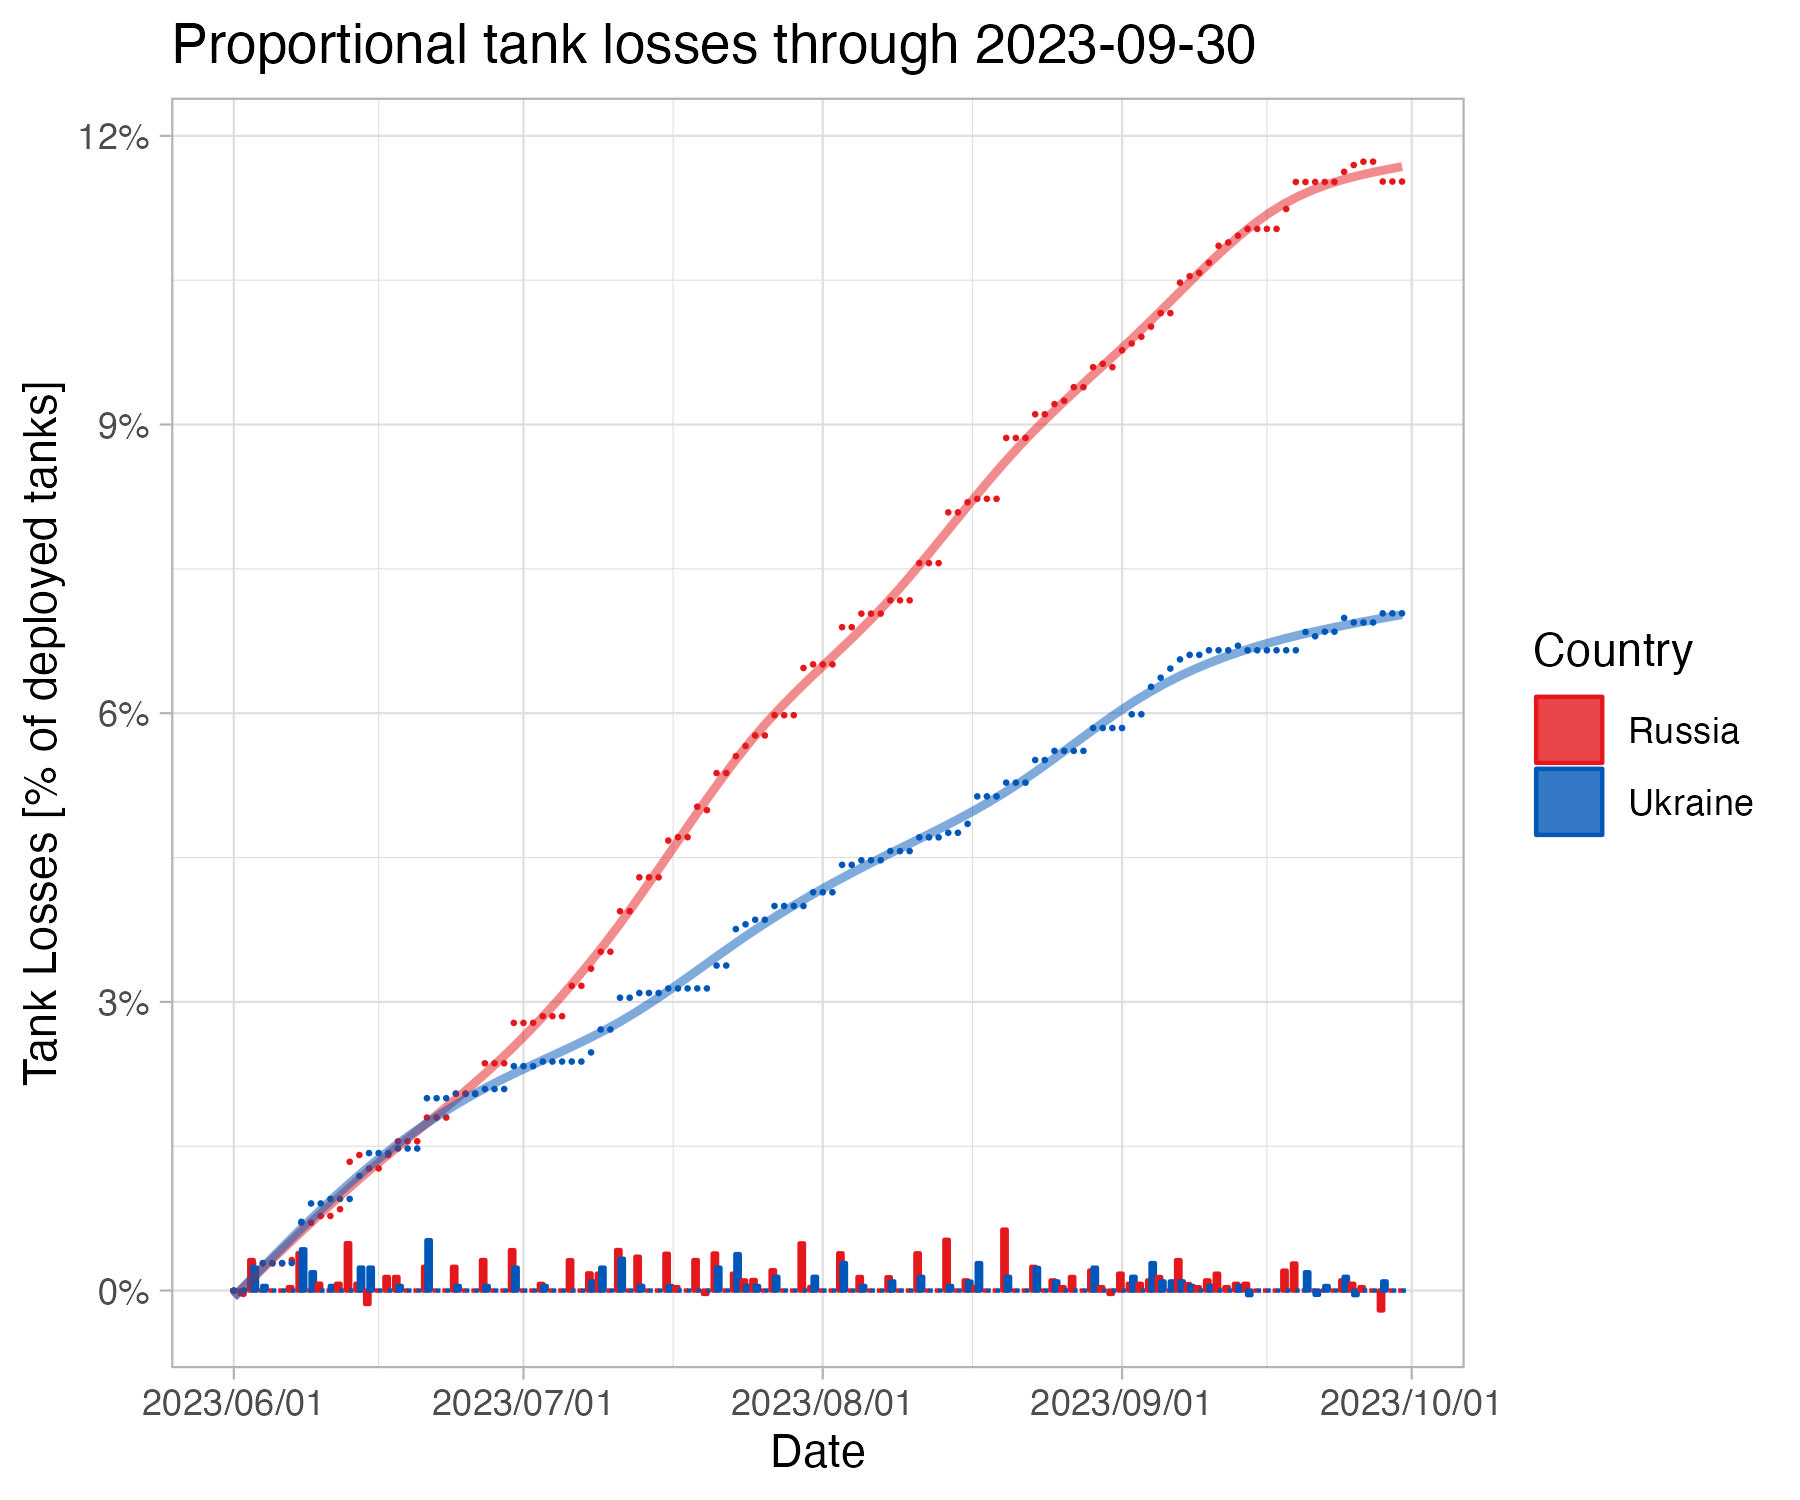
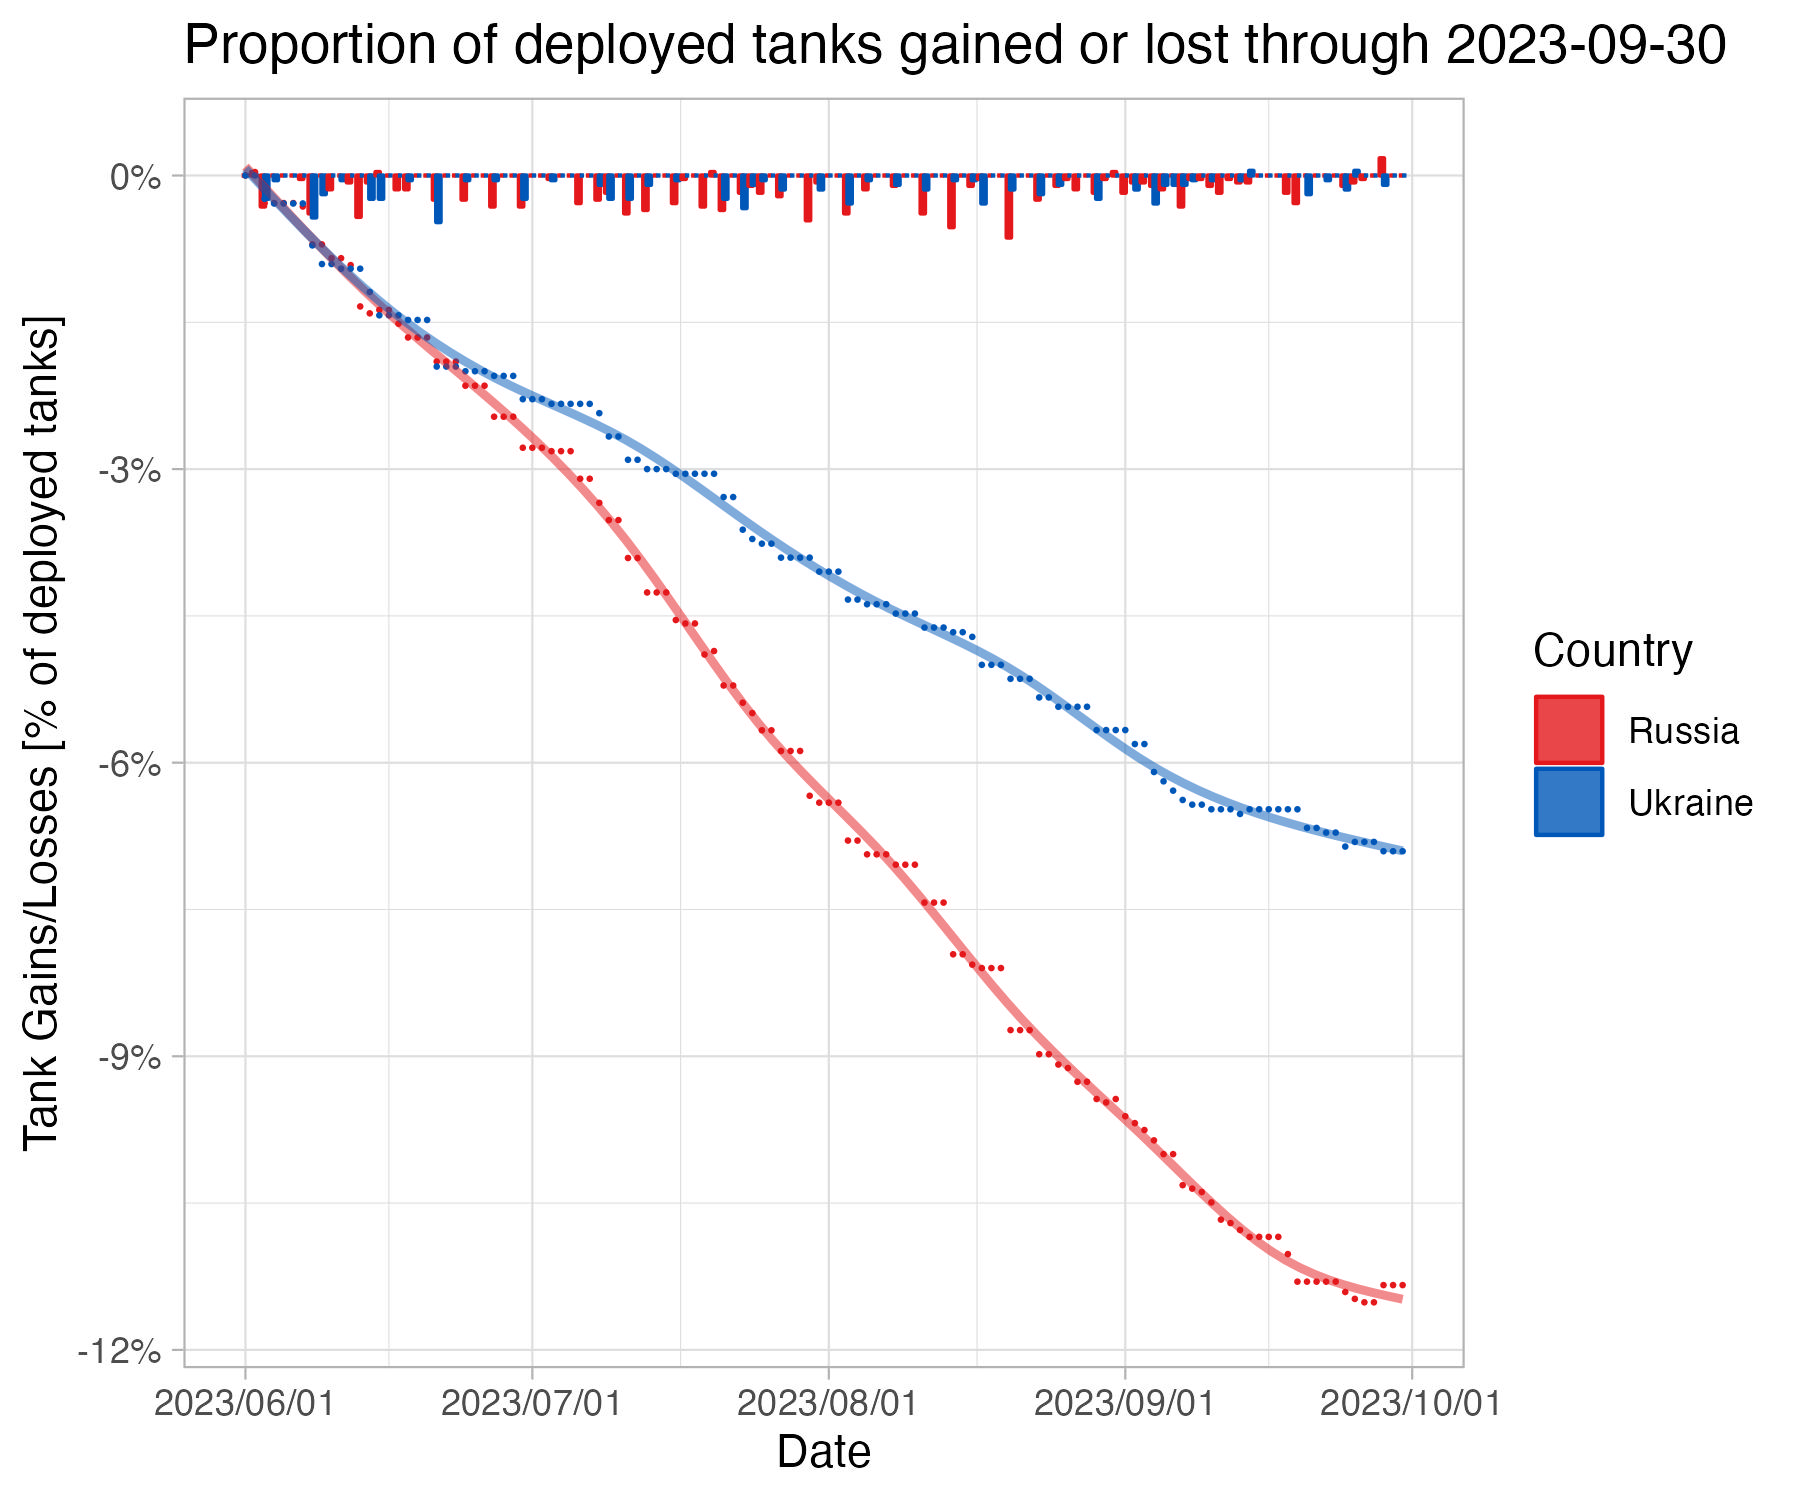
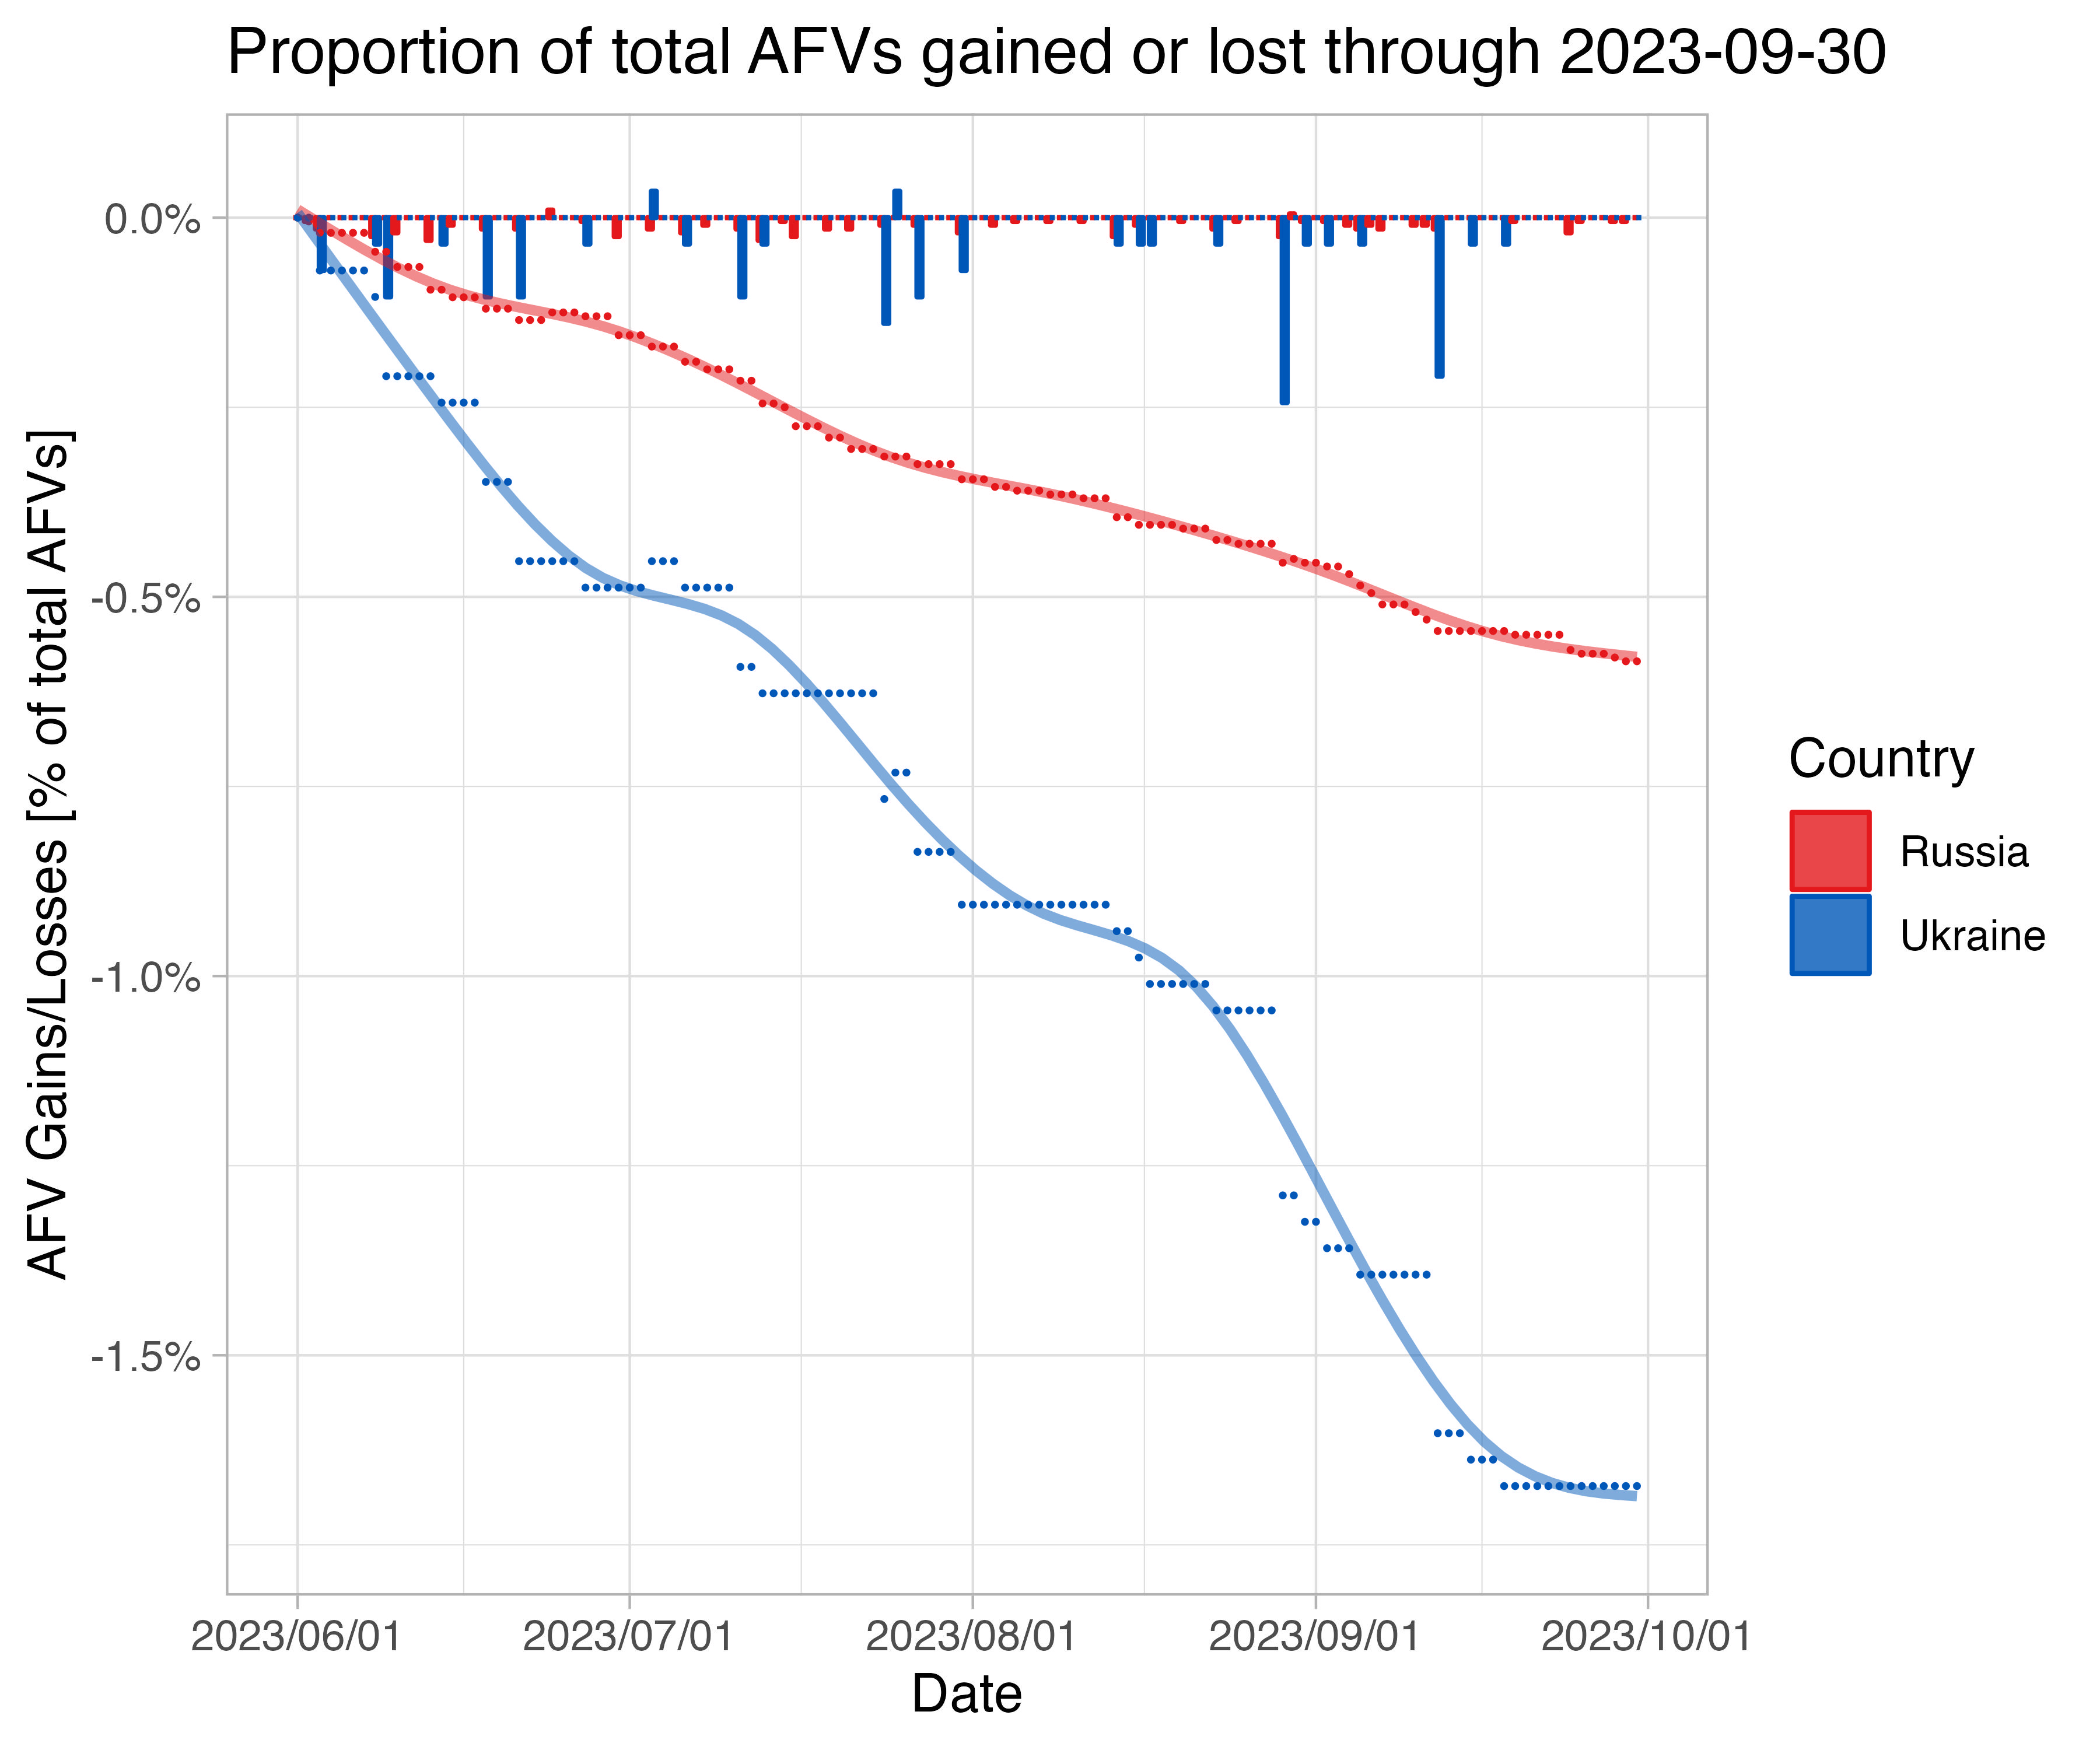 If we consider estimates of deployed Russian AFV fixed to their total inventory, Ukraine is adding modestly to its AFV inventory at the same rate which Russia is losing its AFV.
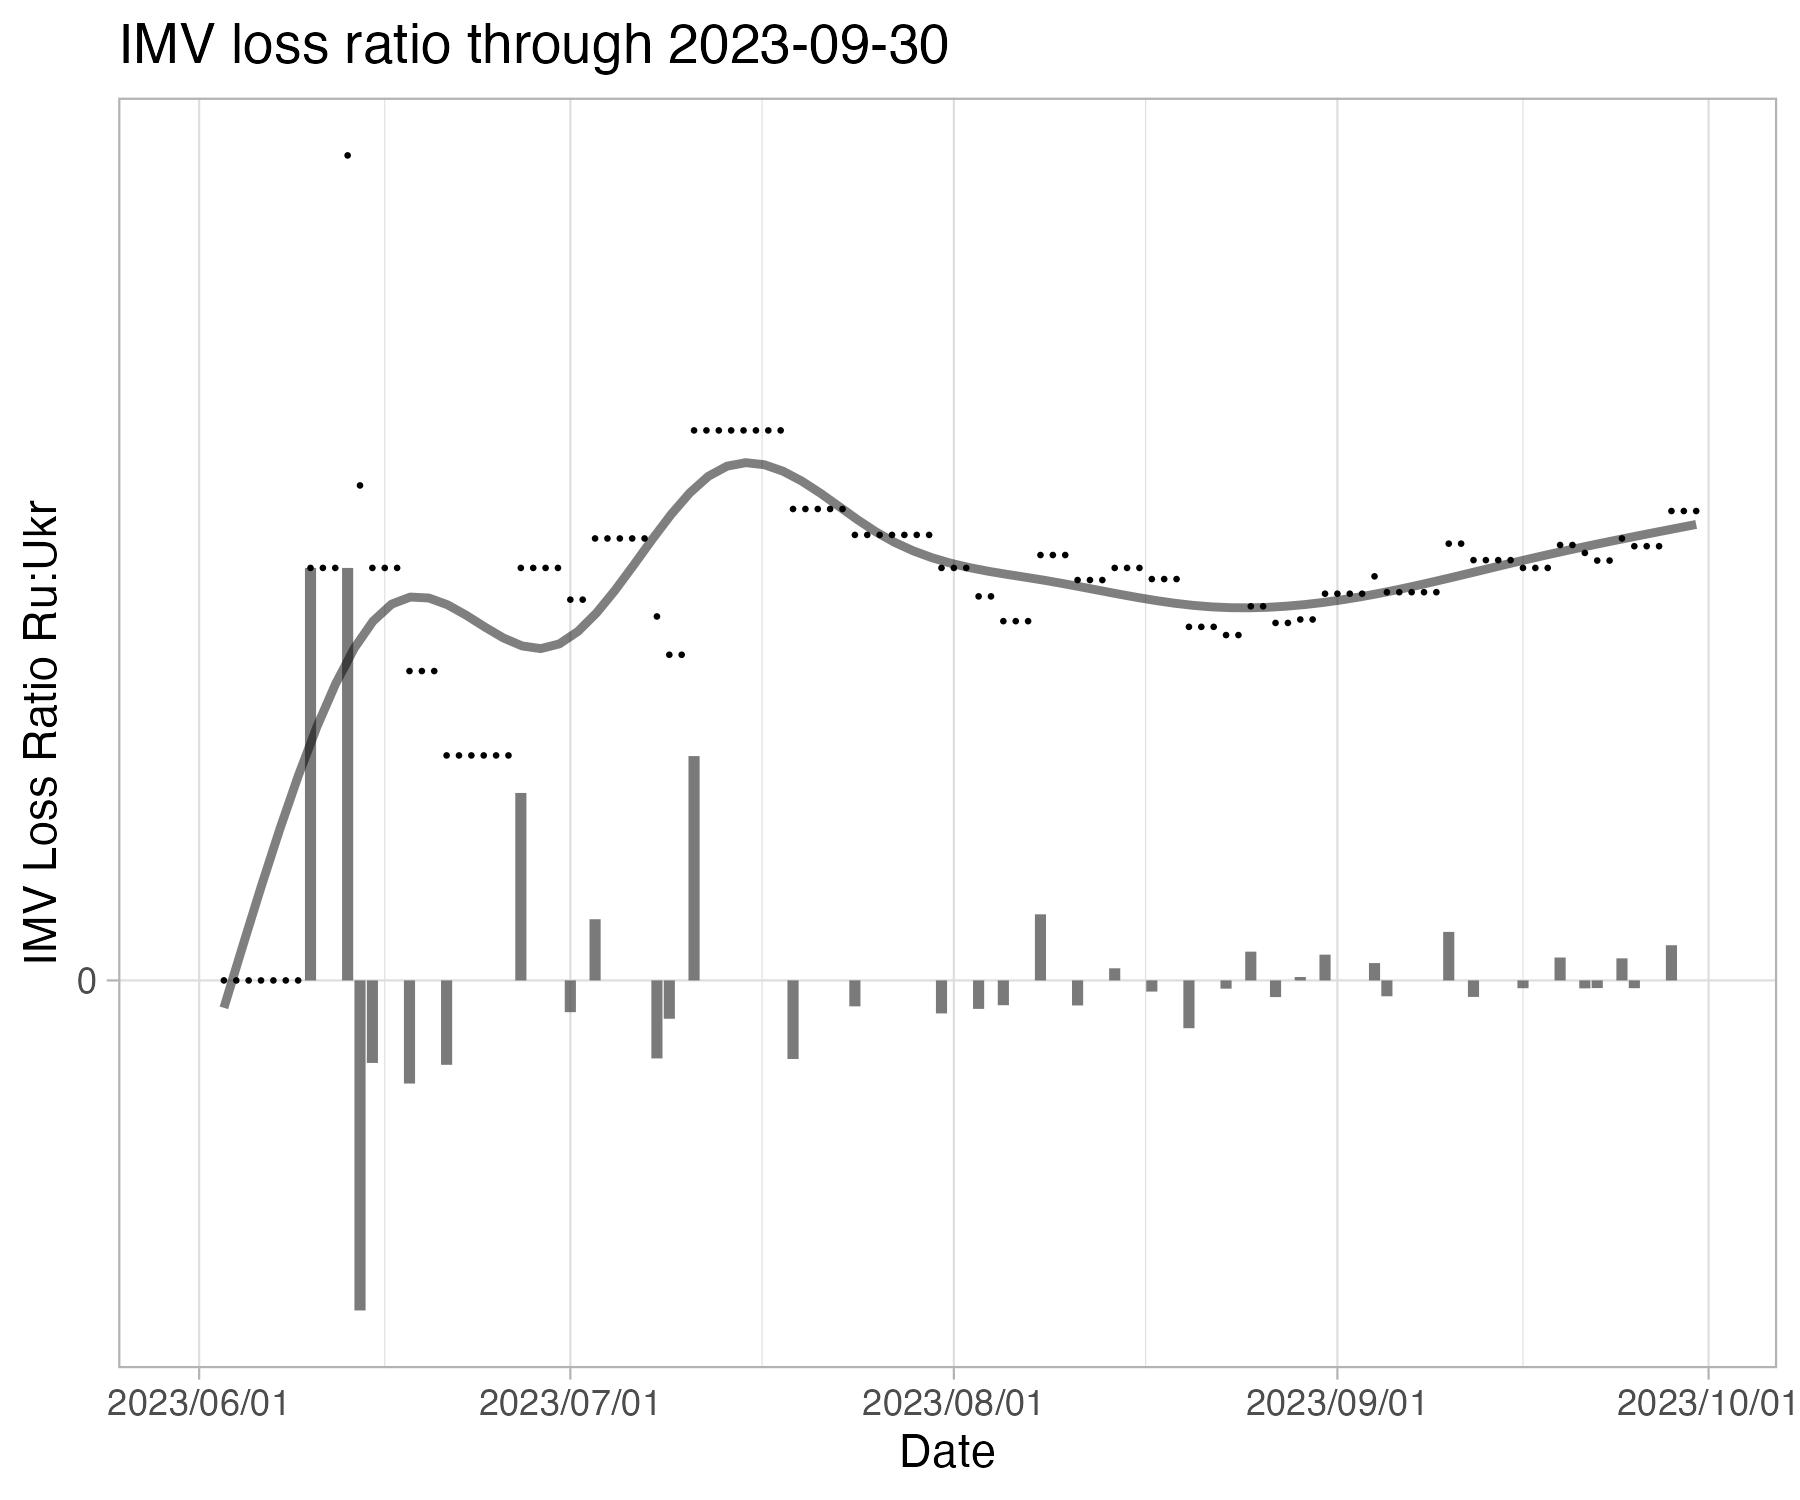
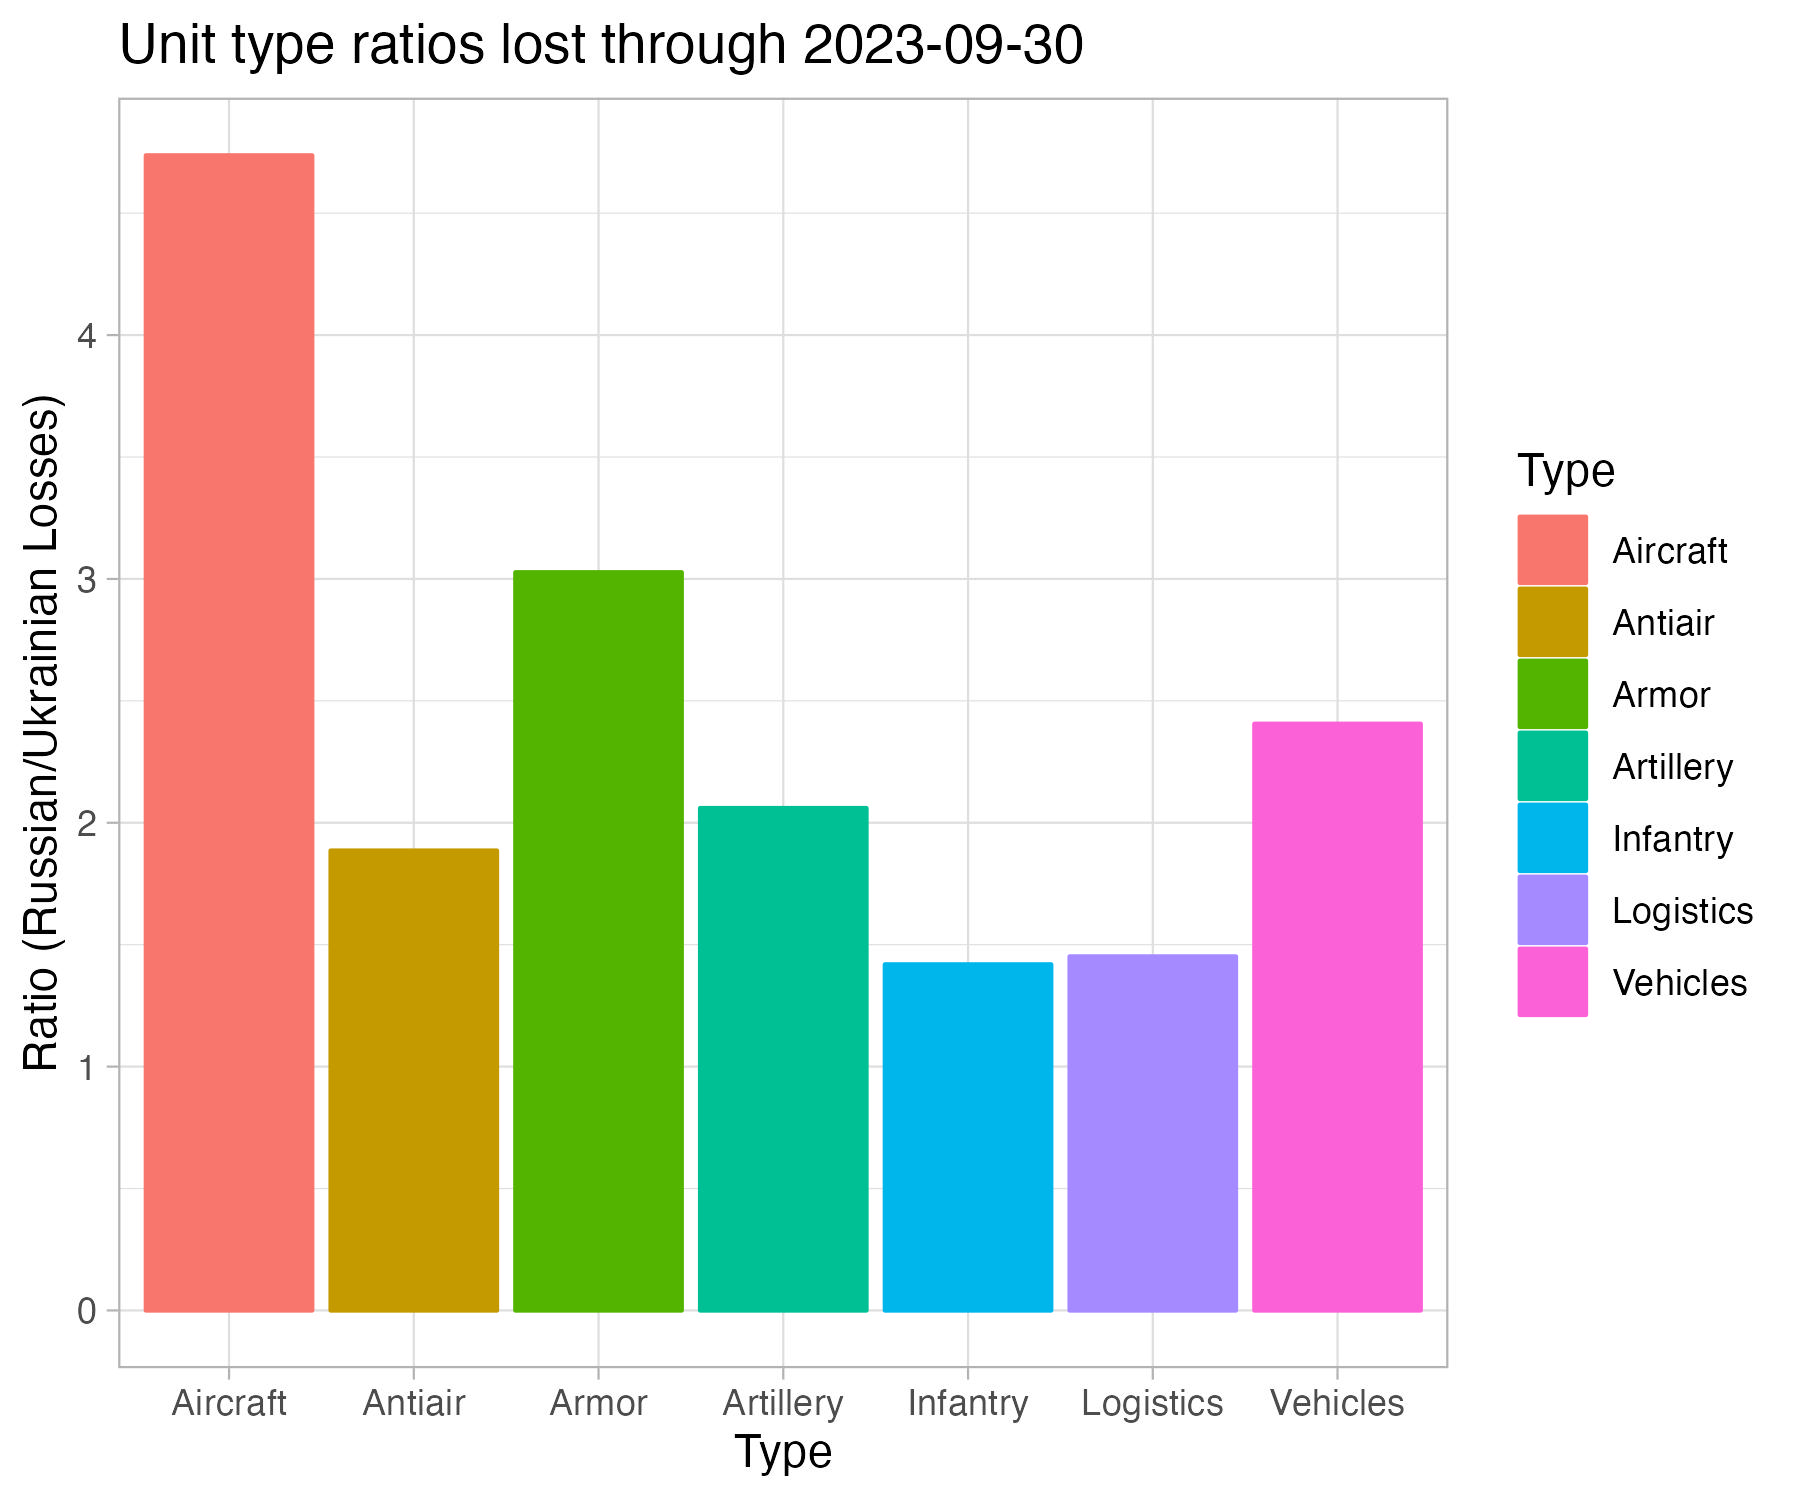
"Synthetic" refers to a combination of vehicle types to form a theme - such as aircraft (fighters + helicopters + drones) or anti-aircraft (SAM + MANPADS), etc.
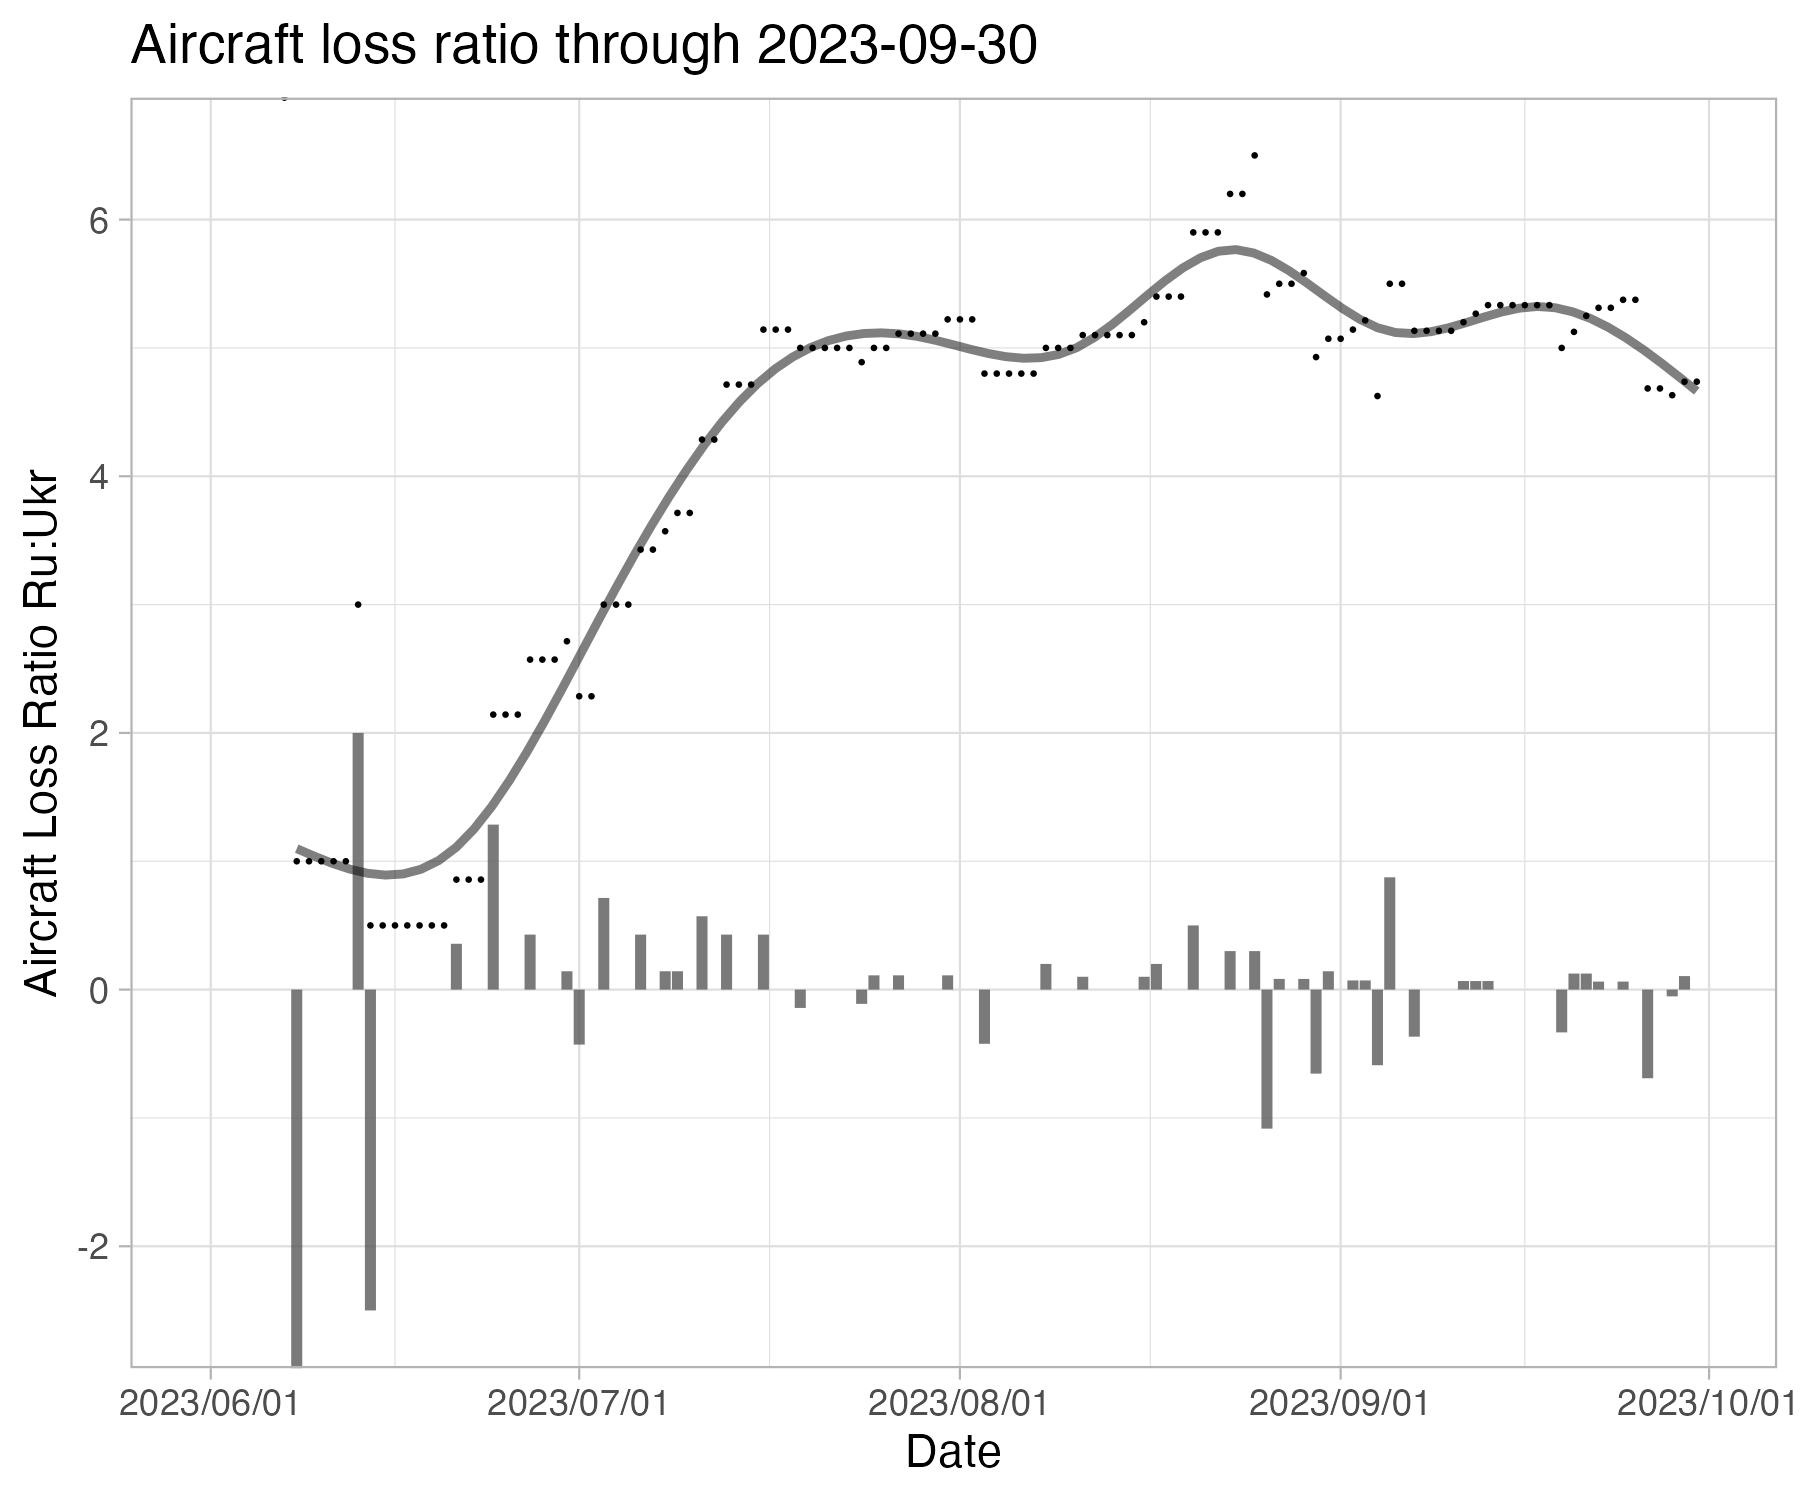
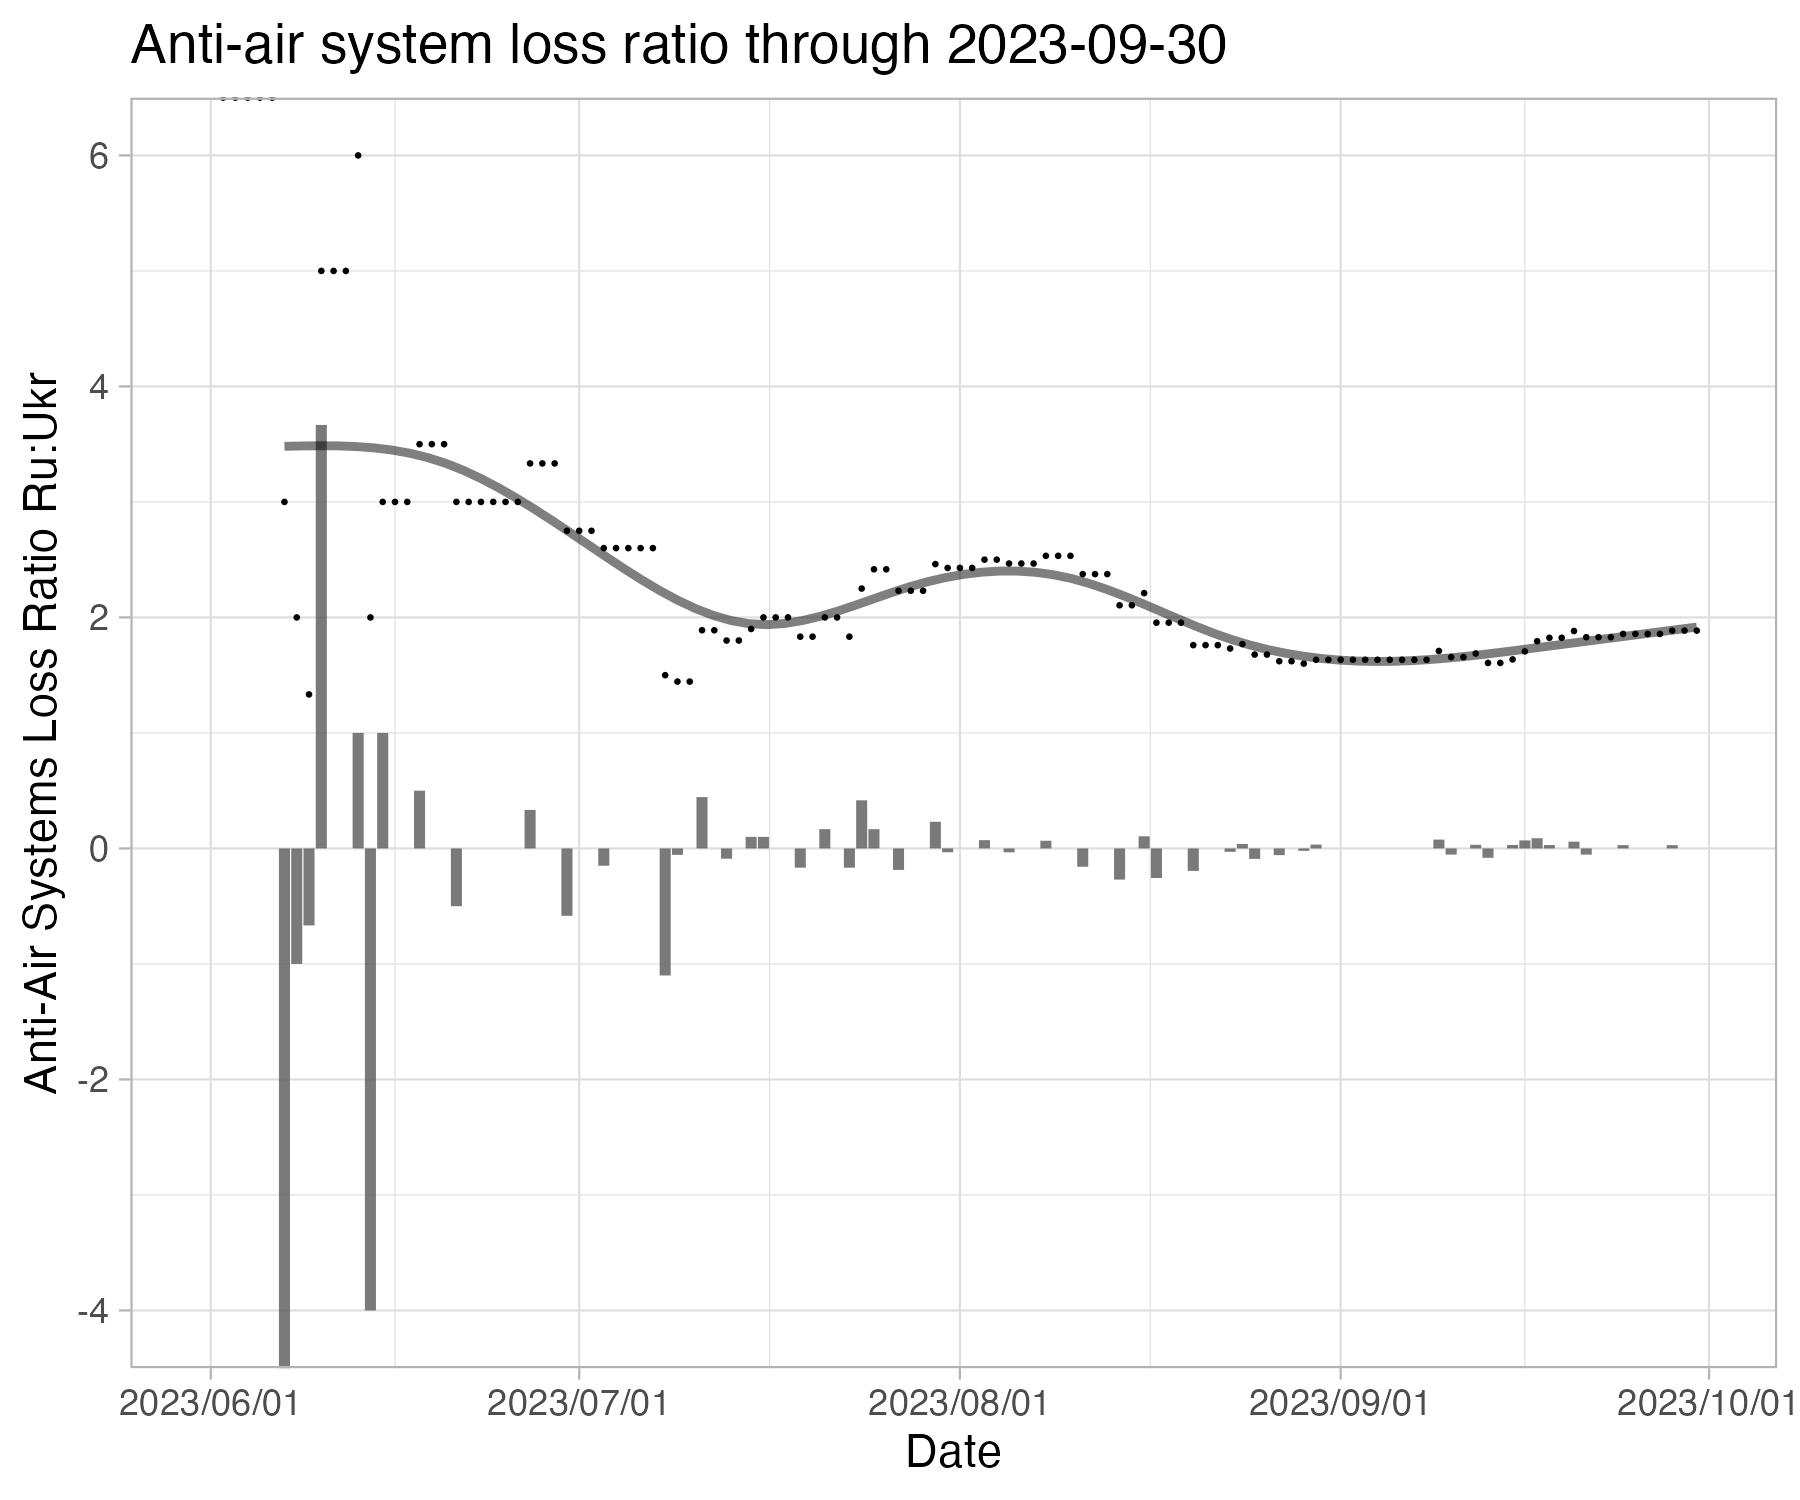
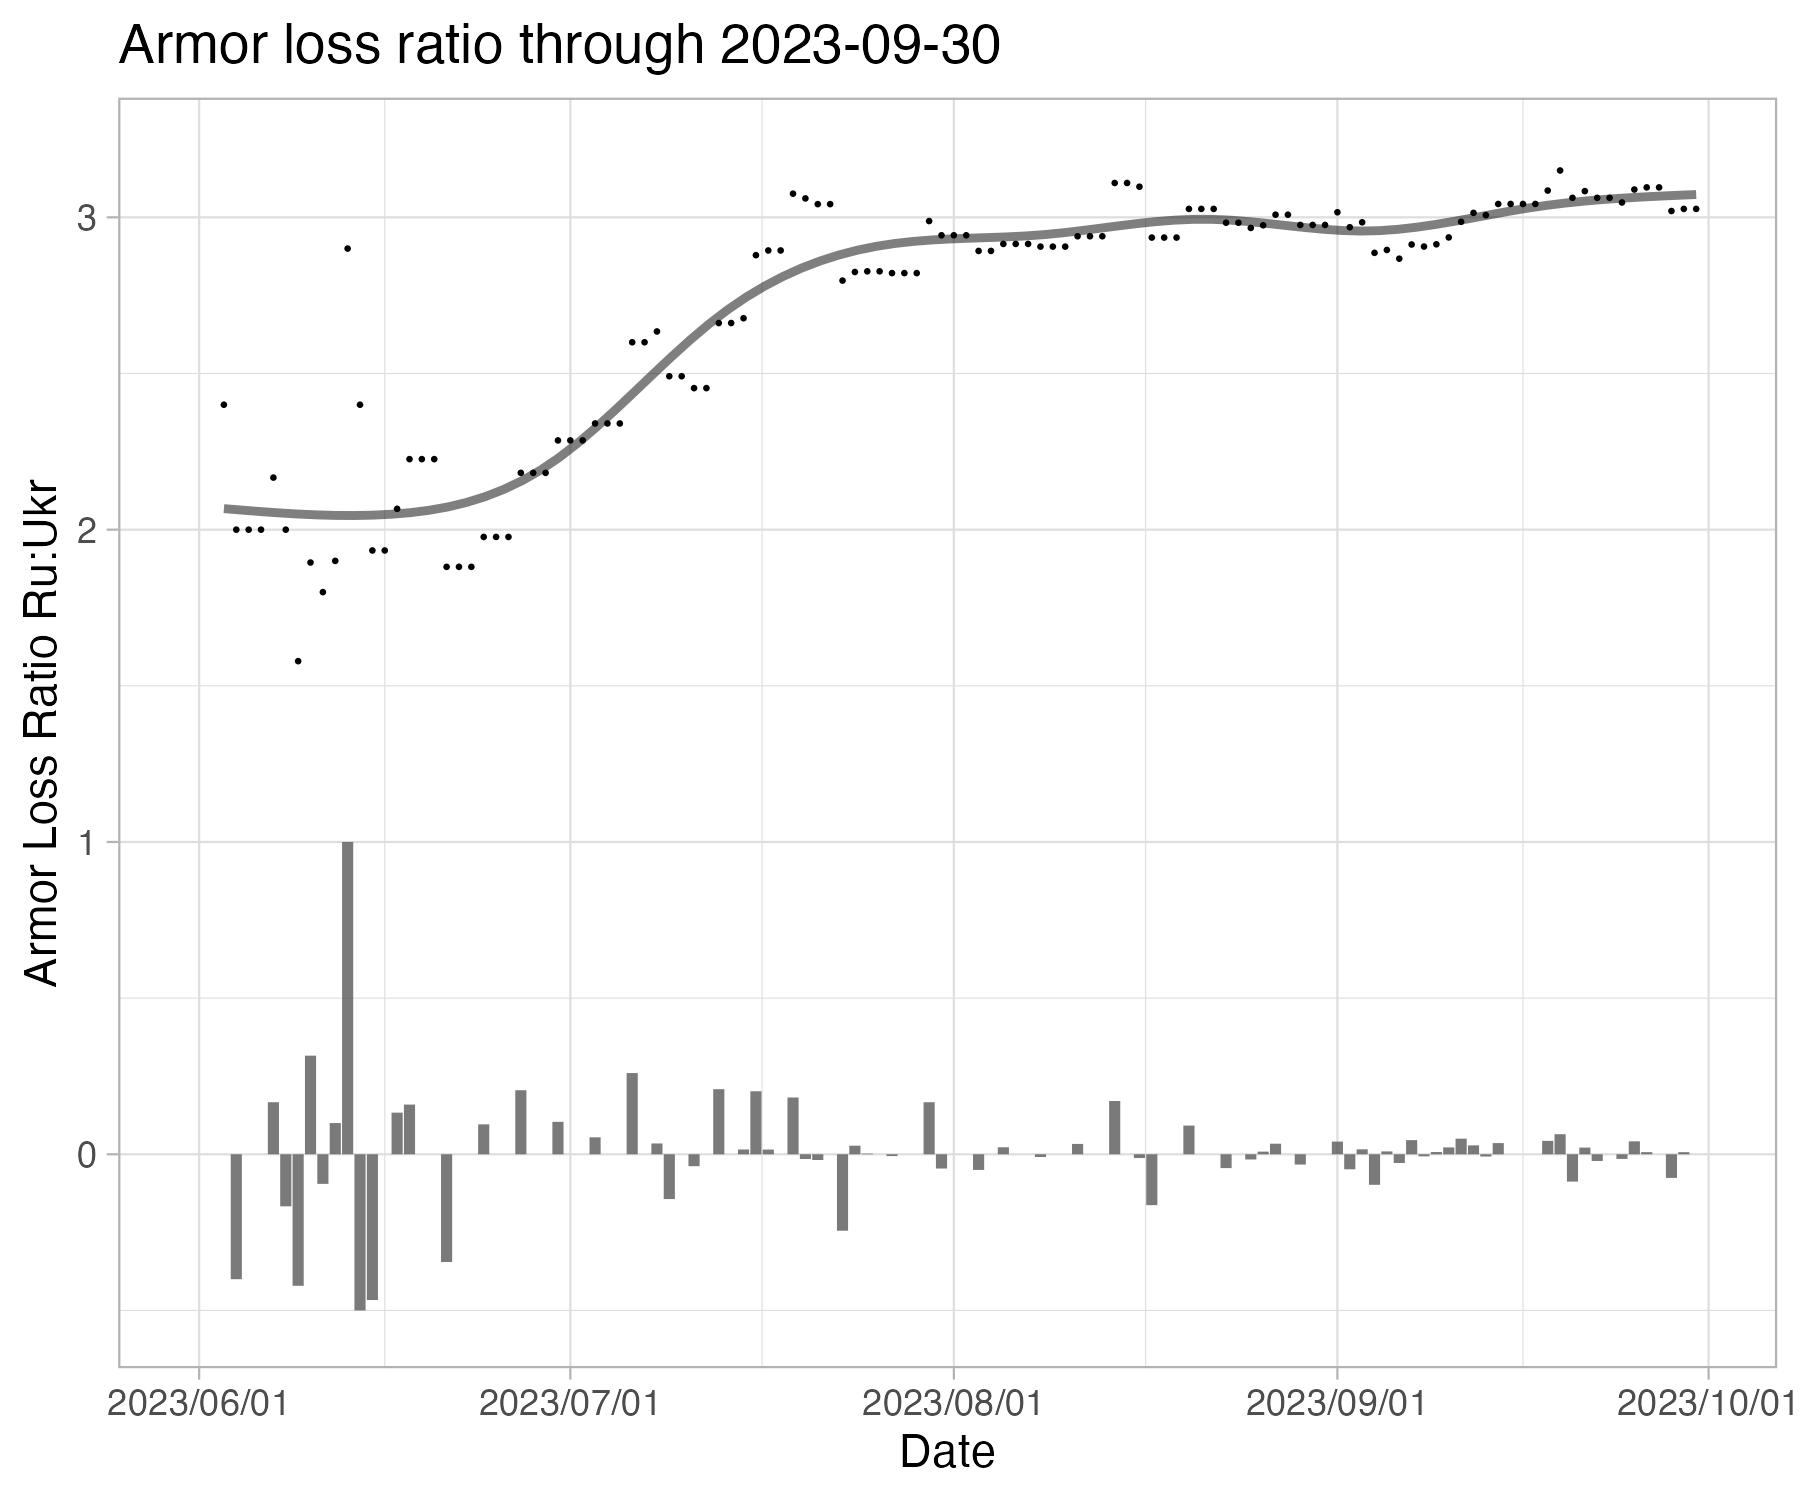
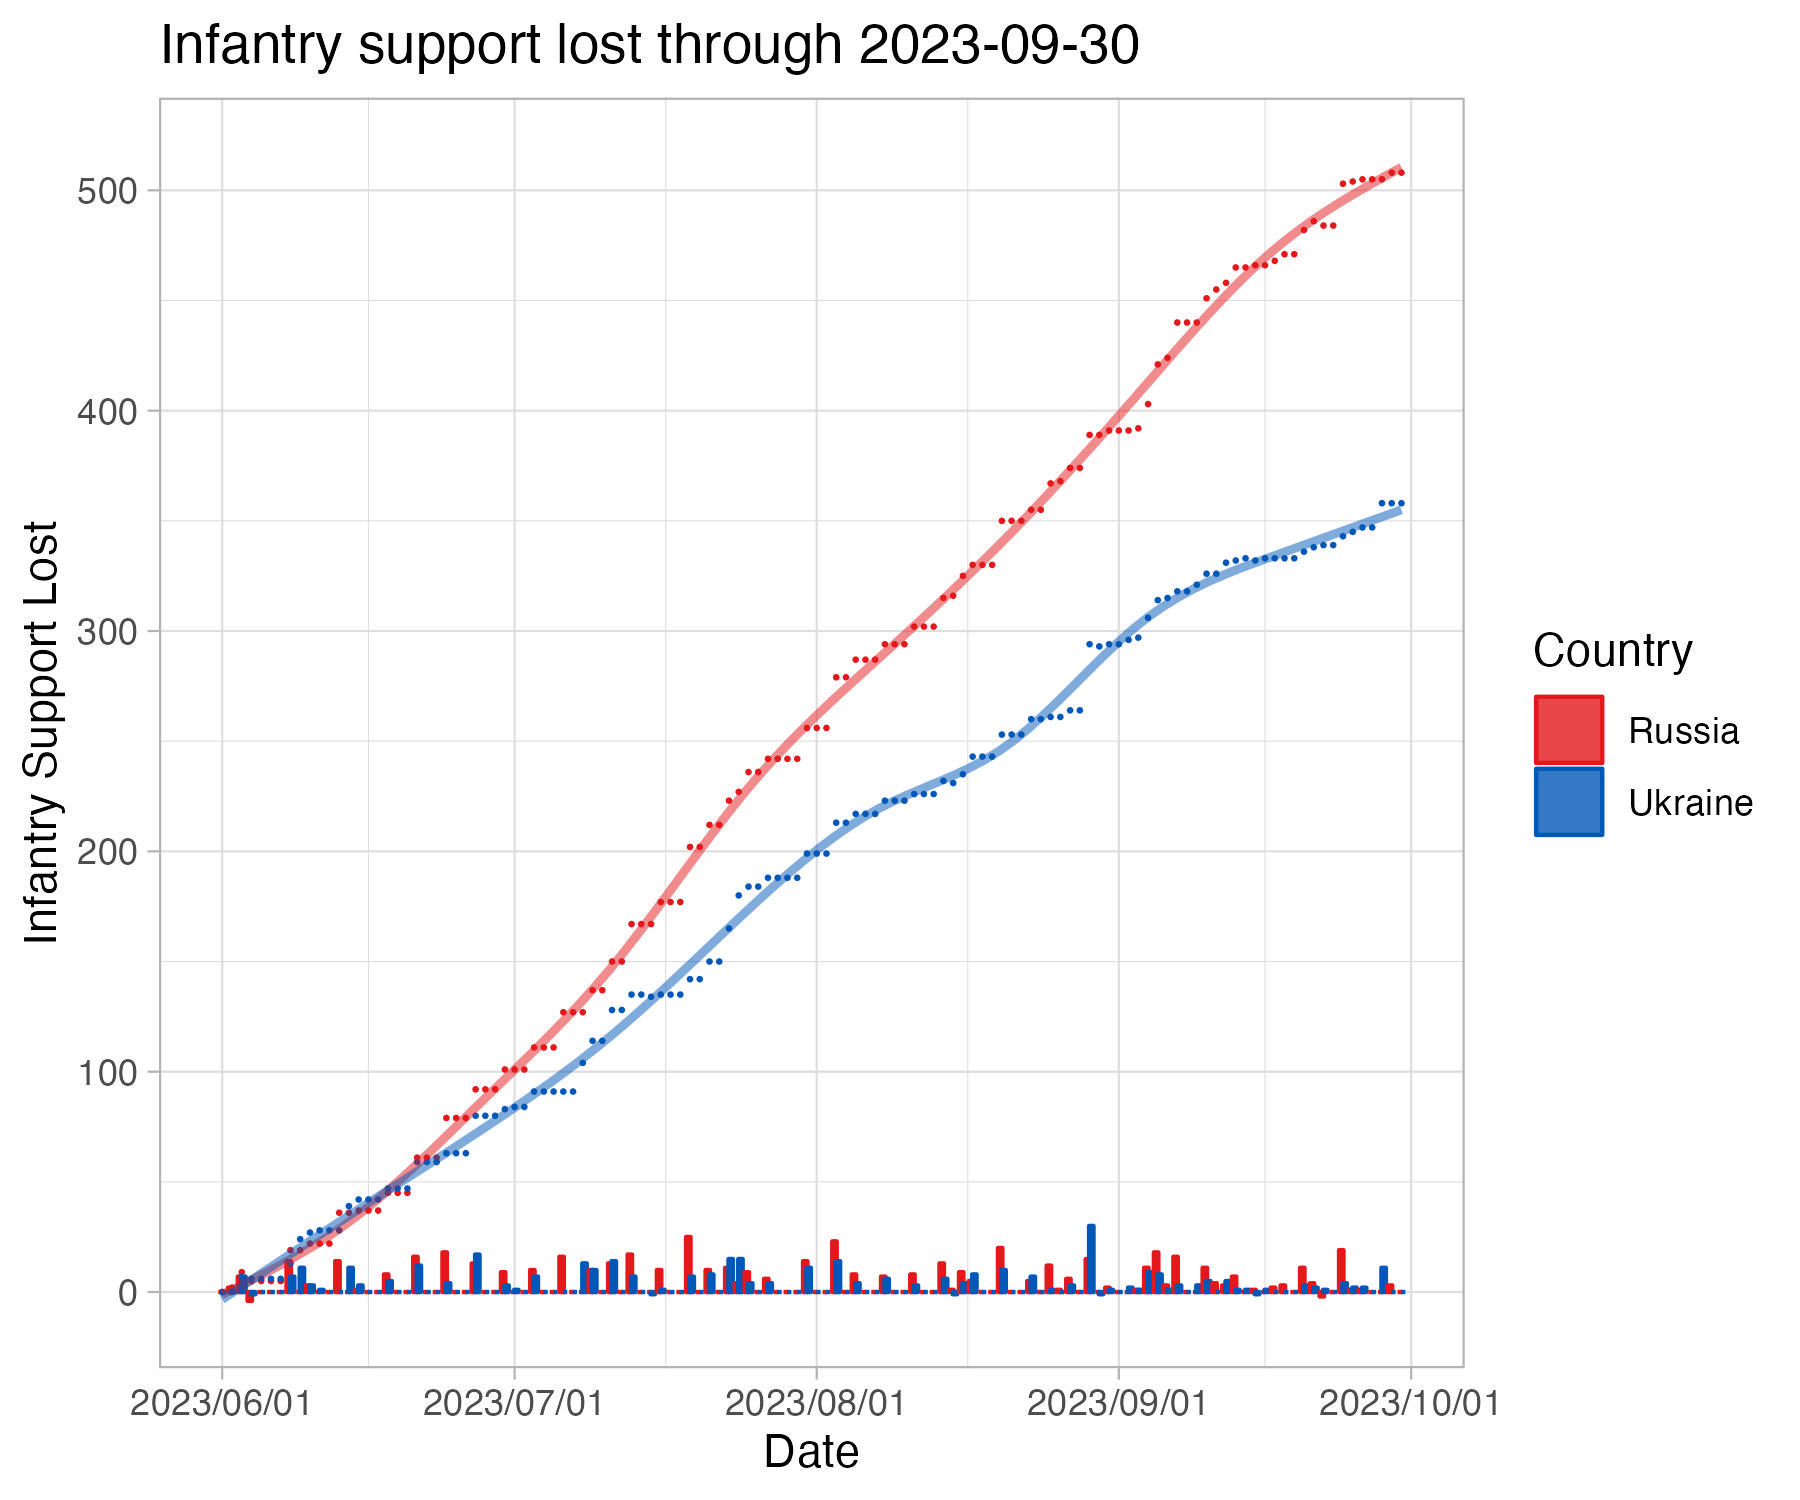
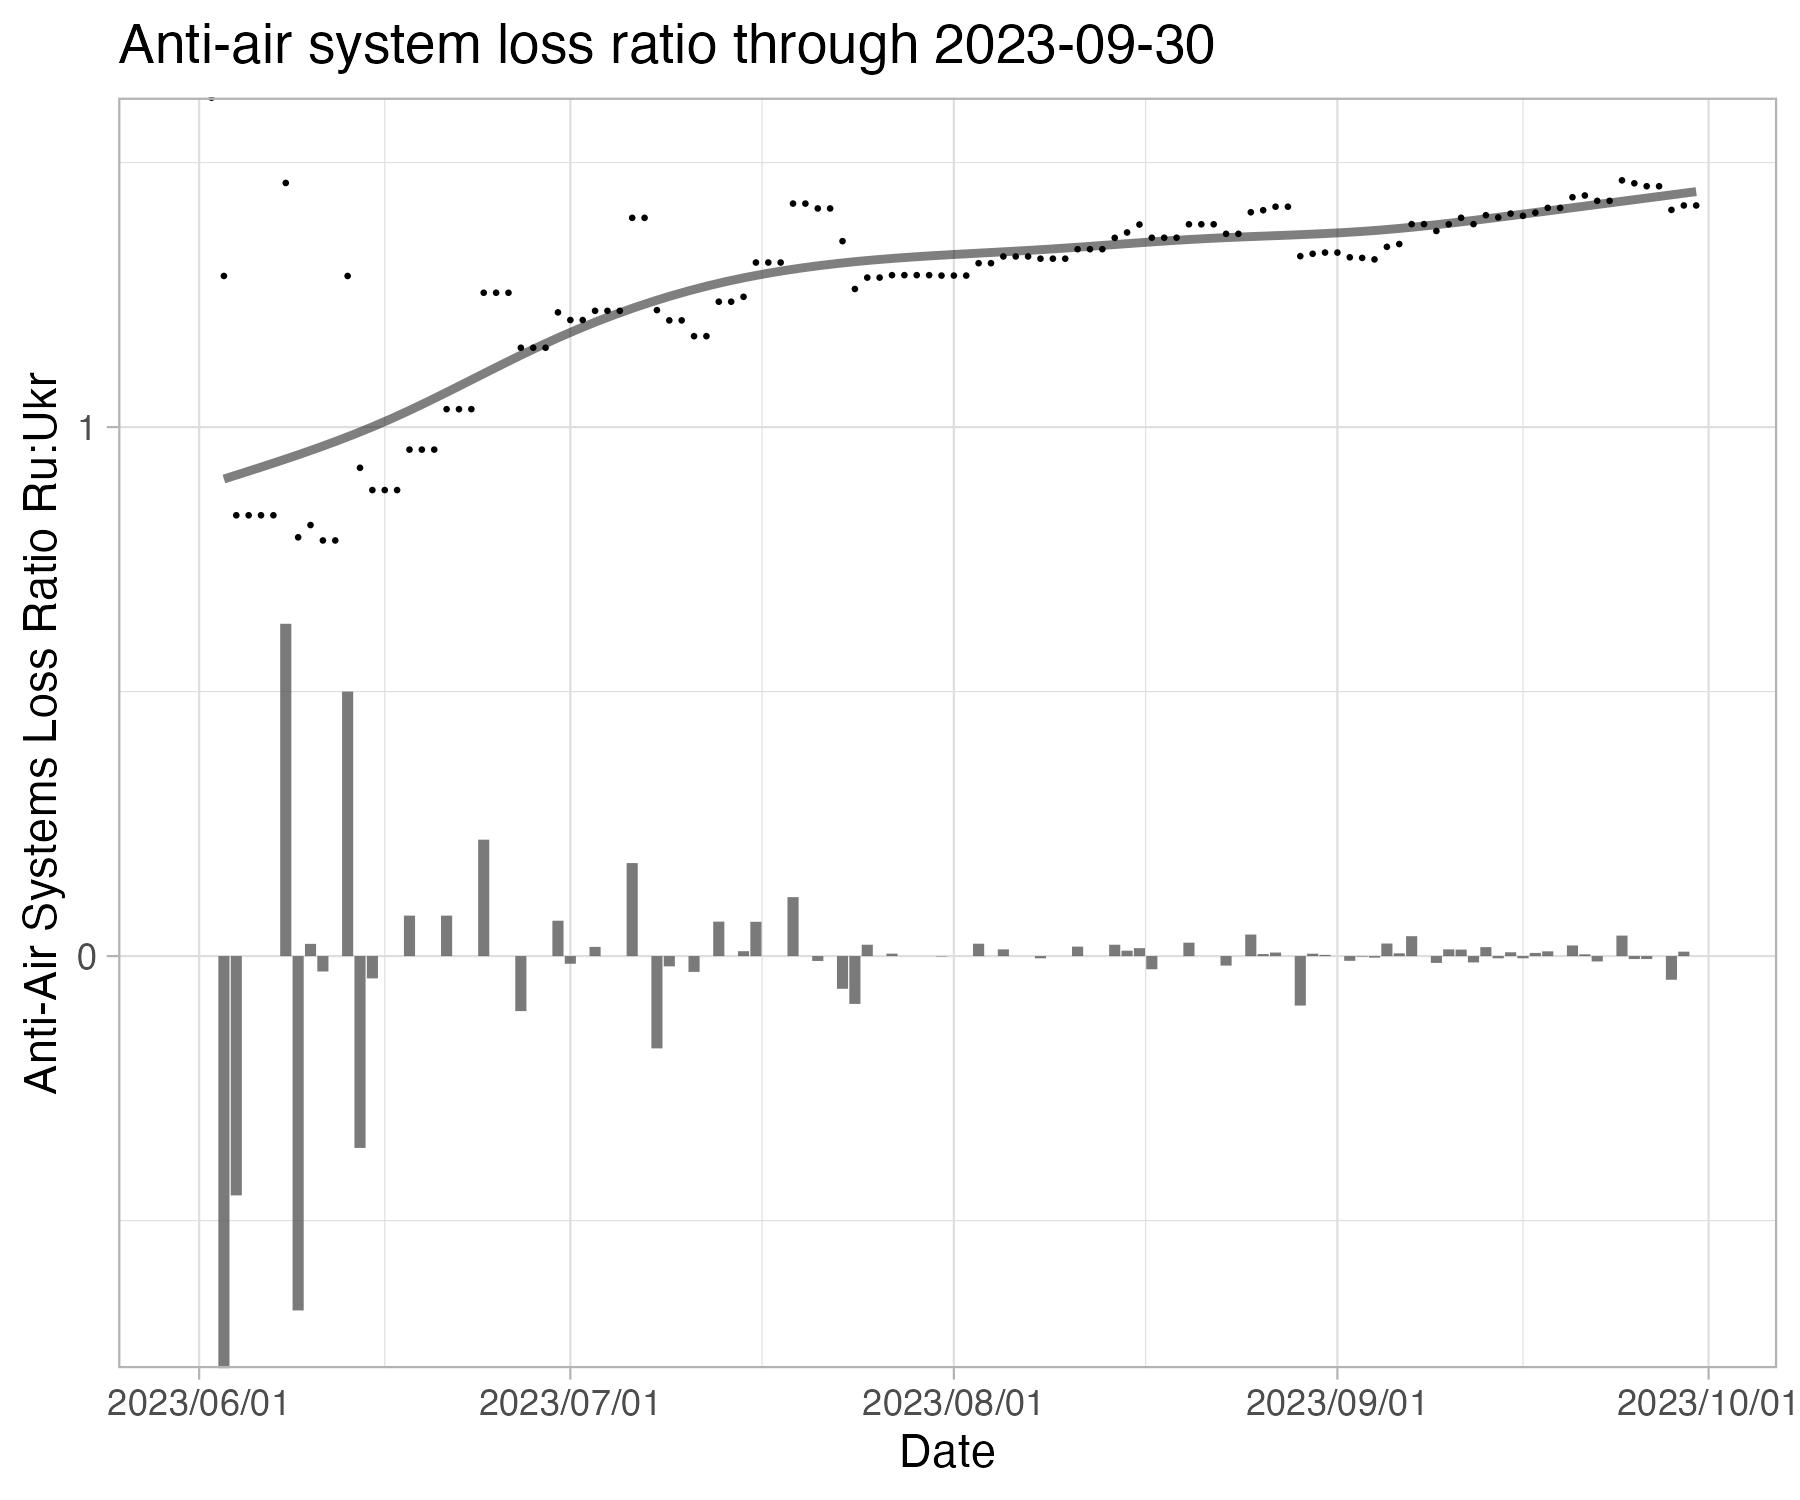
#Analysis By grouping synthetic vehicles, we can see how different systems have been prioritized by Russia or Ukraine, providing a glimpse into strategy.
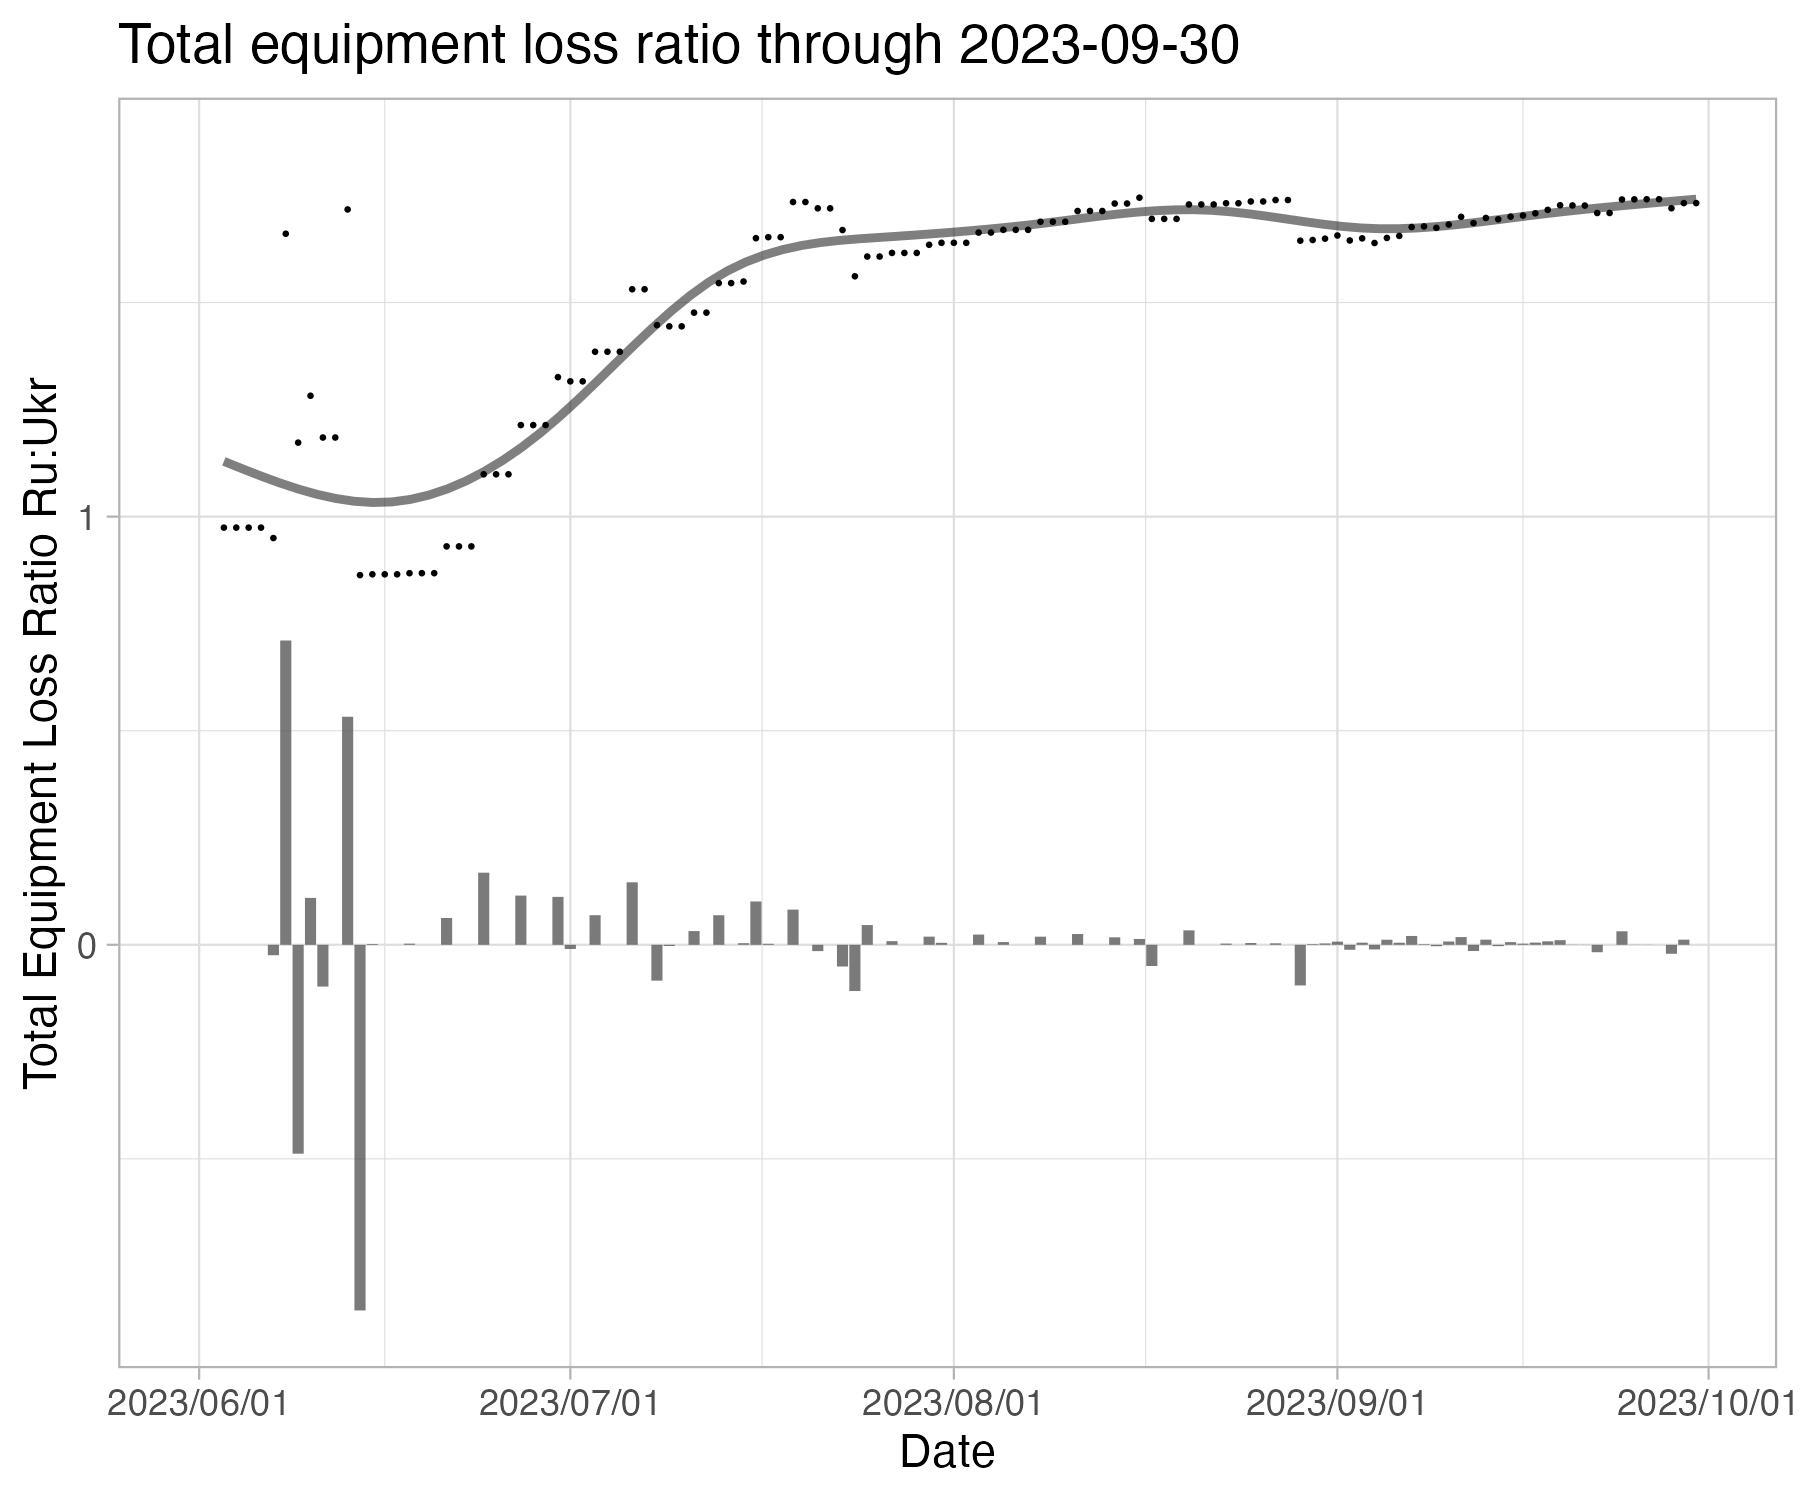
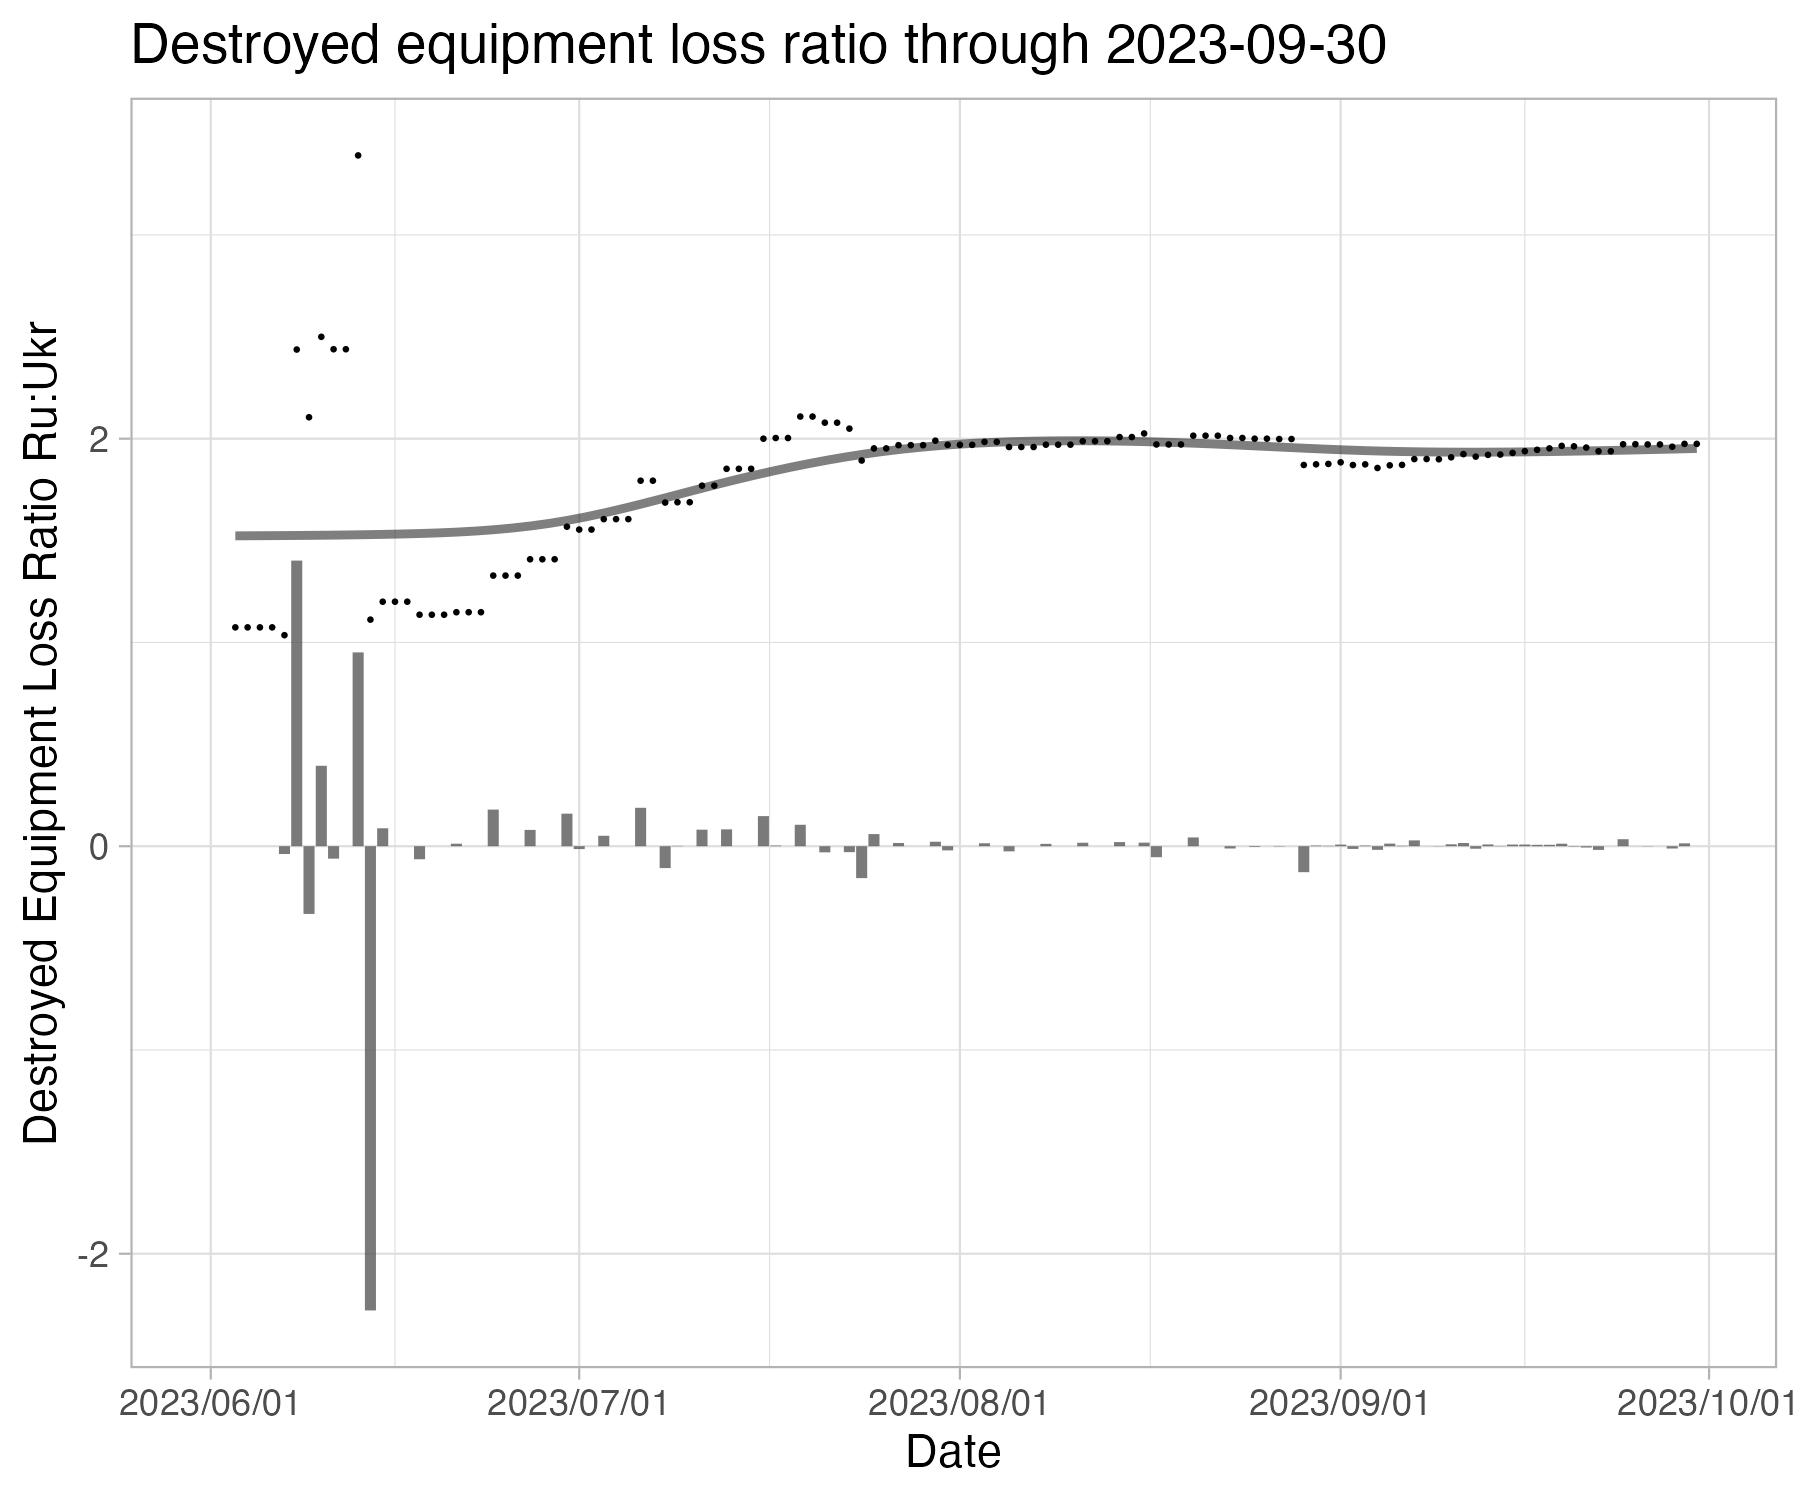
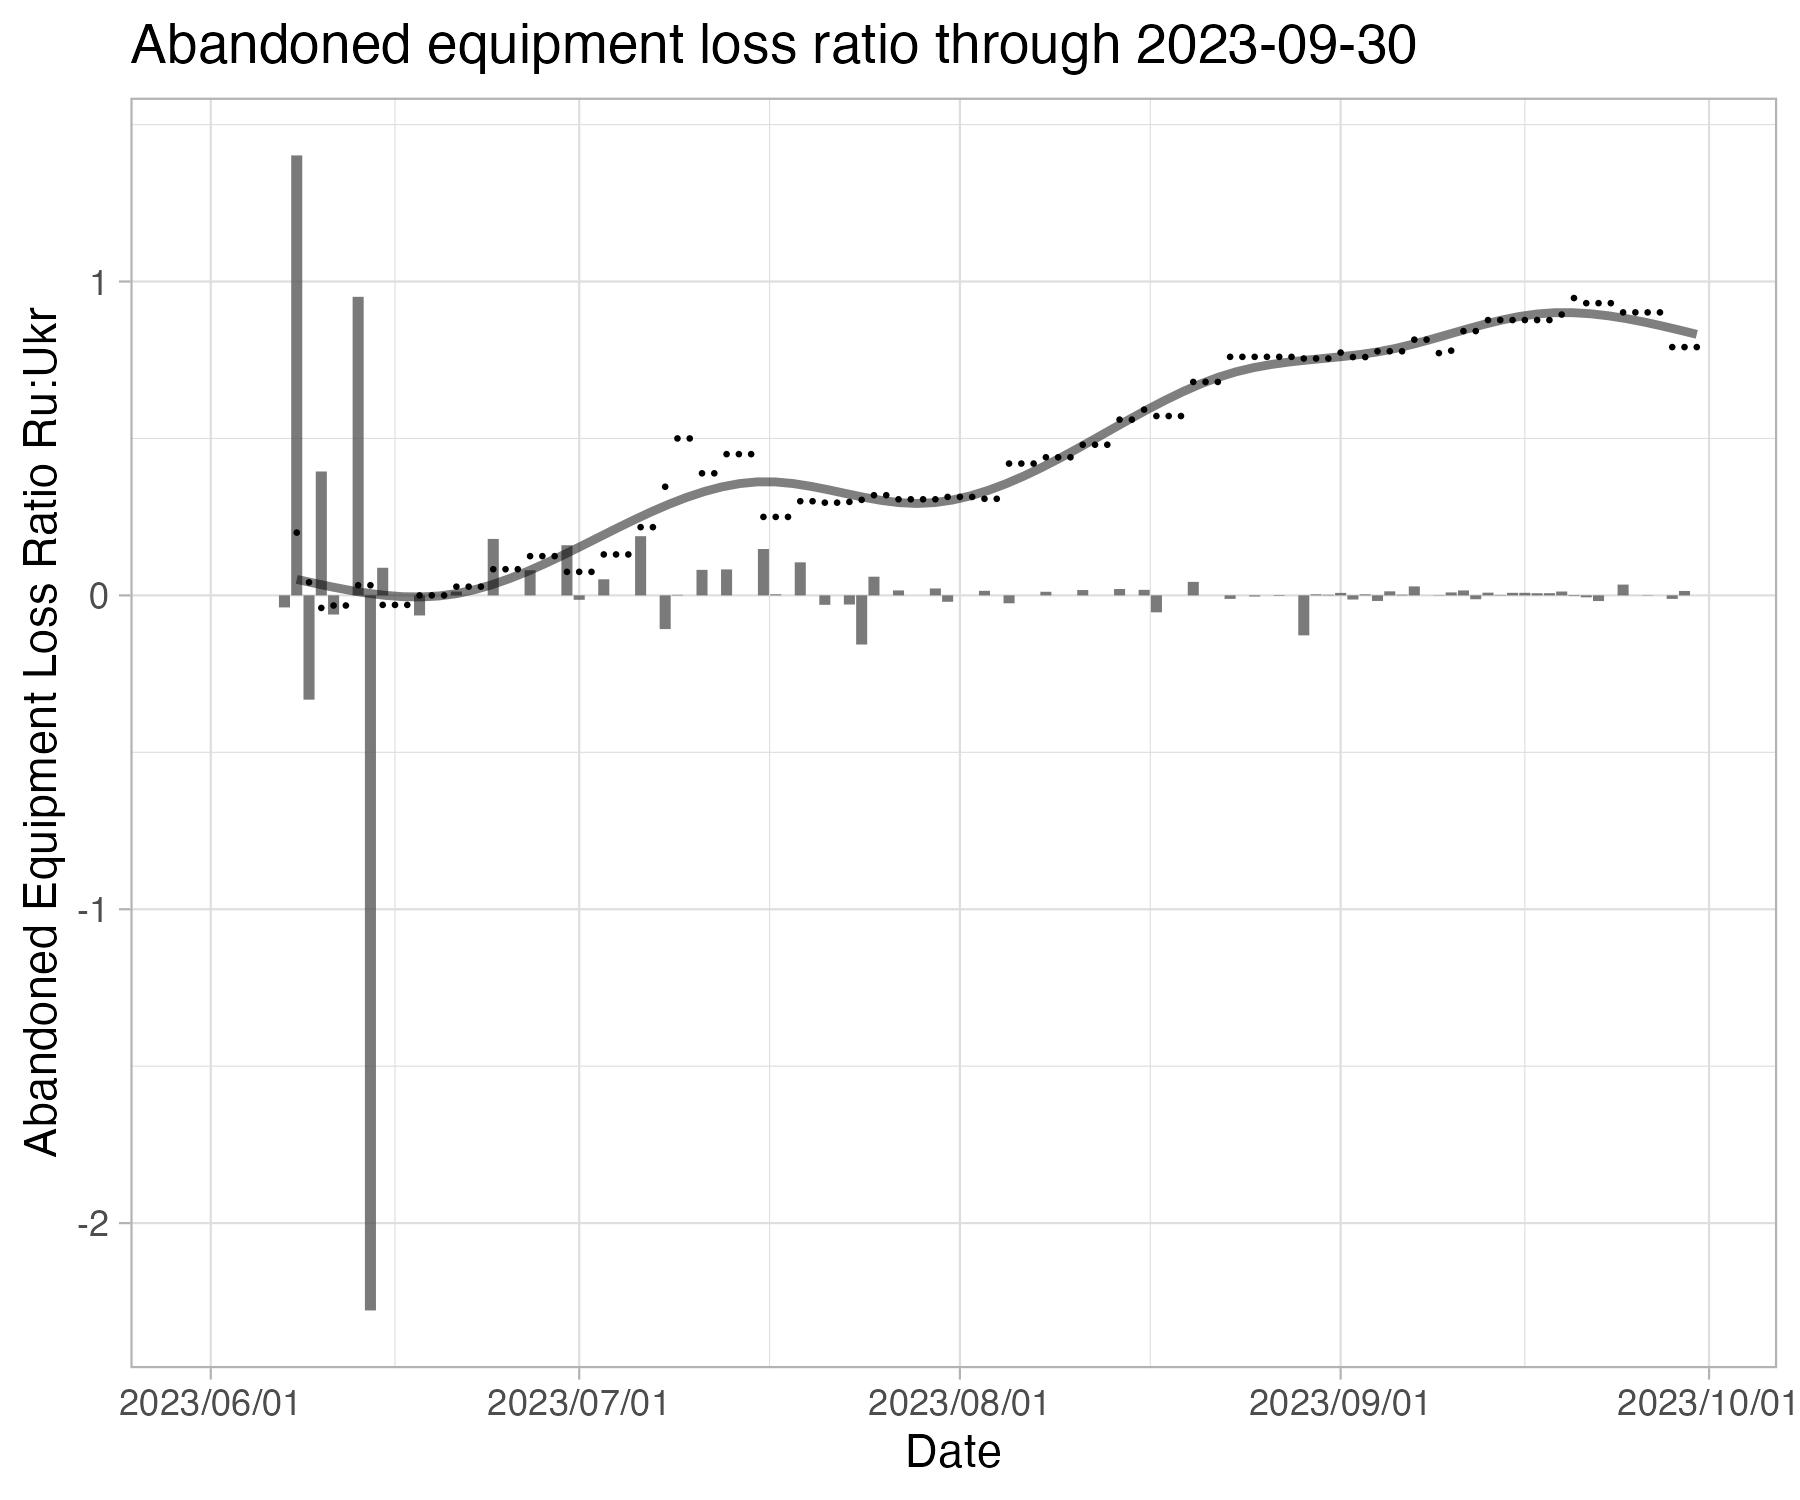
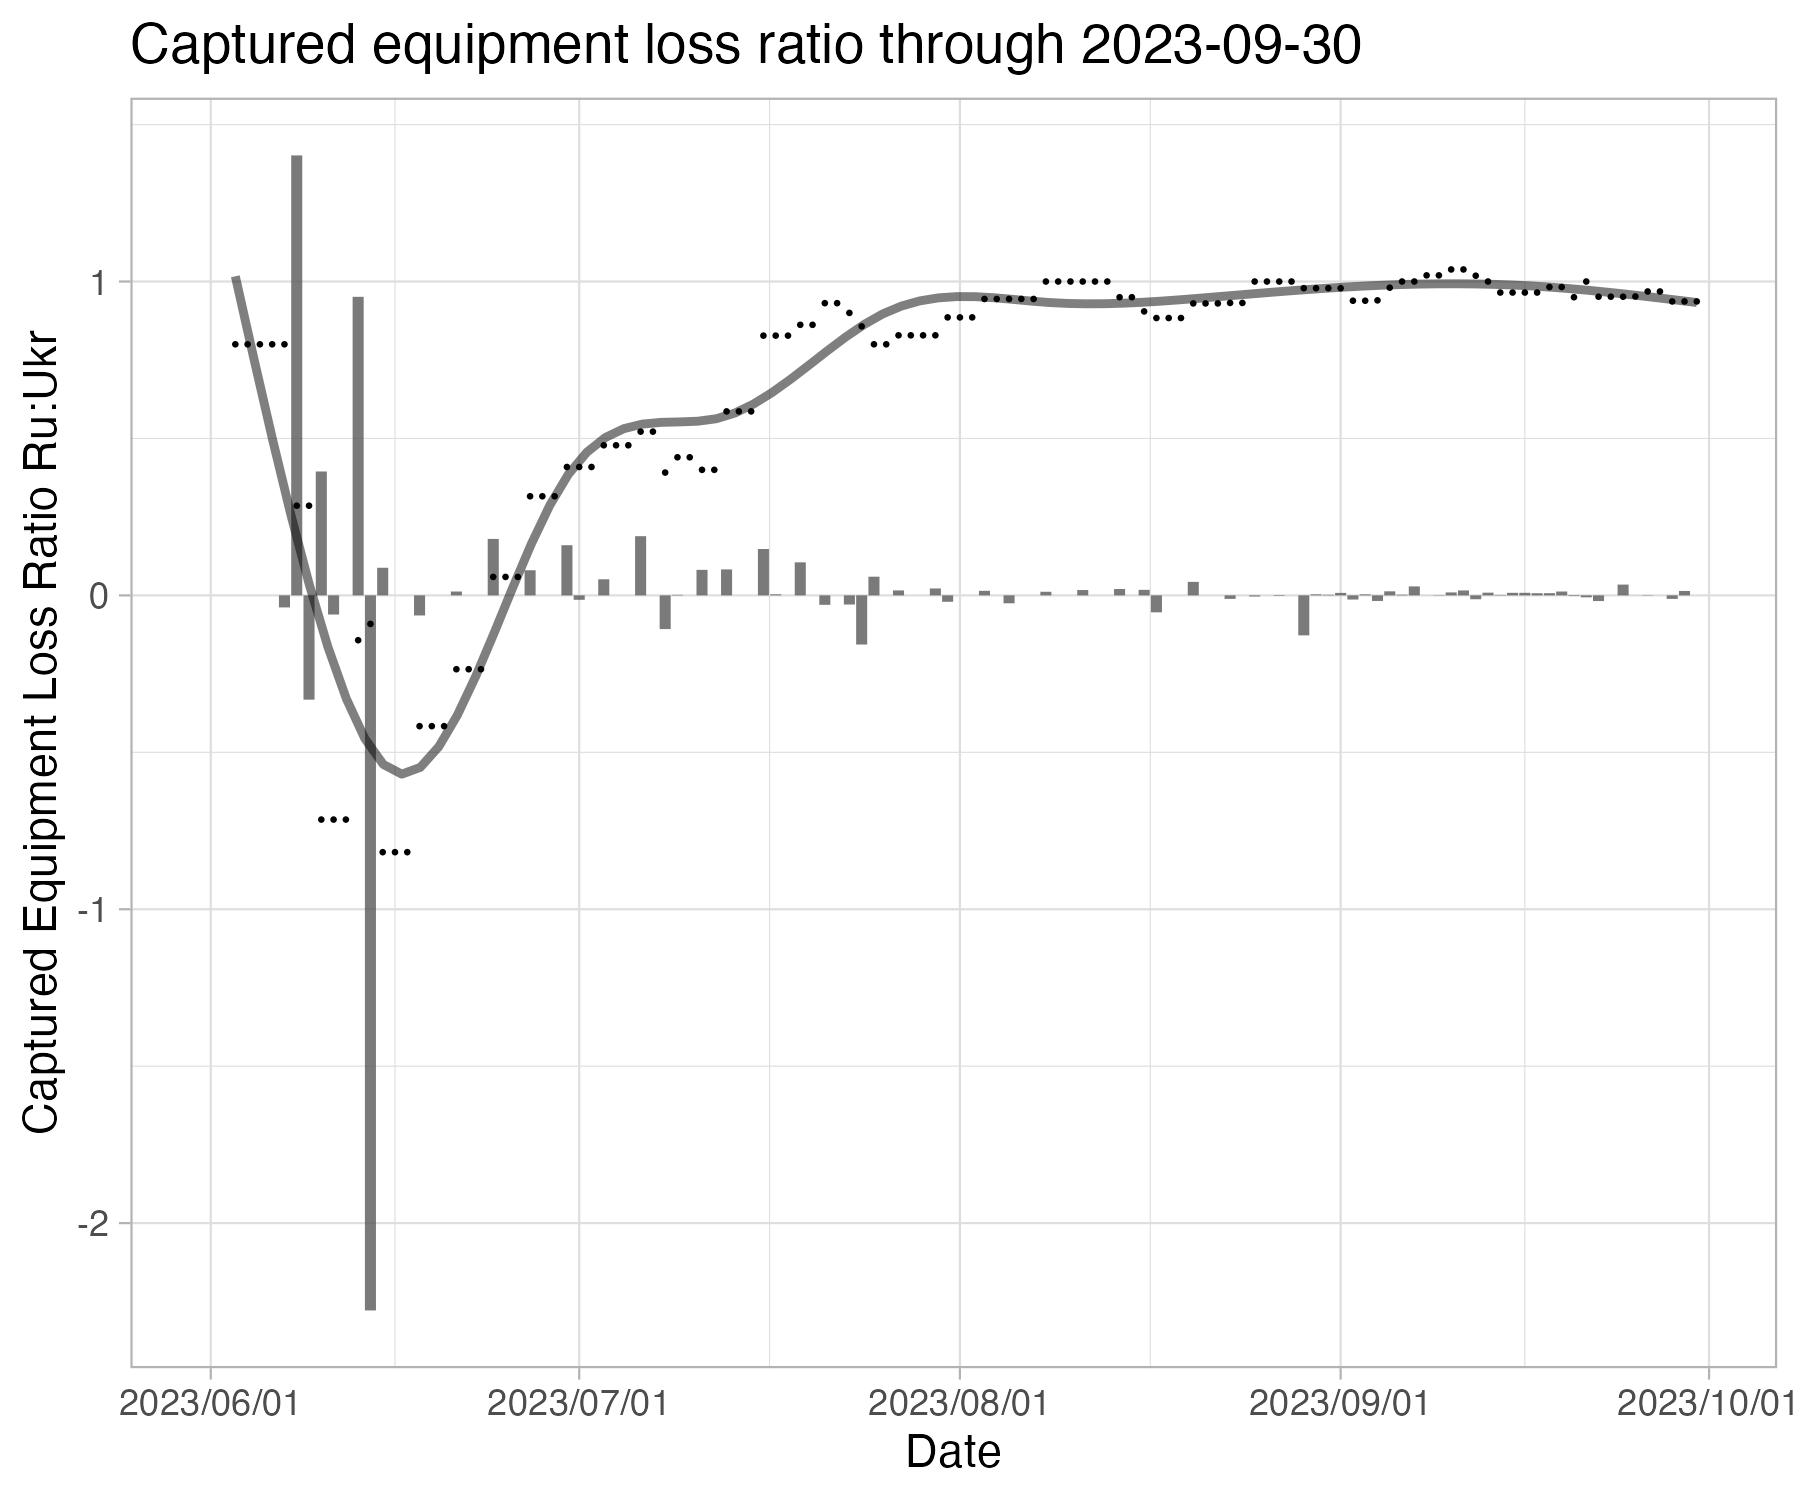
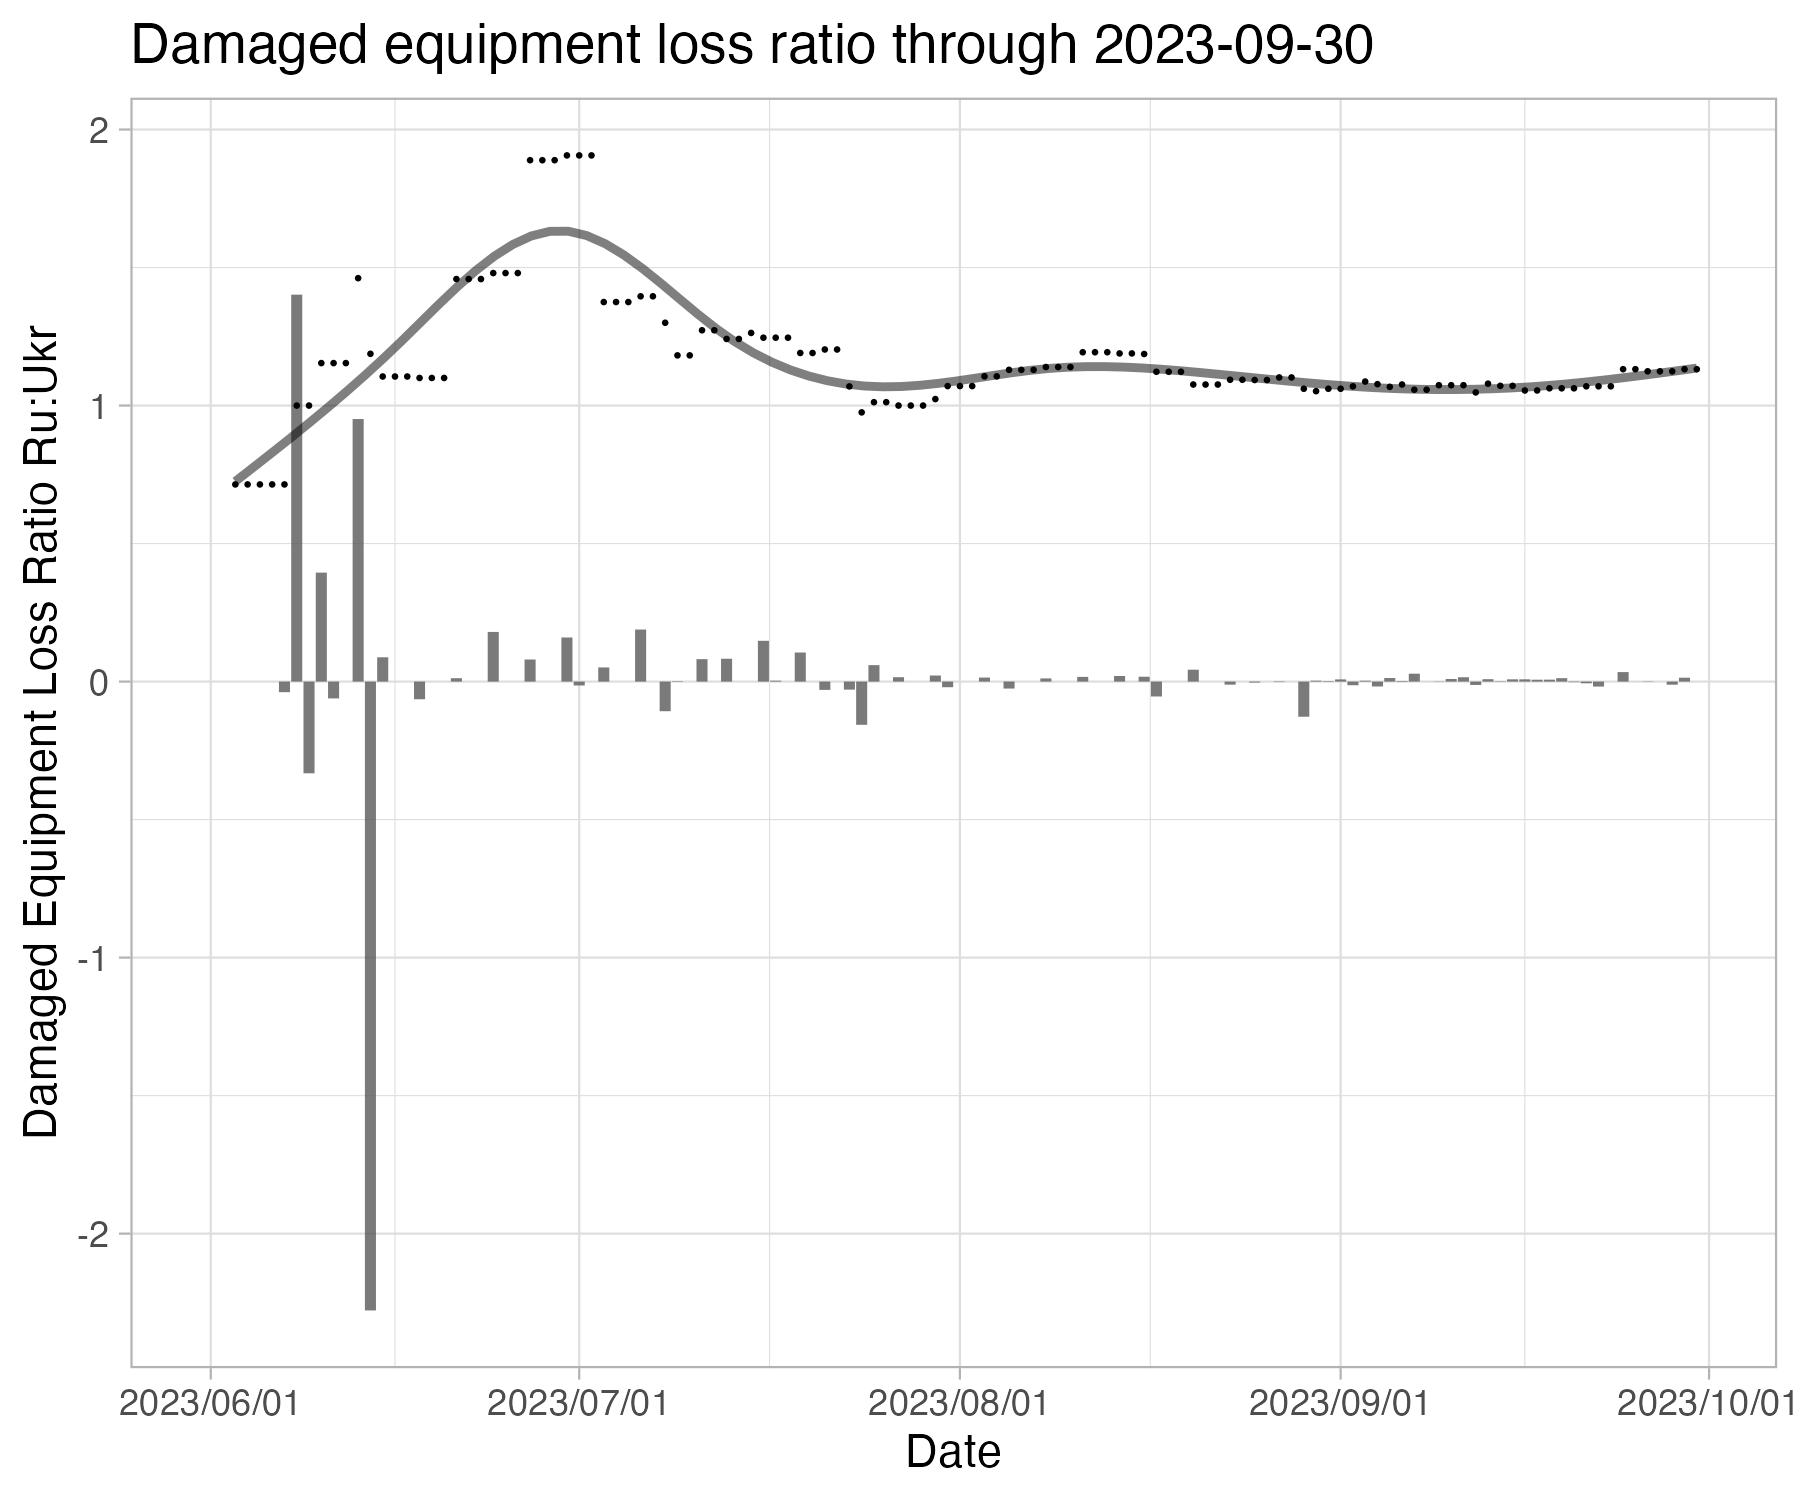
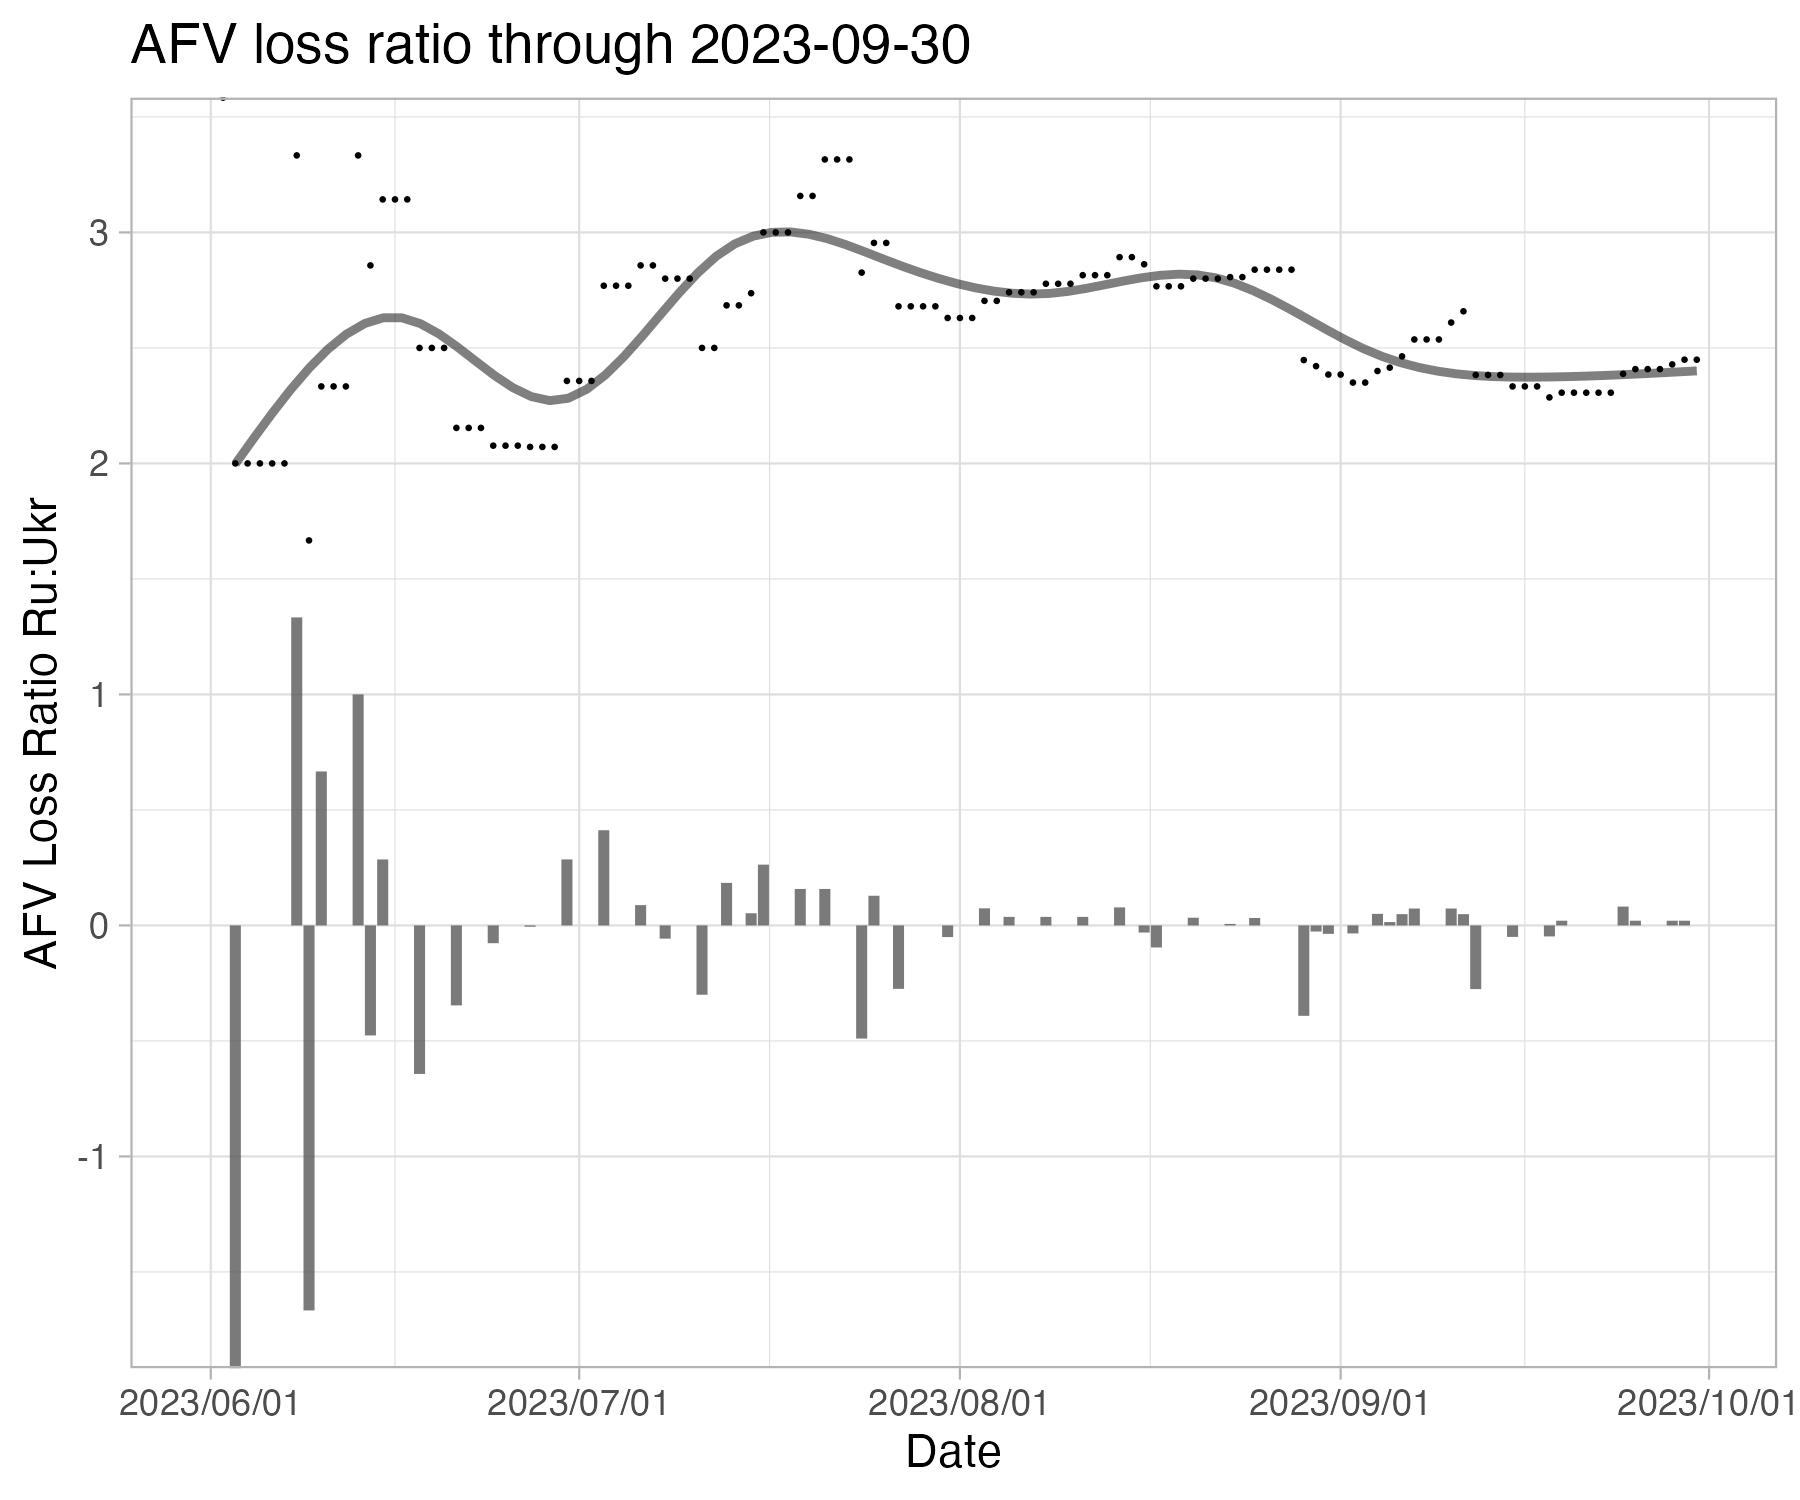
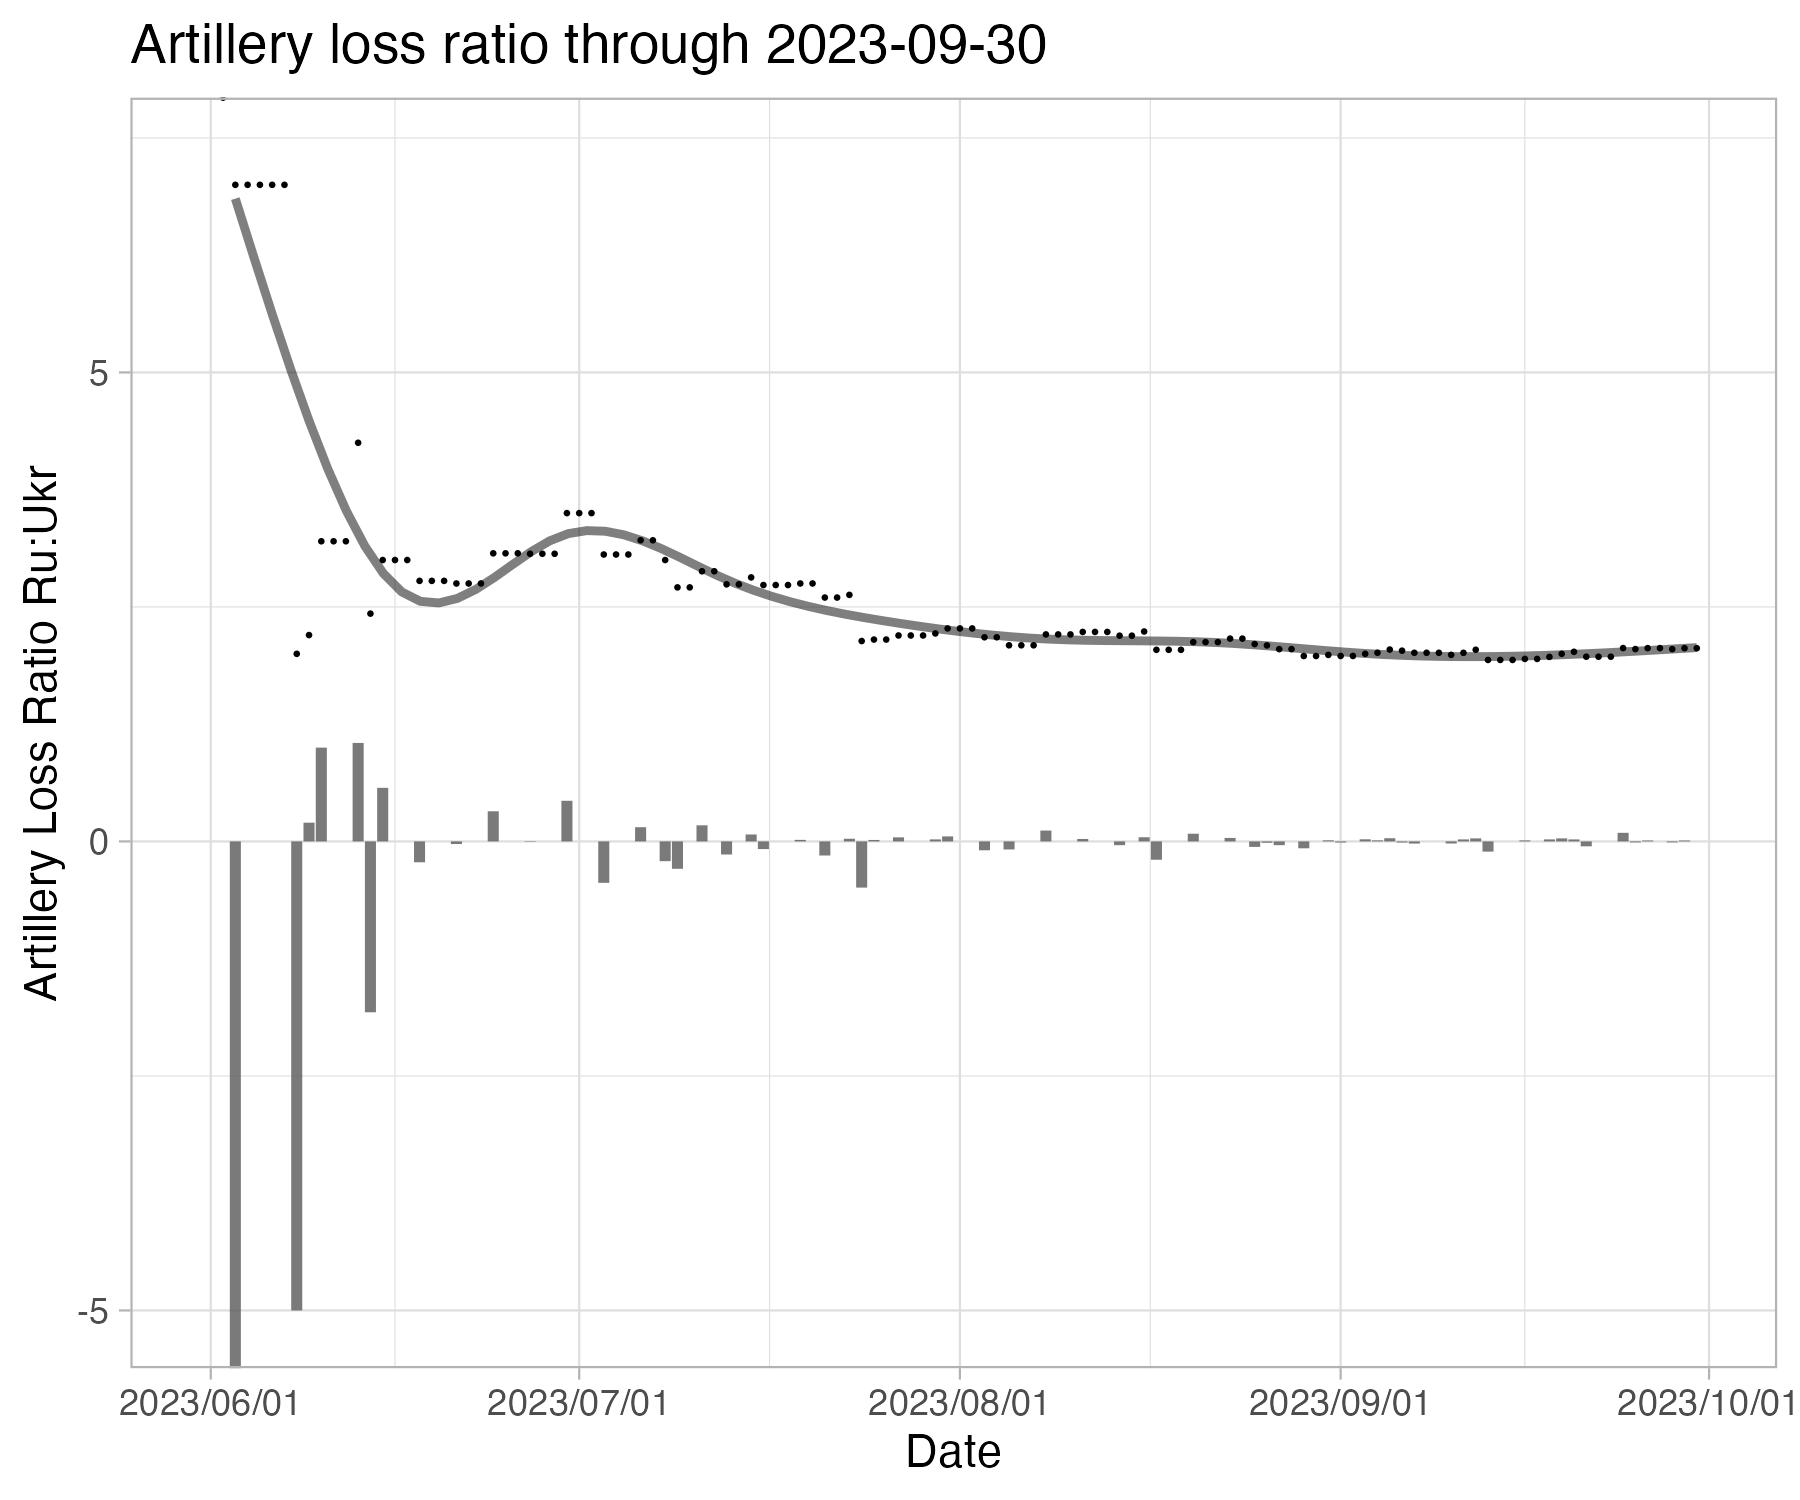
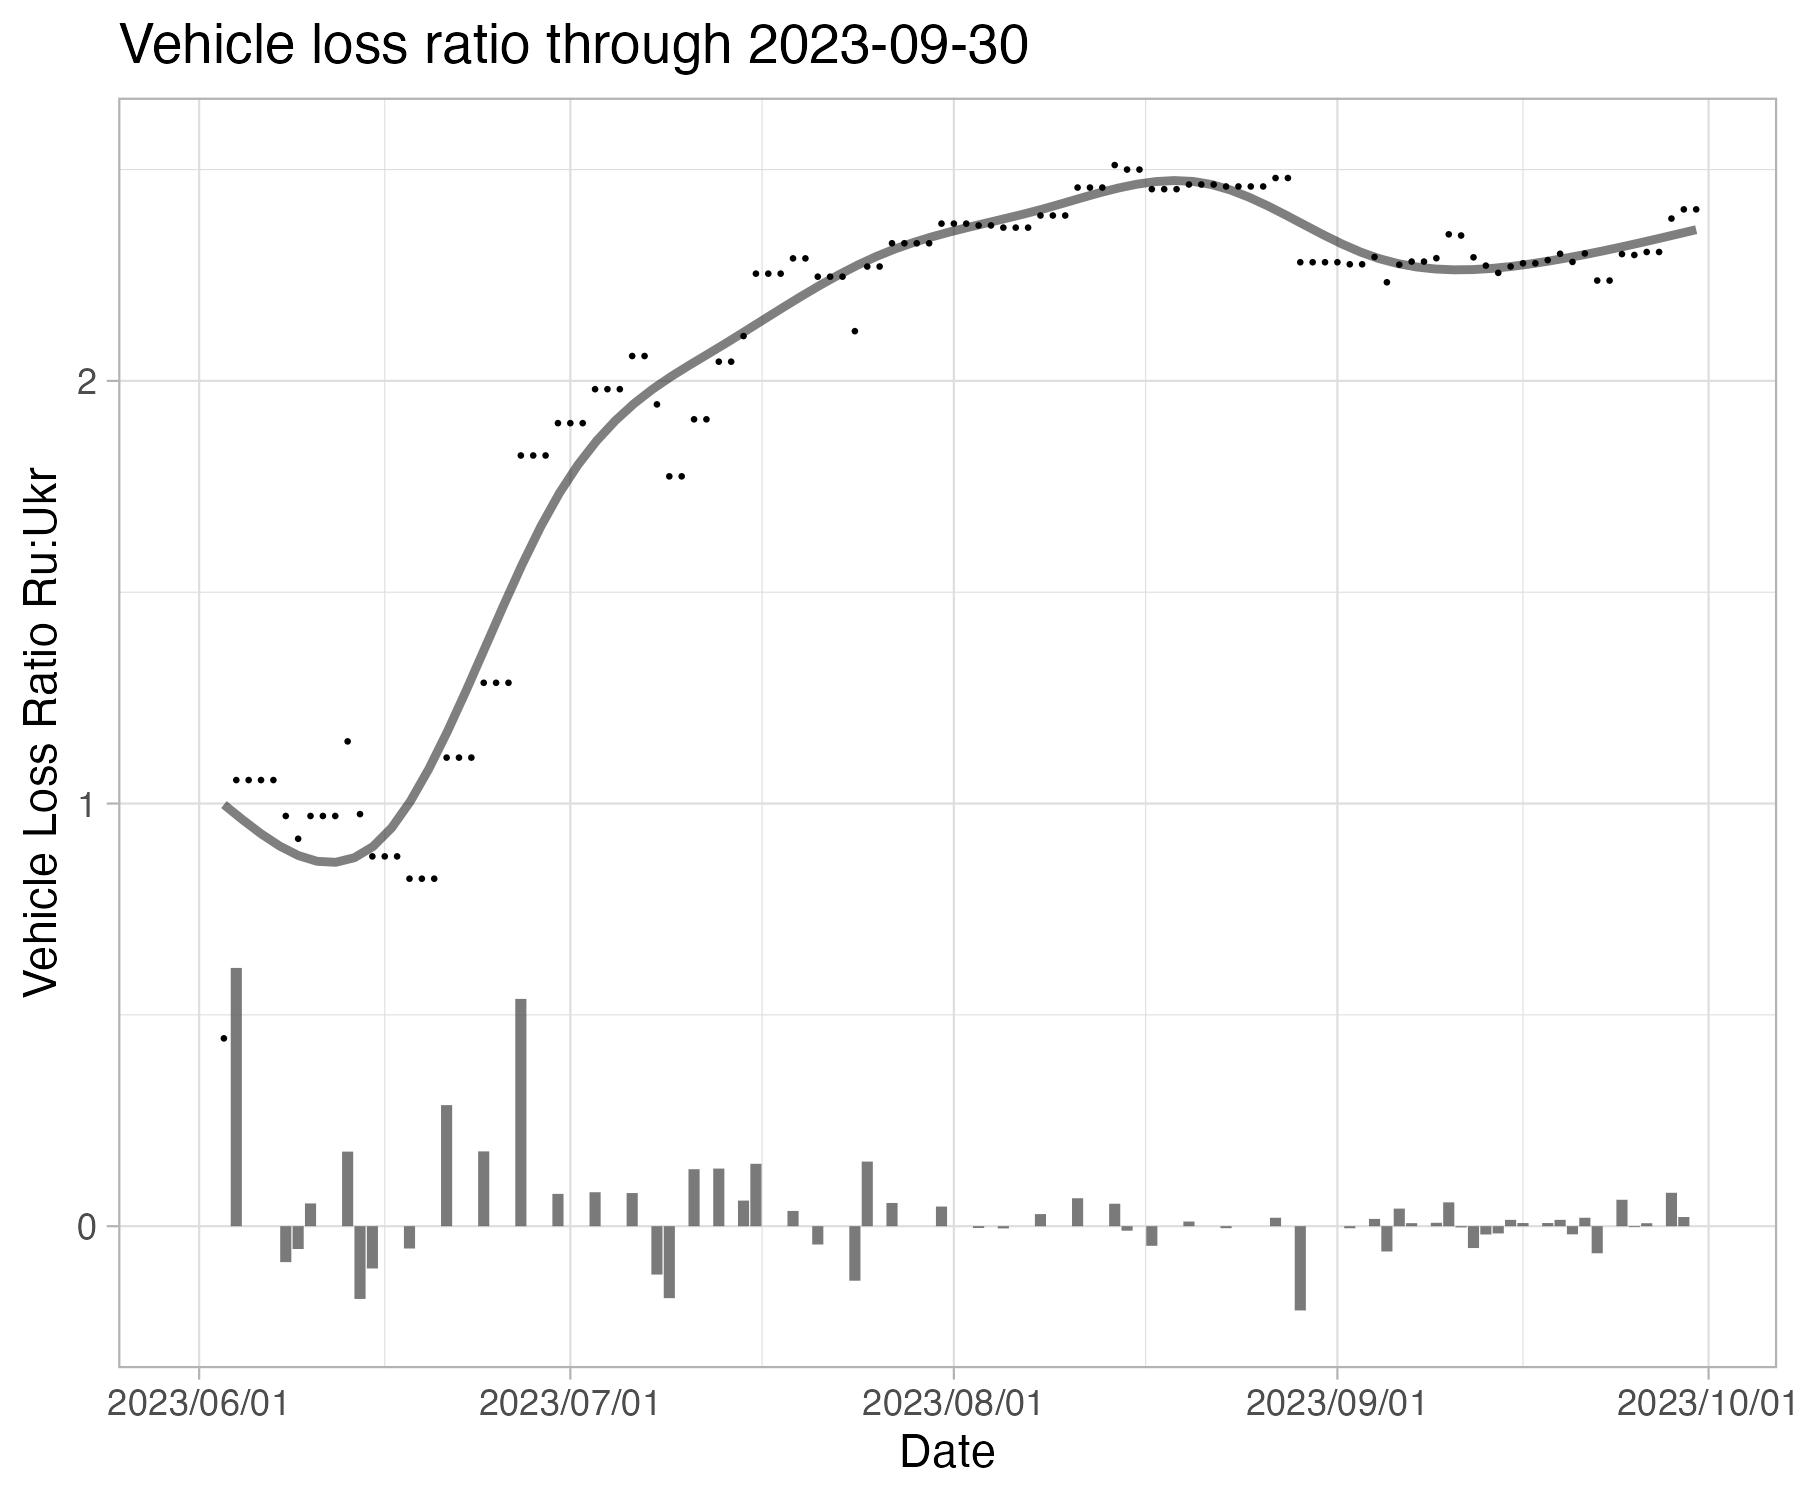
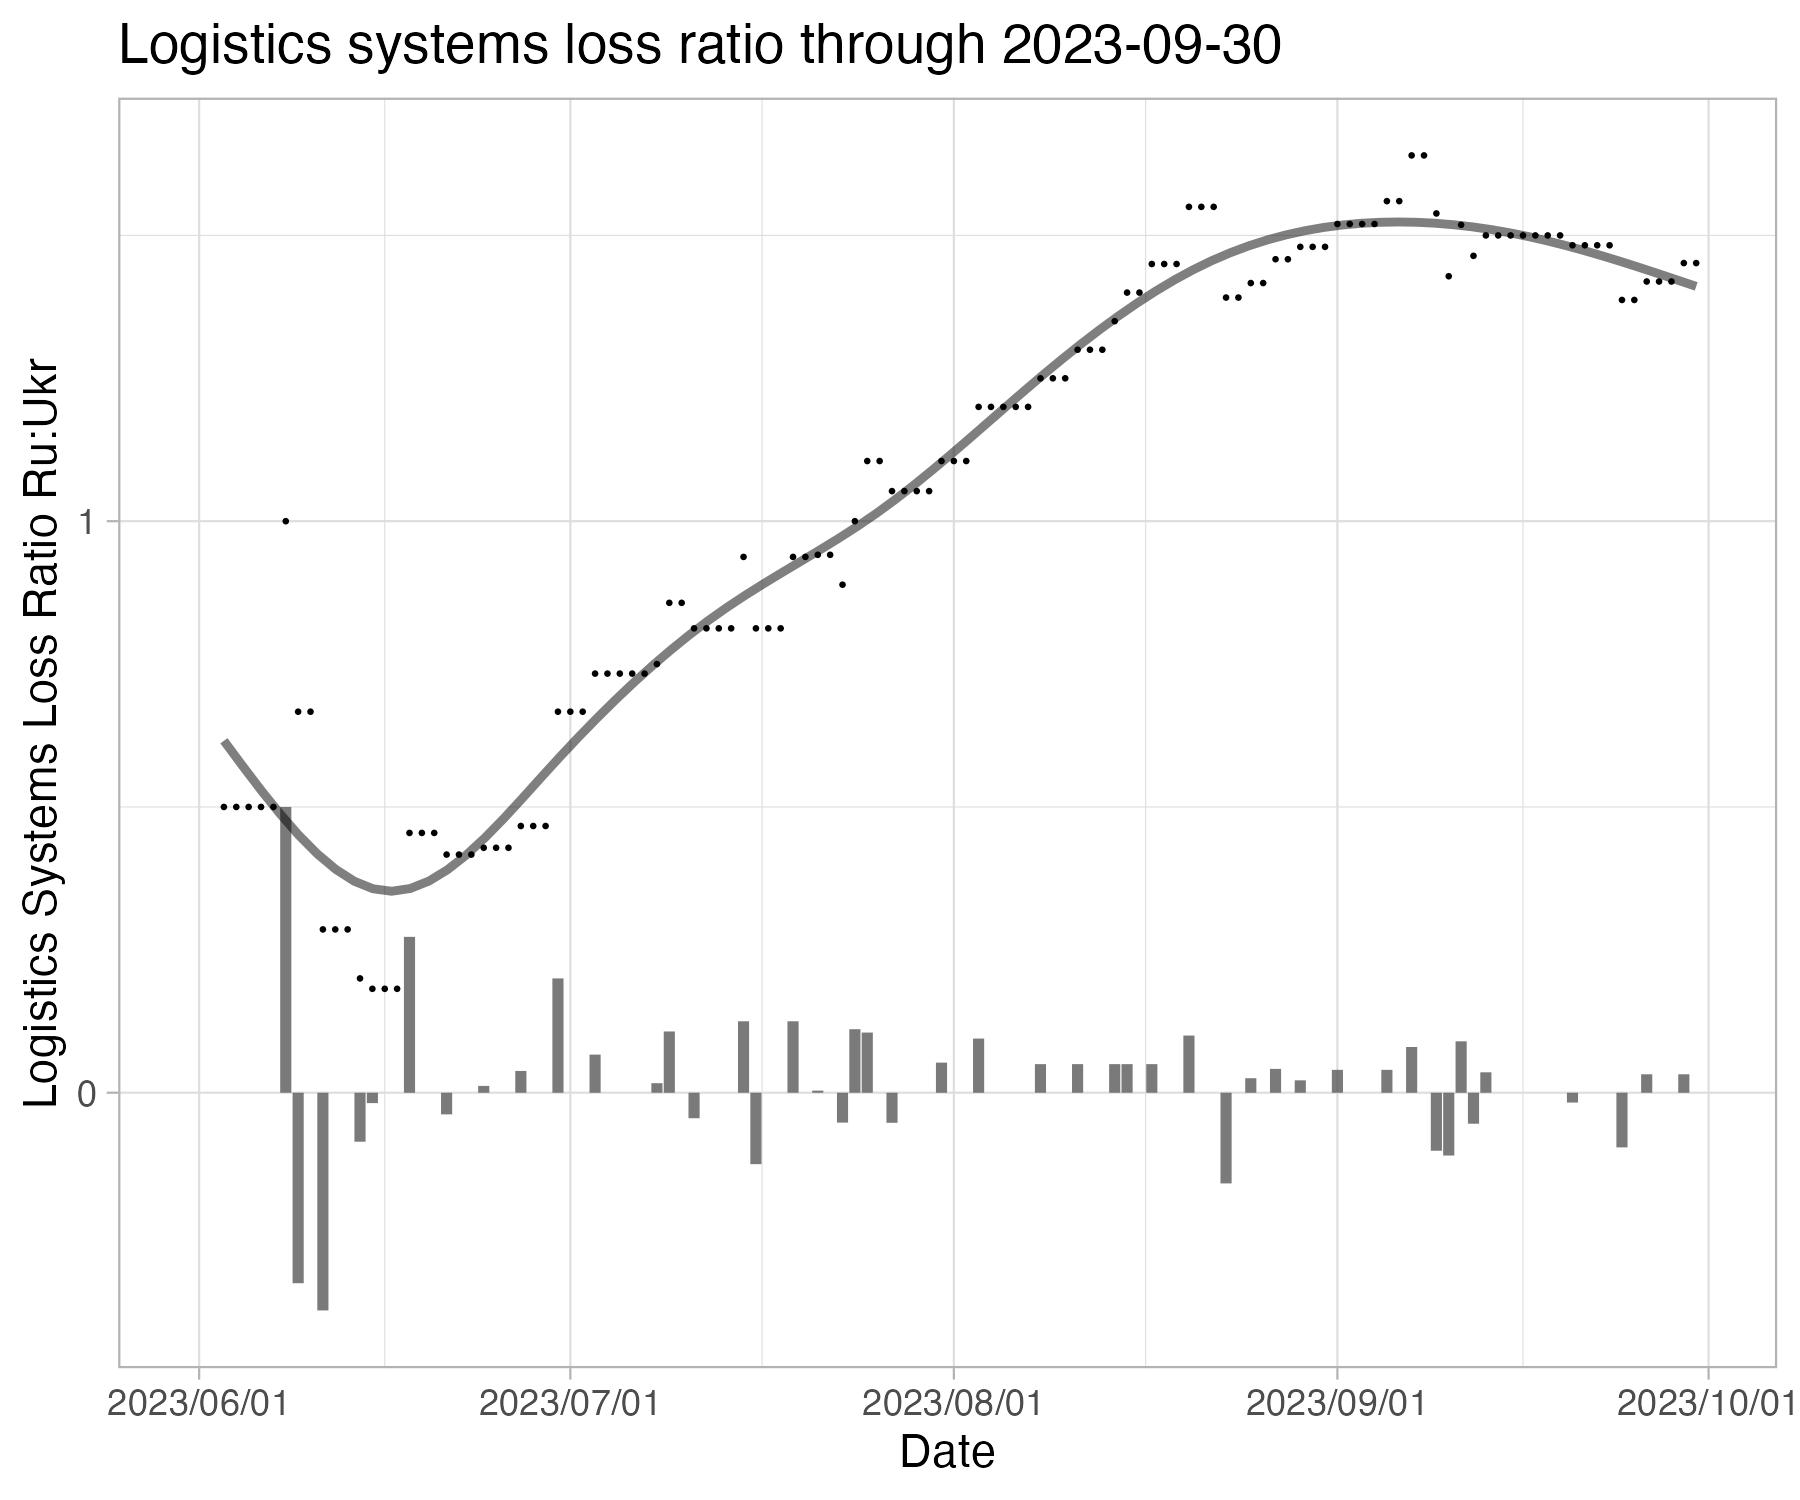
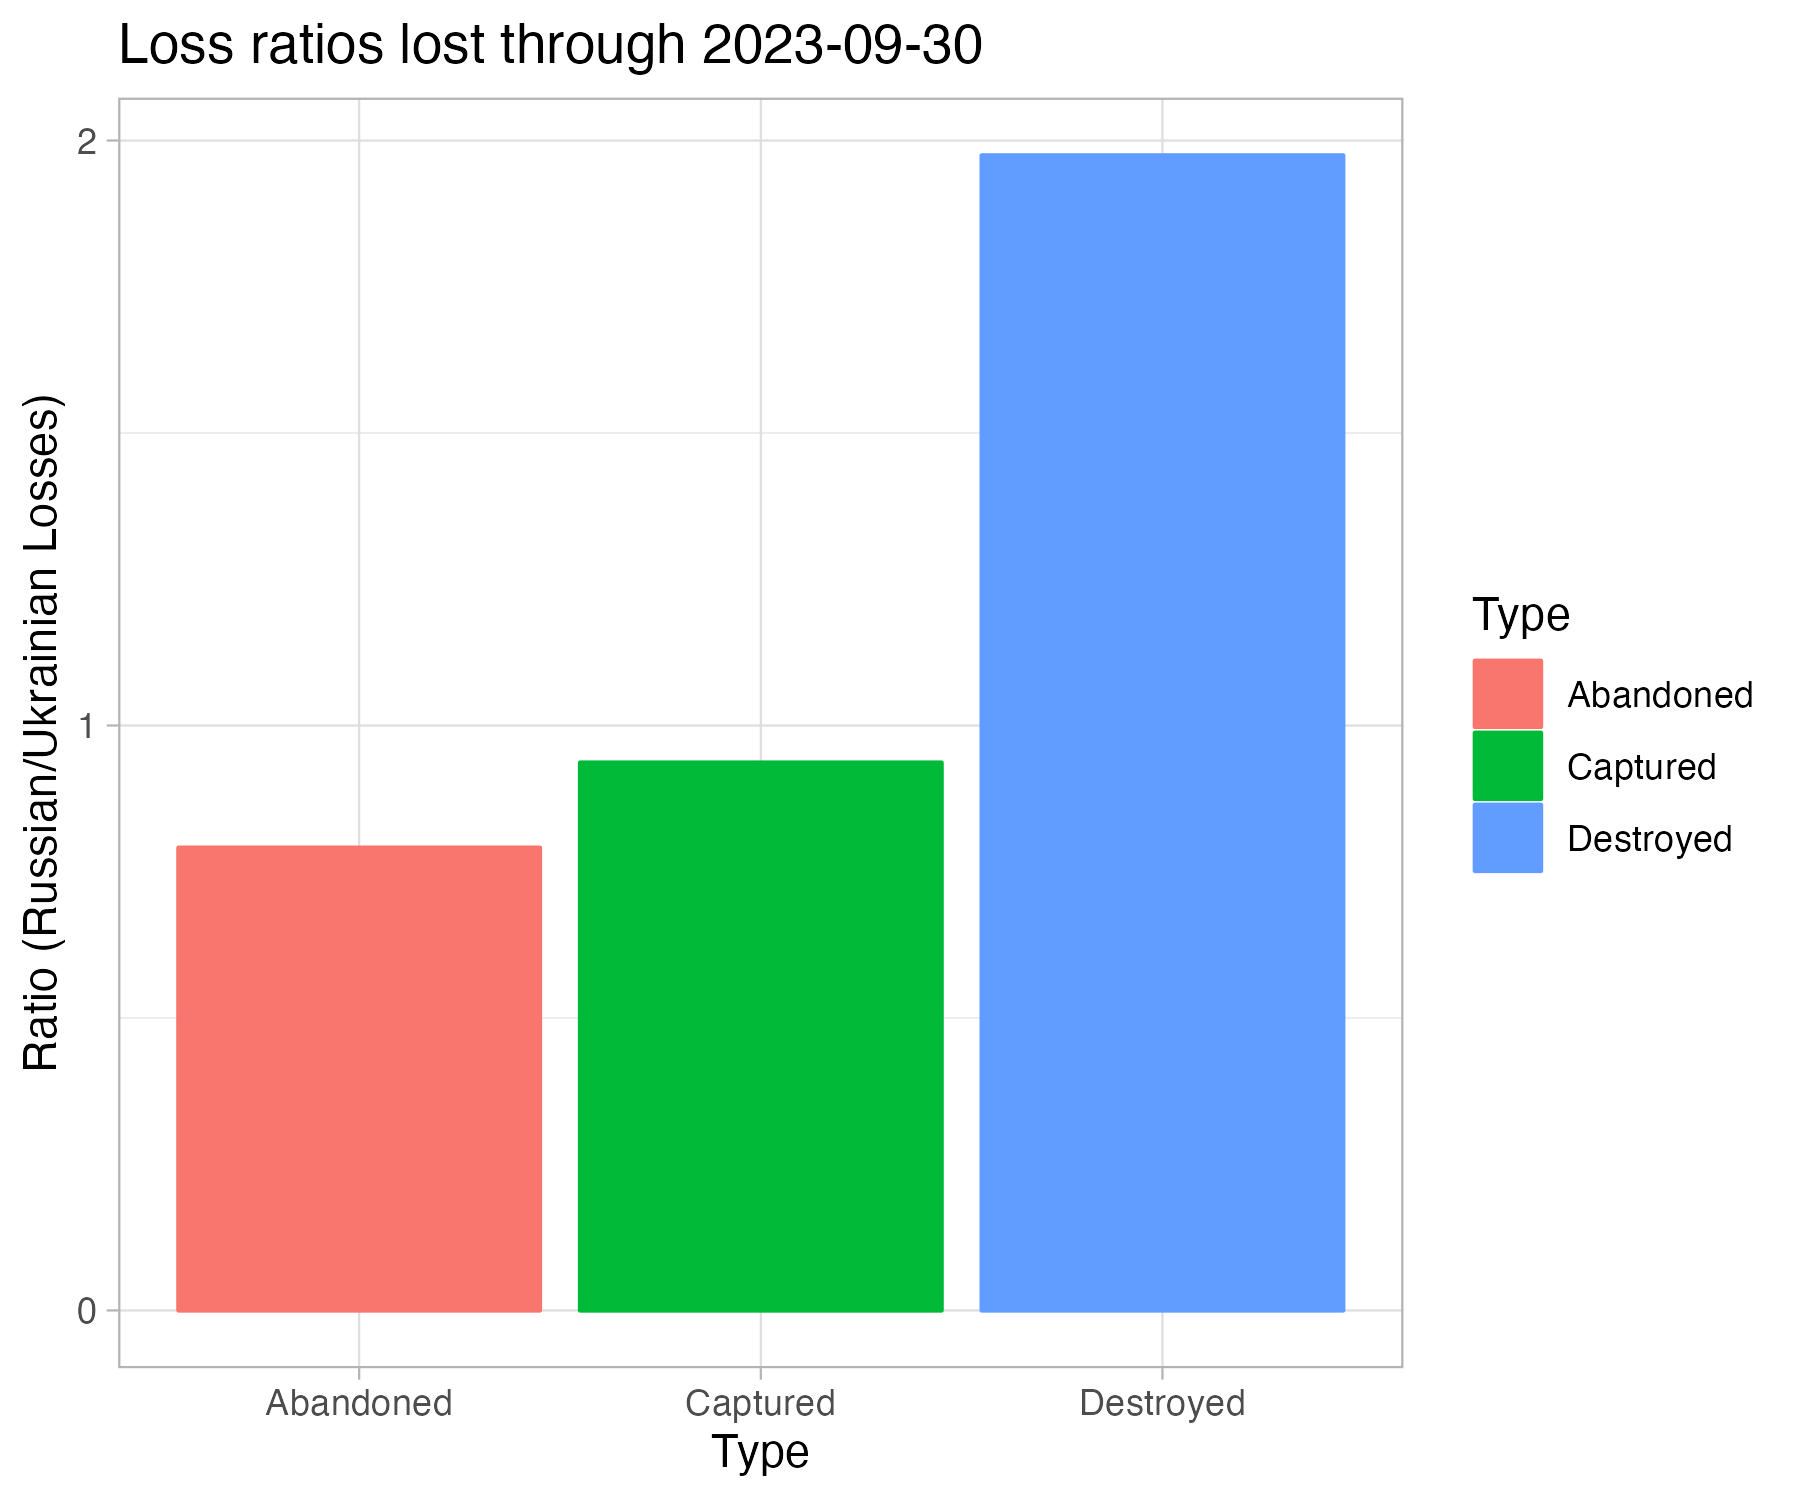 These ratio Plots/2023-06-01/ use Russian equipment losses as the numerator and Ukranian losses as the denominator. The higher the bar, the higher the proportion of Russian losses.
 Tokmak is the main axis Ukrainians are focusing on in their summer 2023
.
Tokmak is the main axis Ukrainians are focusing on in their summer 2023
.
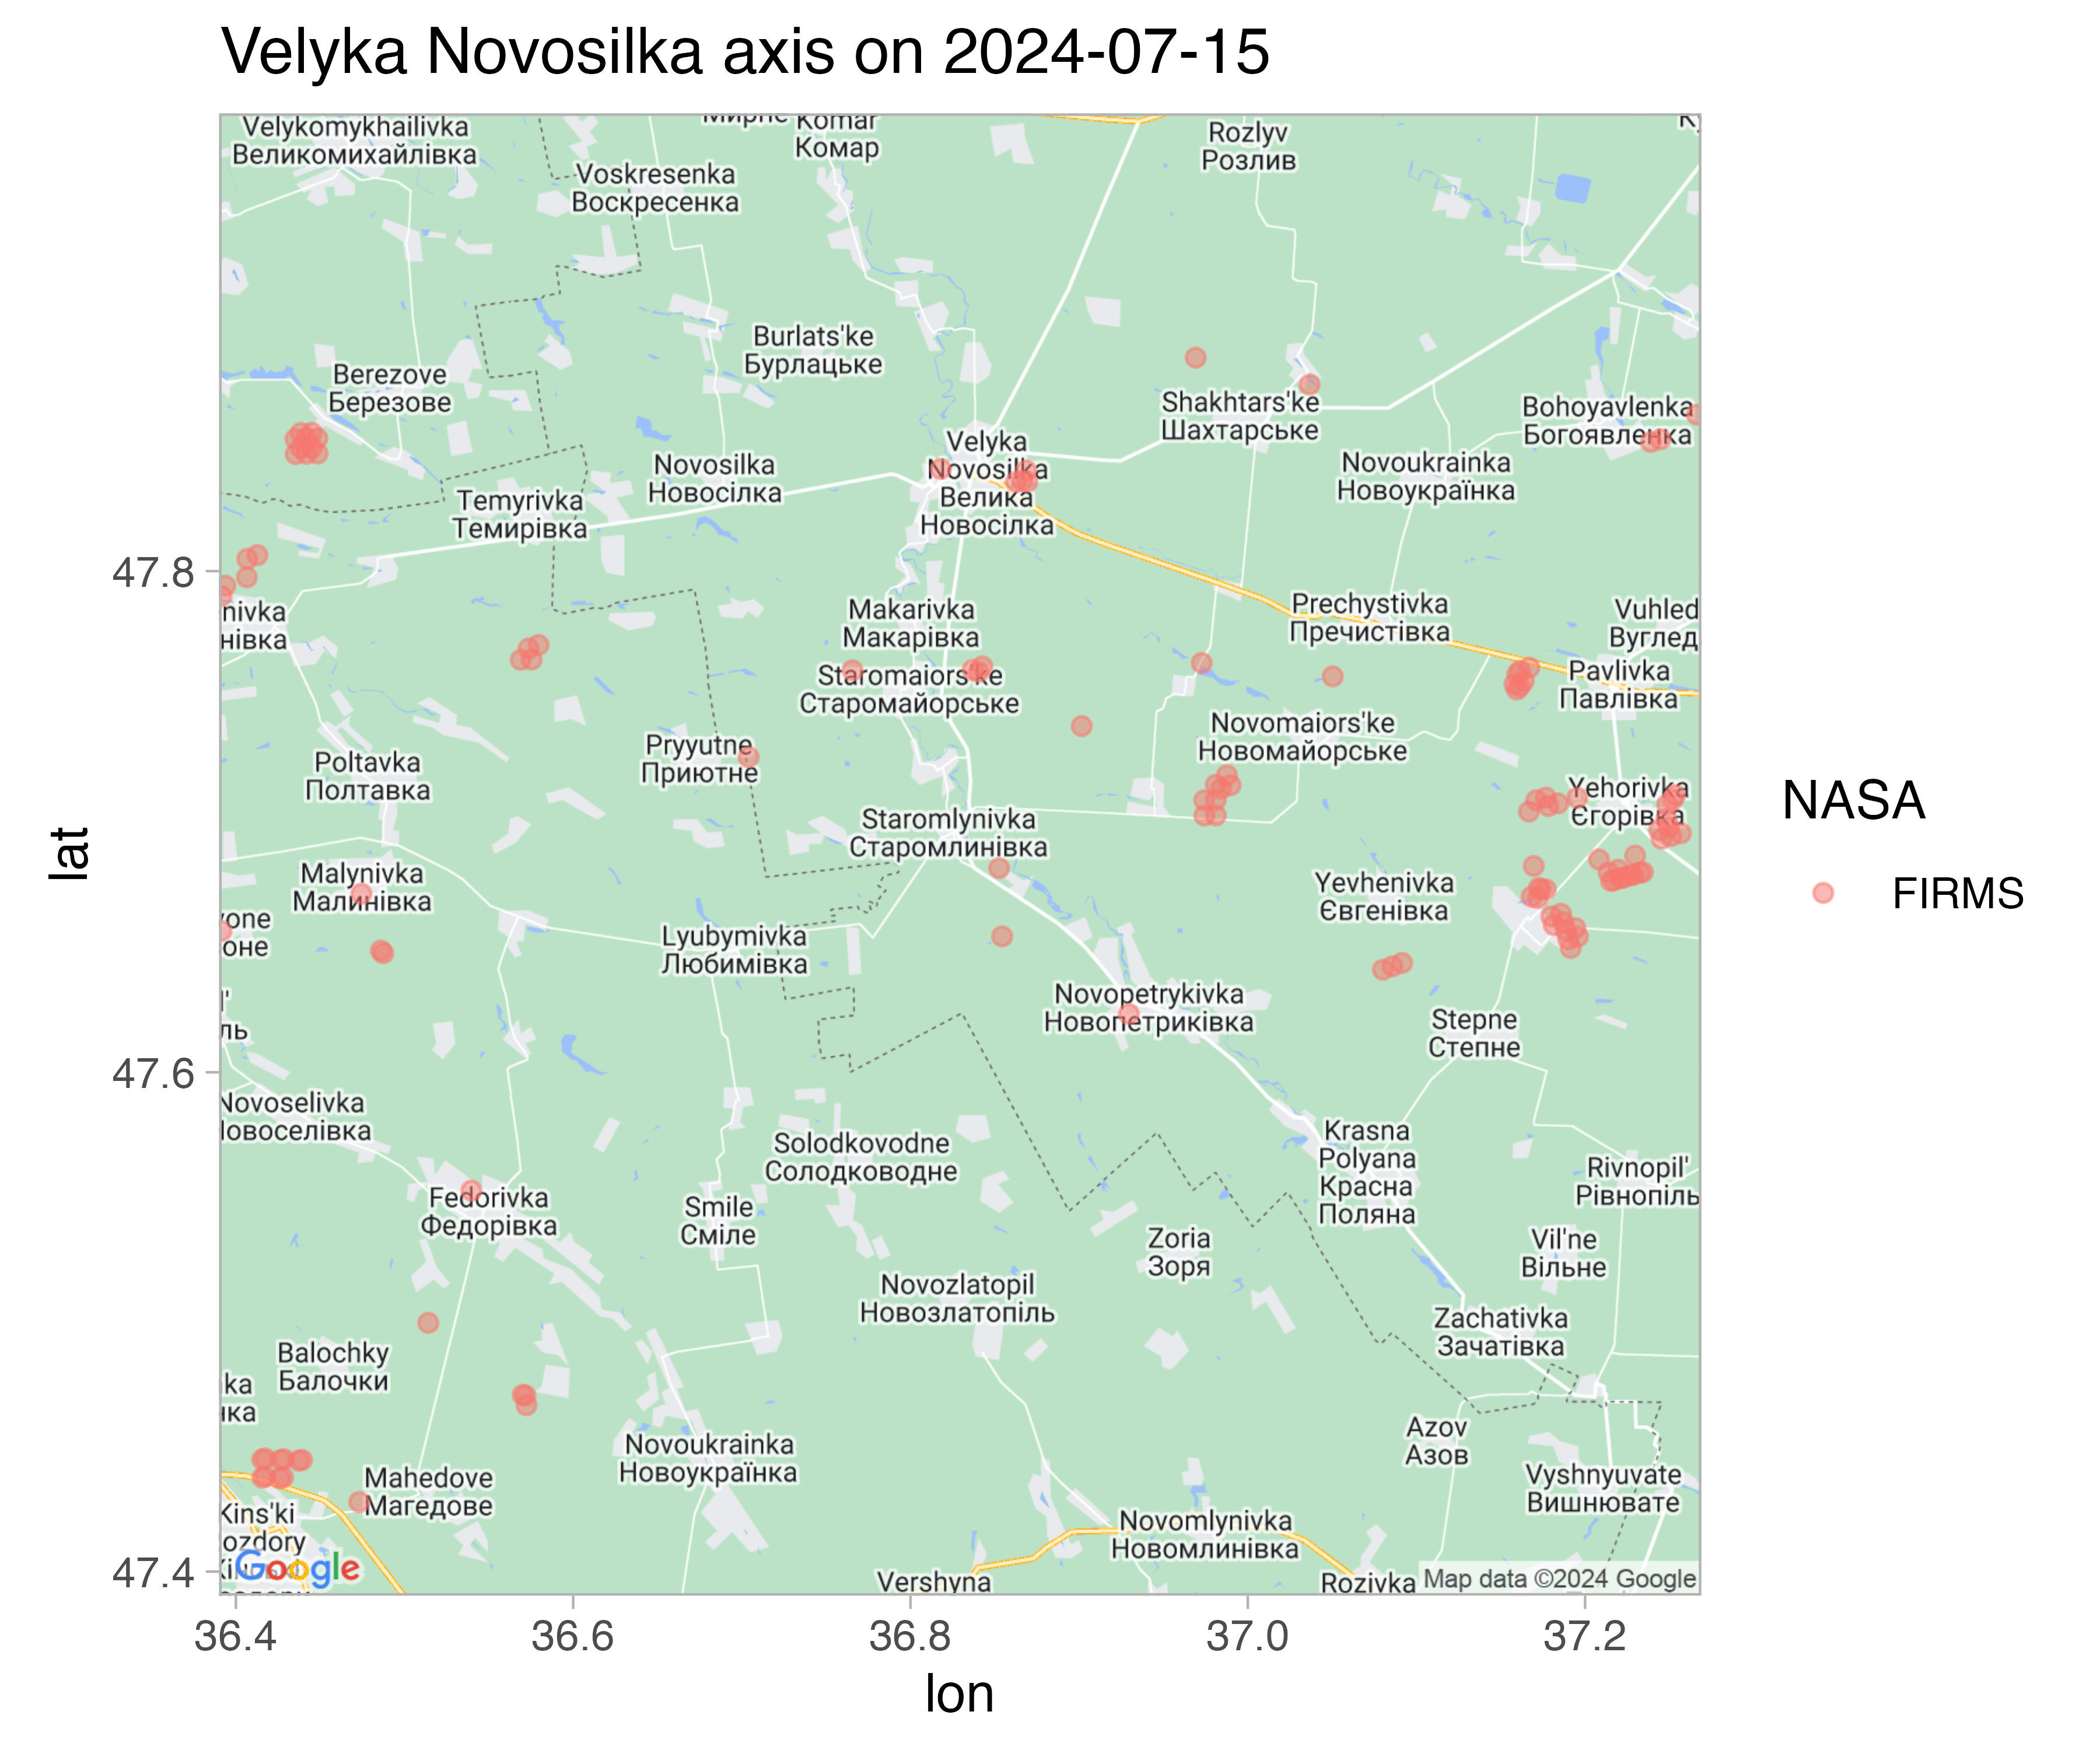 A supporting axis for the Ukrainian Summer 2023 summer offensive is on the Zaporhizhizhia-Donetks oblast border.
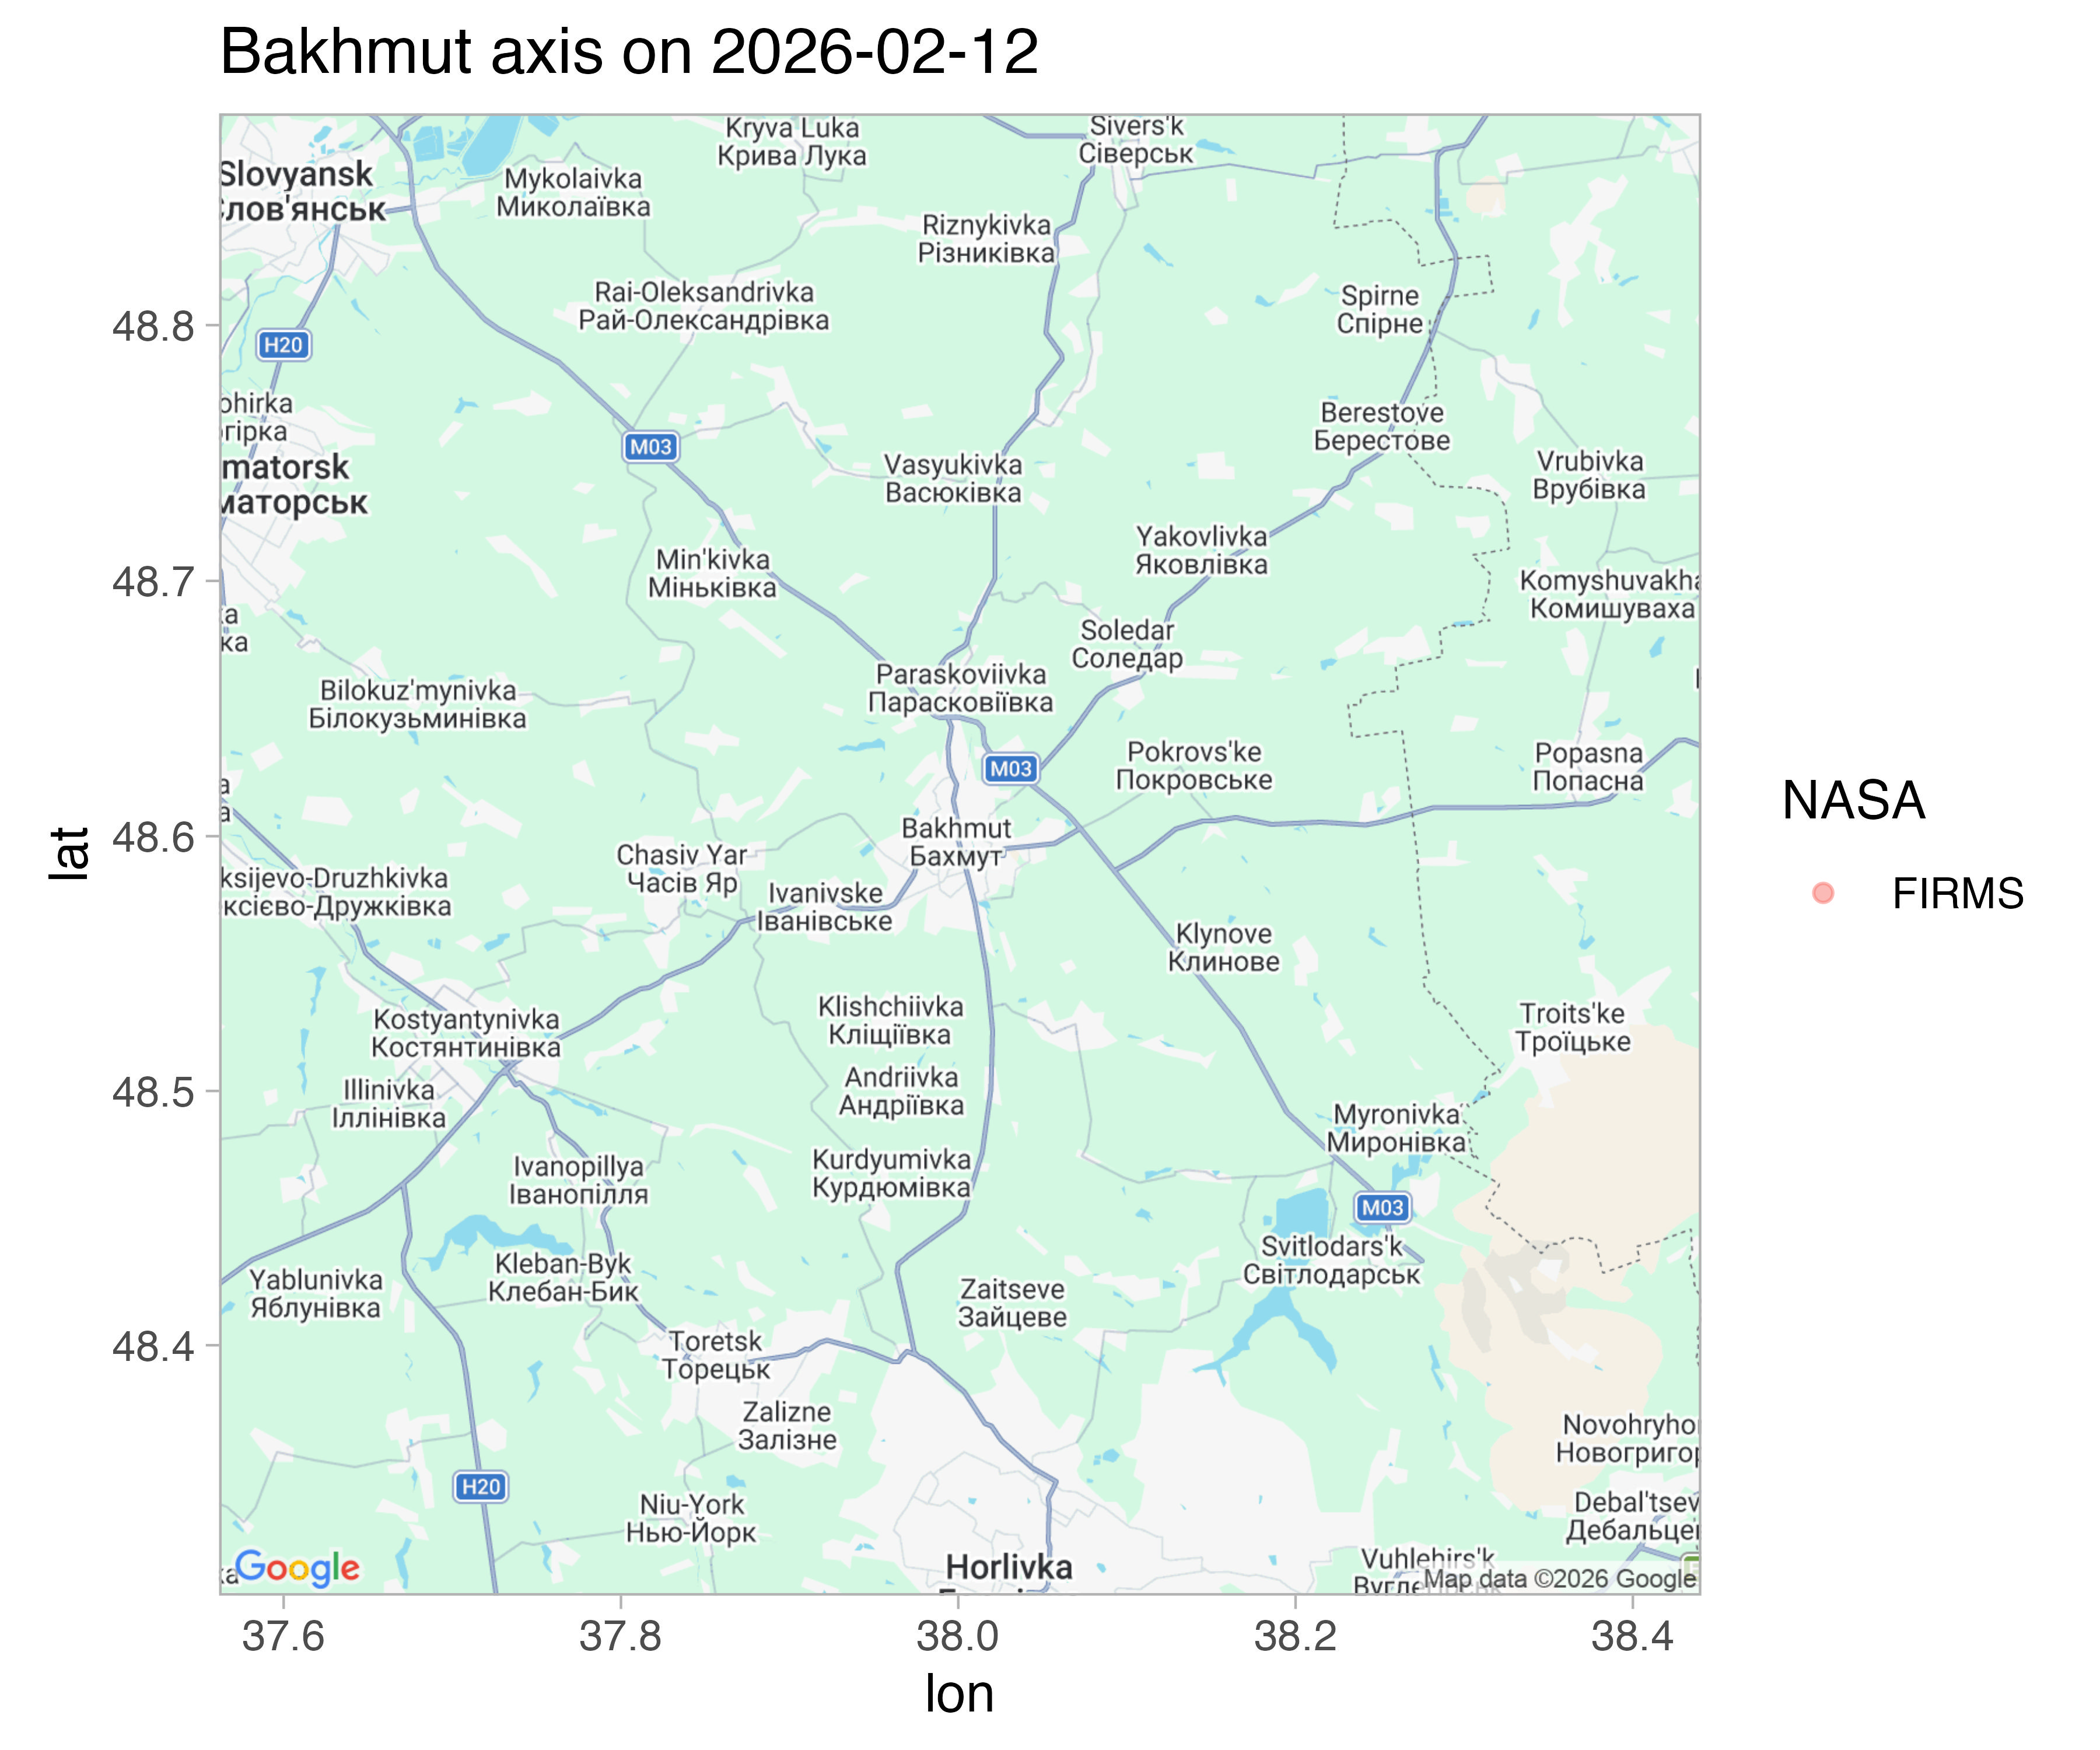 Fighting has been intense in Bahkmut since the summer of 2022.
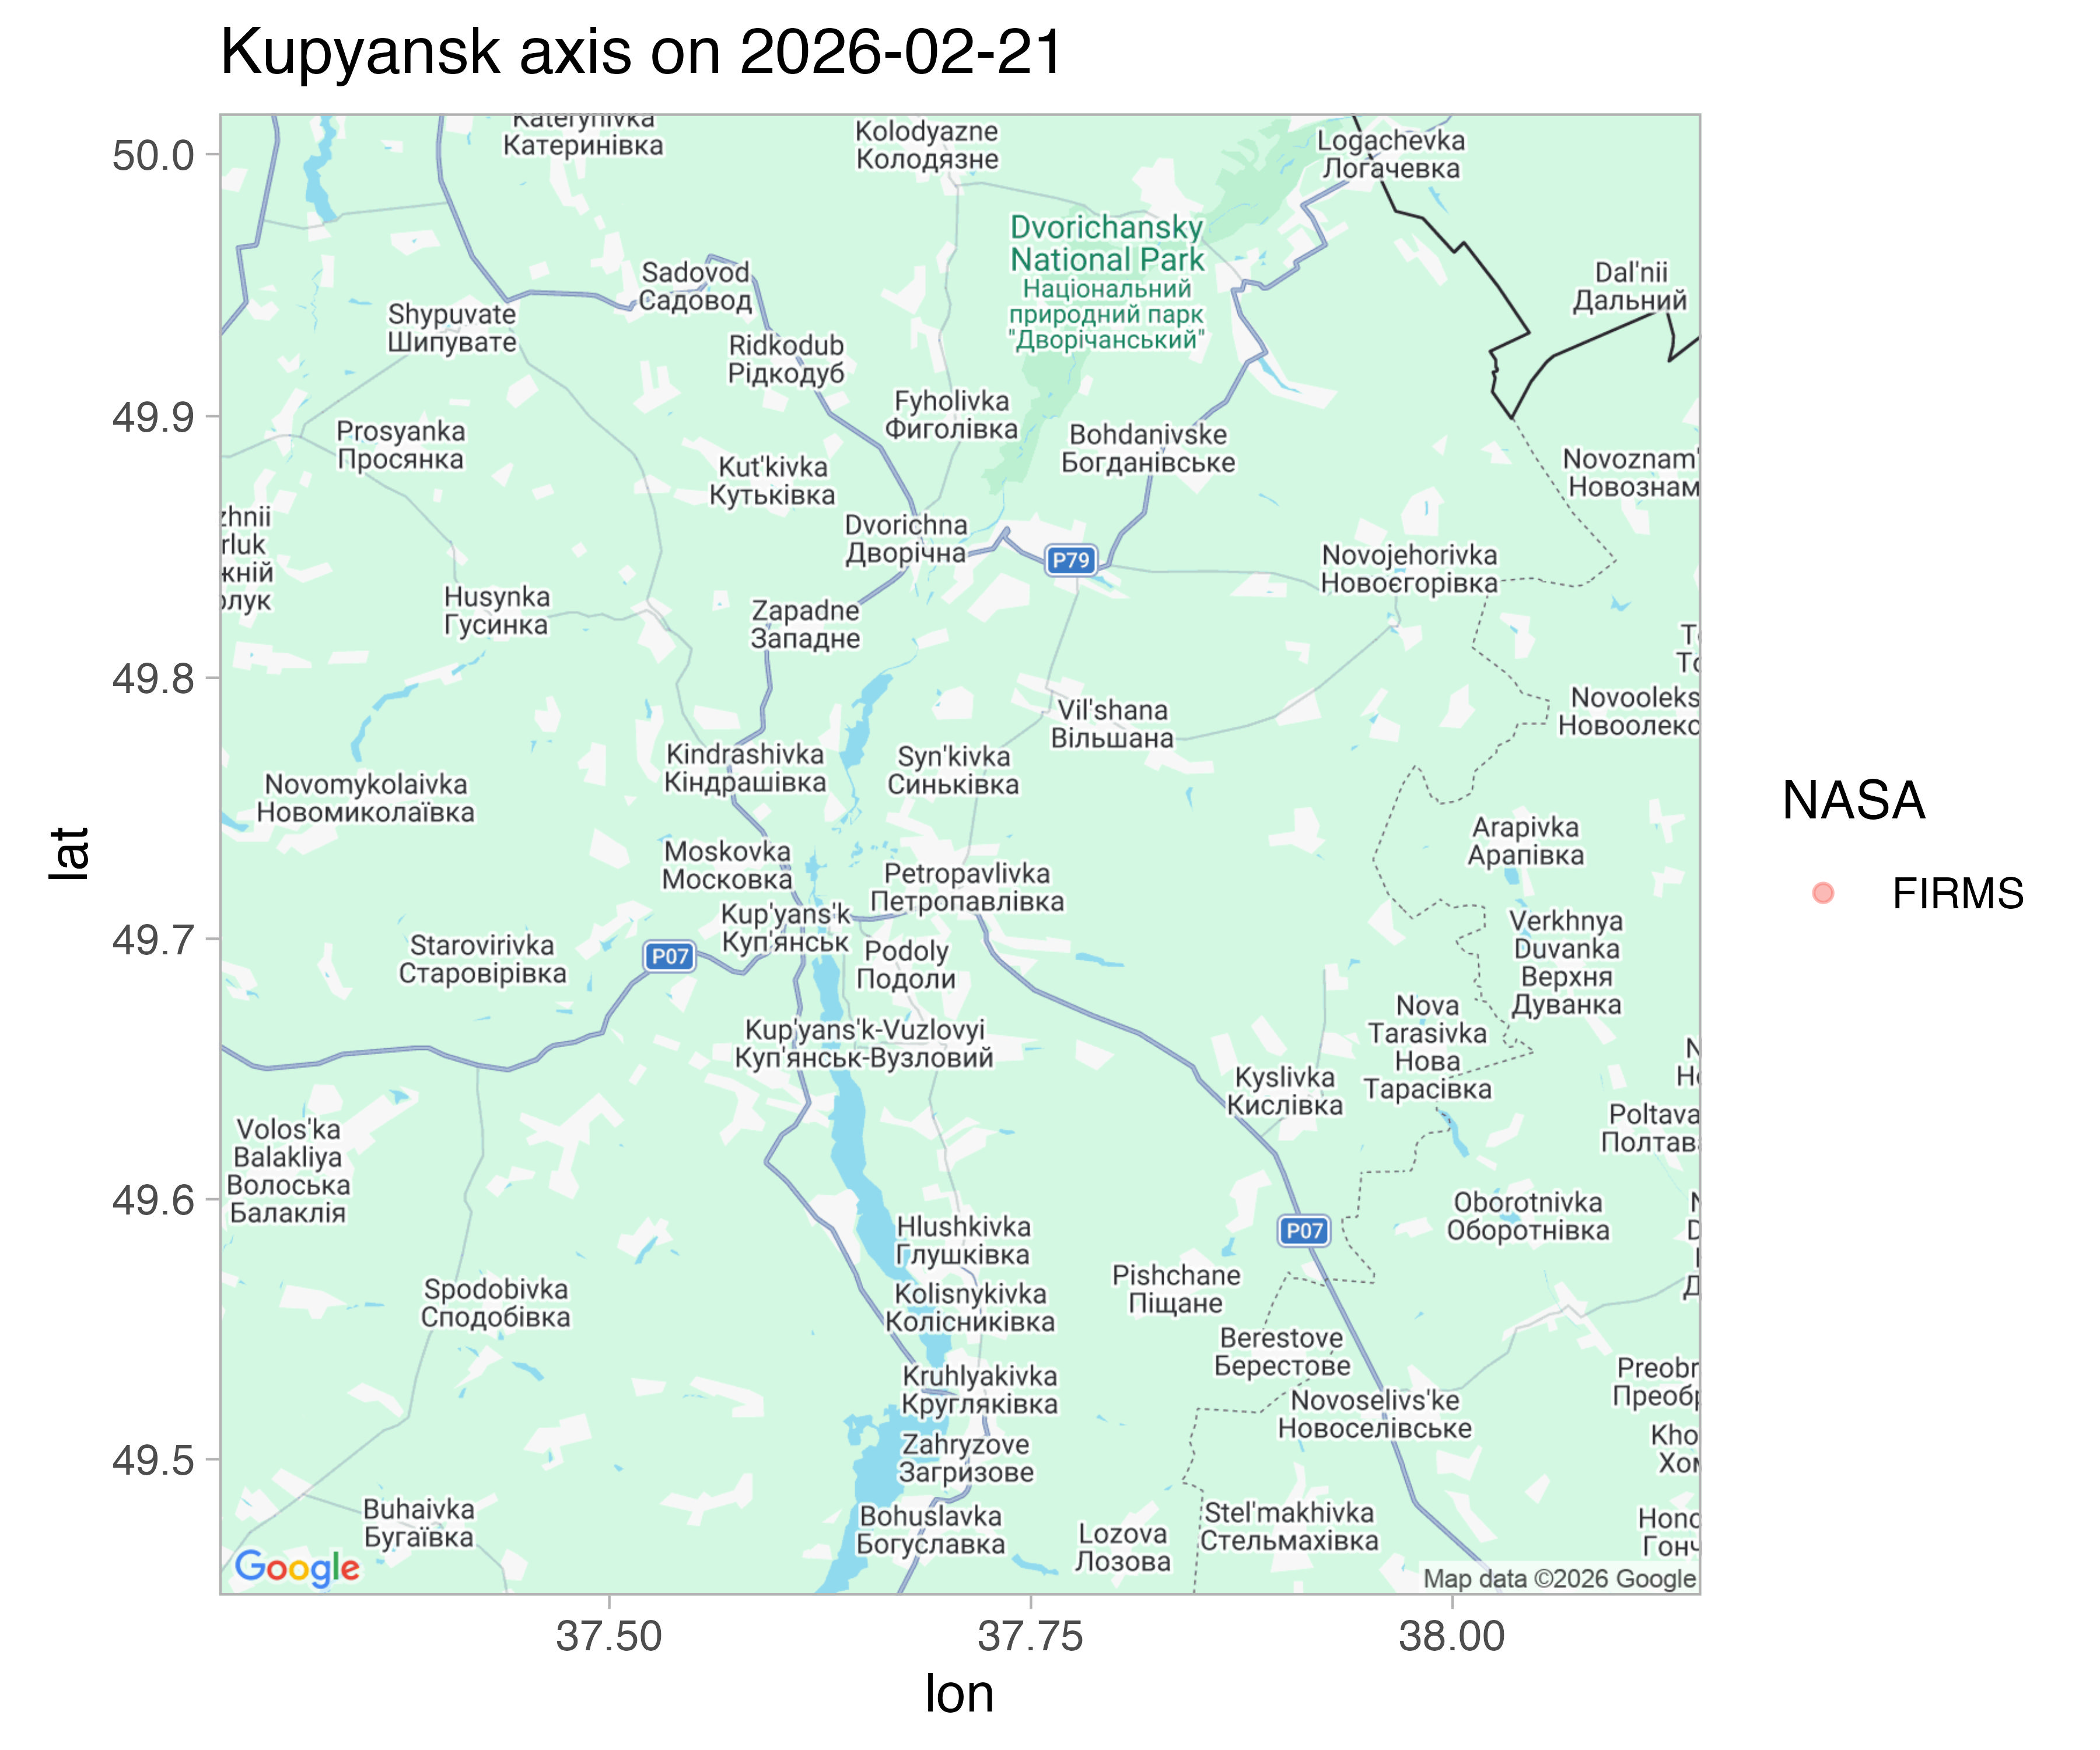 Russia launched a localized offensive near Kupyansk in summer of 2023, though mainy gains have since been reversed.
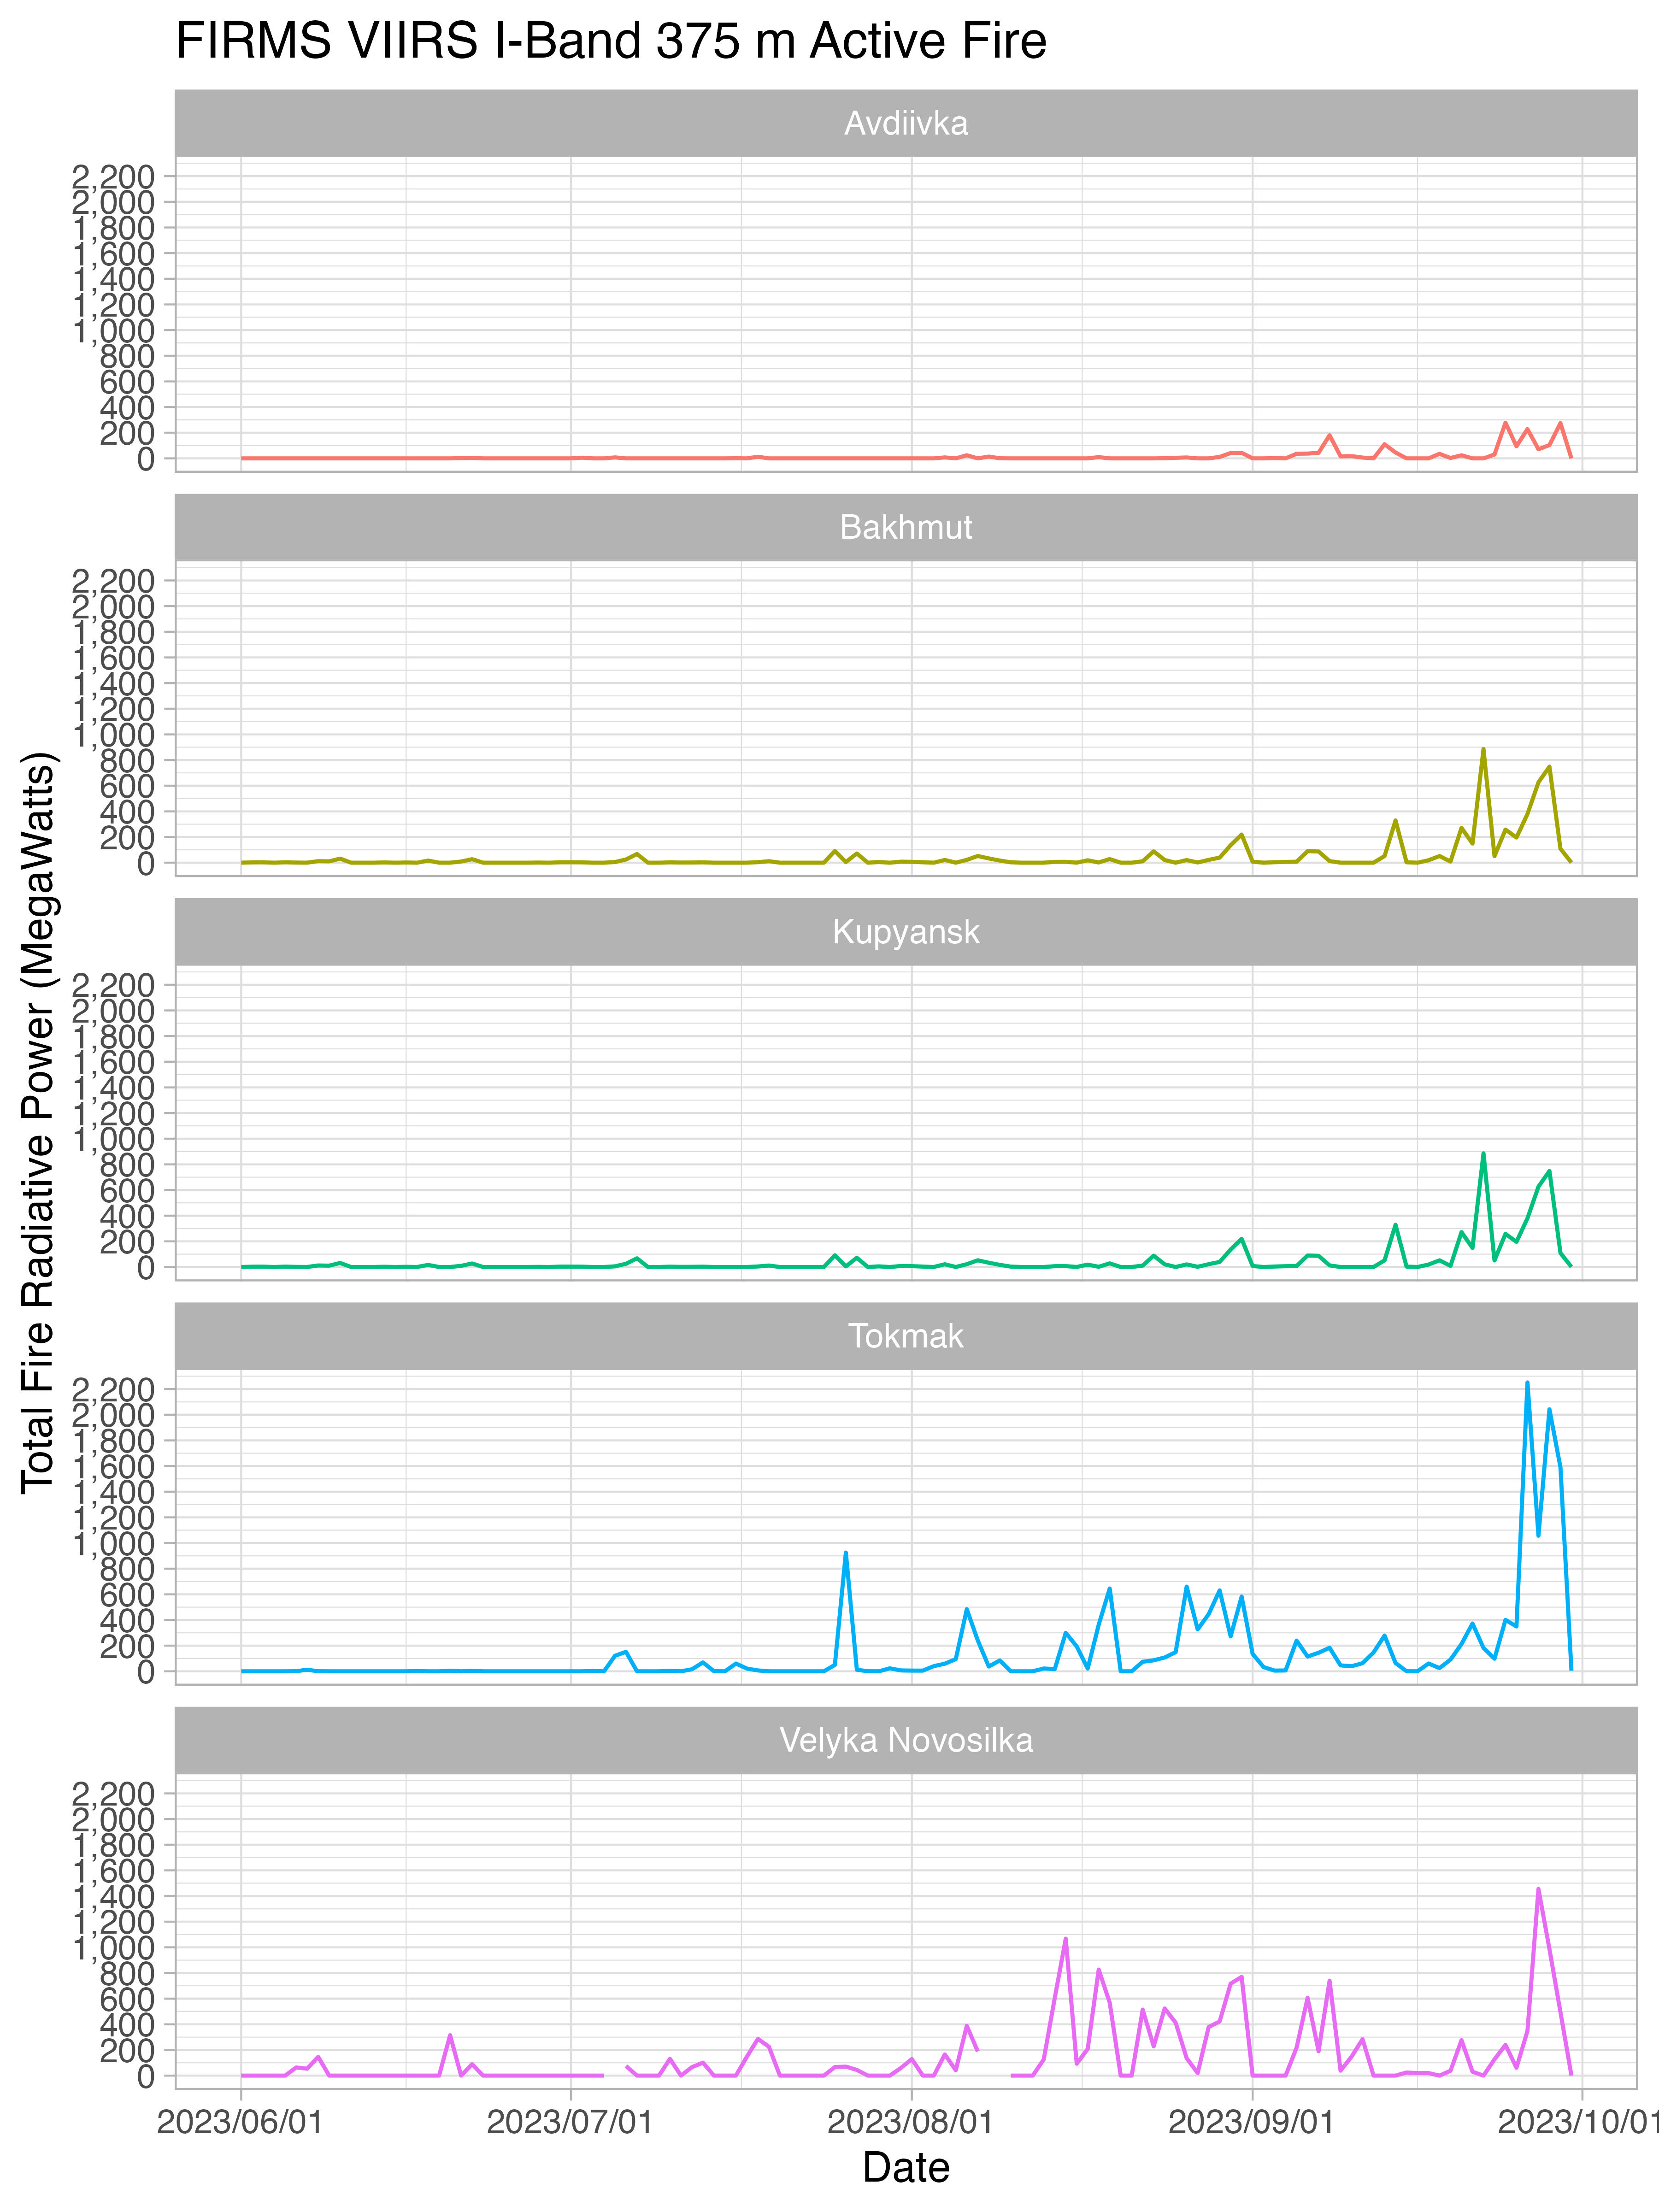
An extended discussion of how to evaluate these analyses are here. In general, the fire radiative power Plots/2023-06-01/ (FRP) are a useful guide to activity, with the lull in IR emissions in late 2022/early 2023 representing a change in how Russia used its artillery.
Map data is provided using a Google maps base layer with troop locations from Henry Schlottman's GitHub repo. Fire data comes from NASA FIRMS VIIRS satellite.
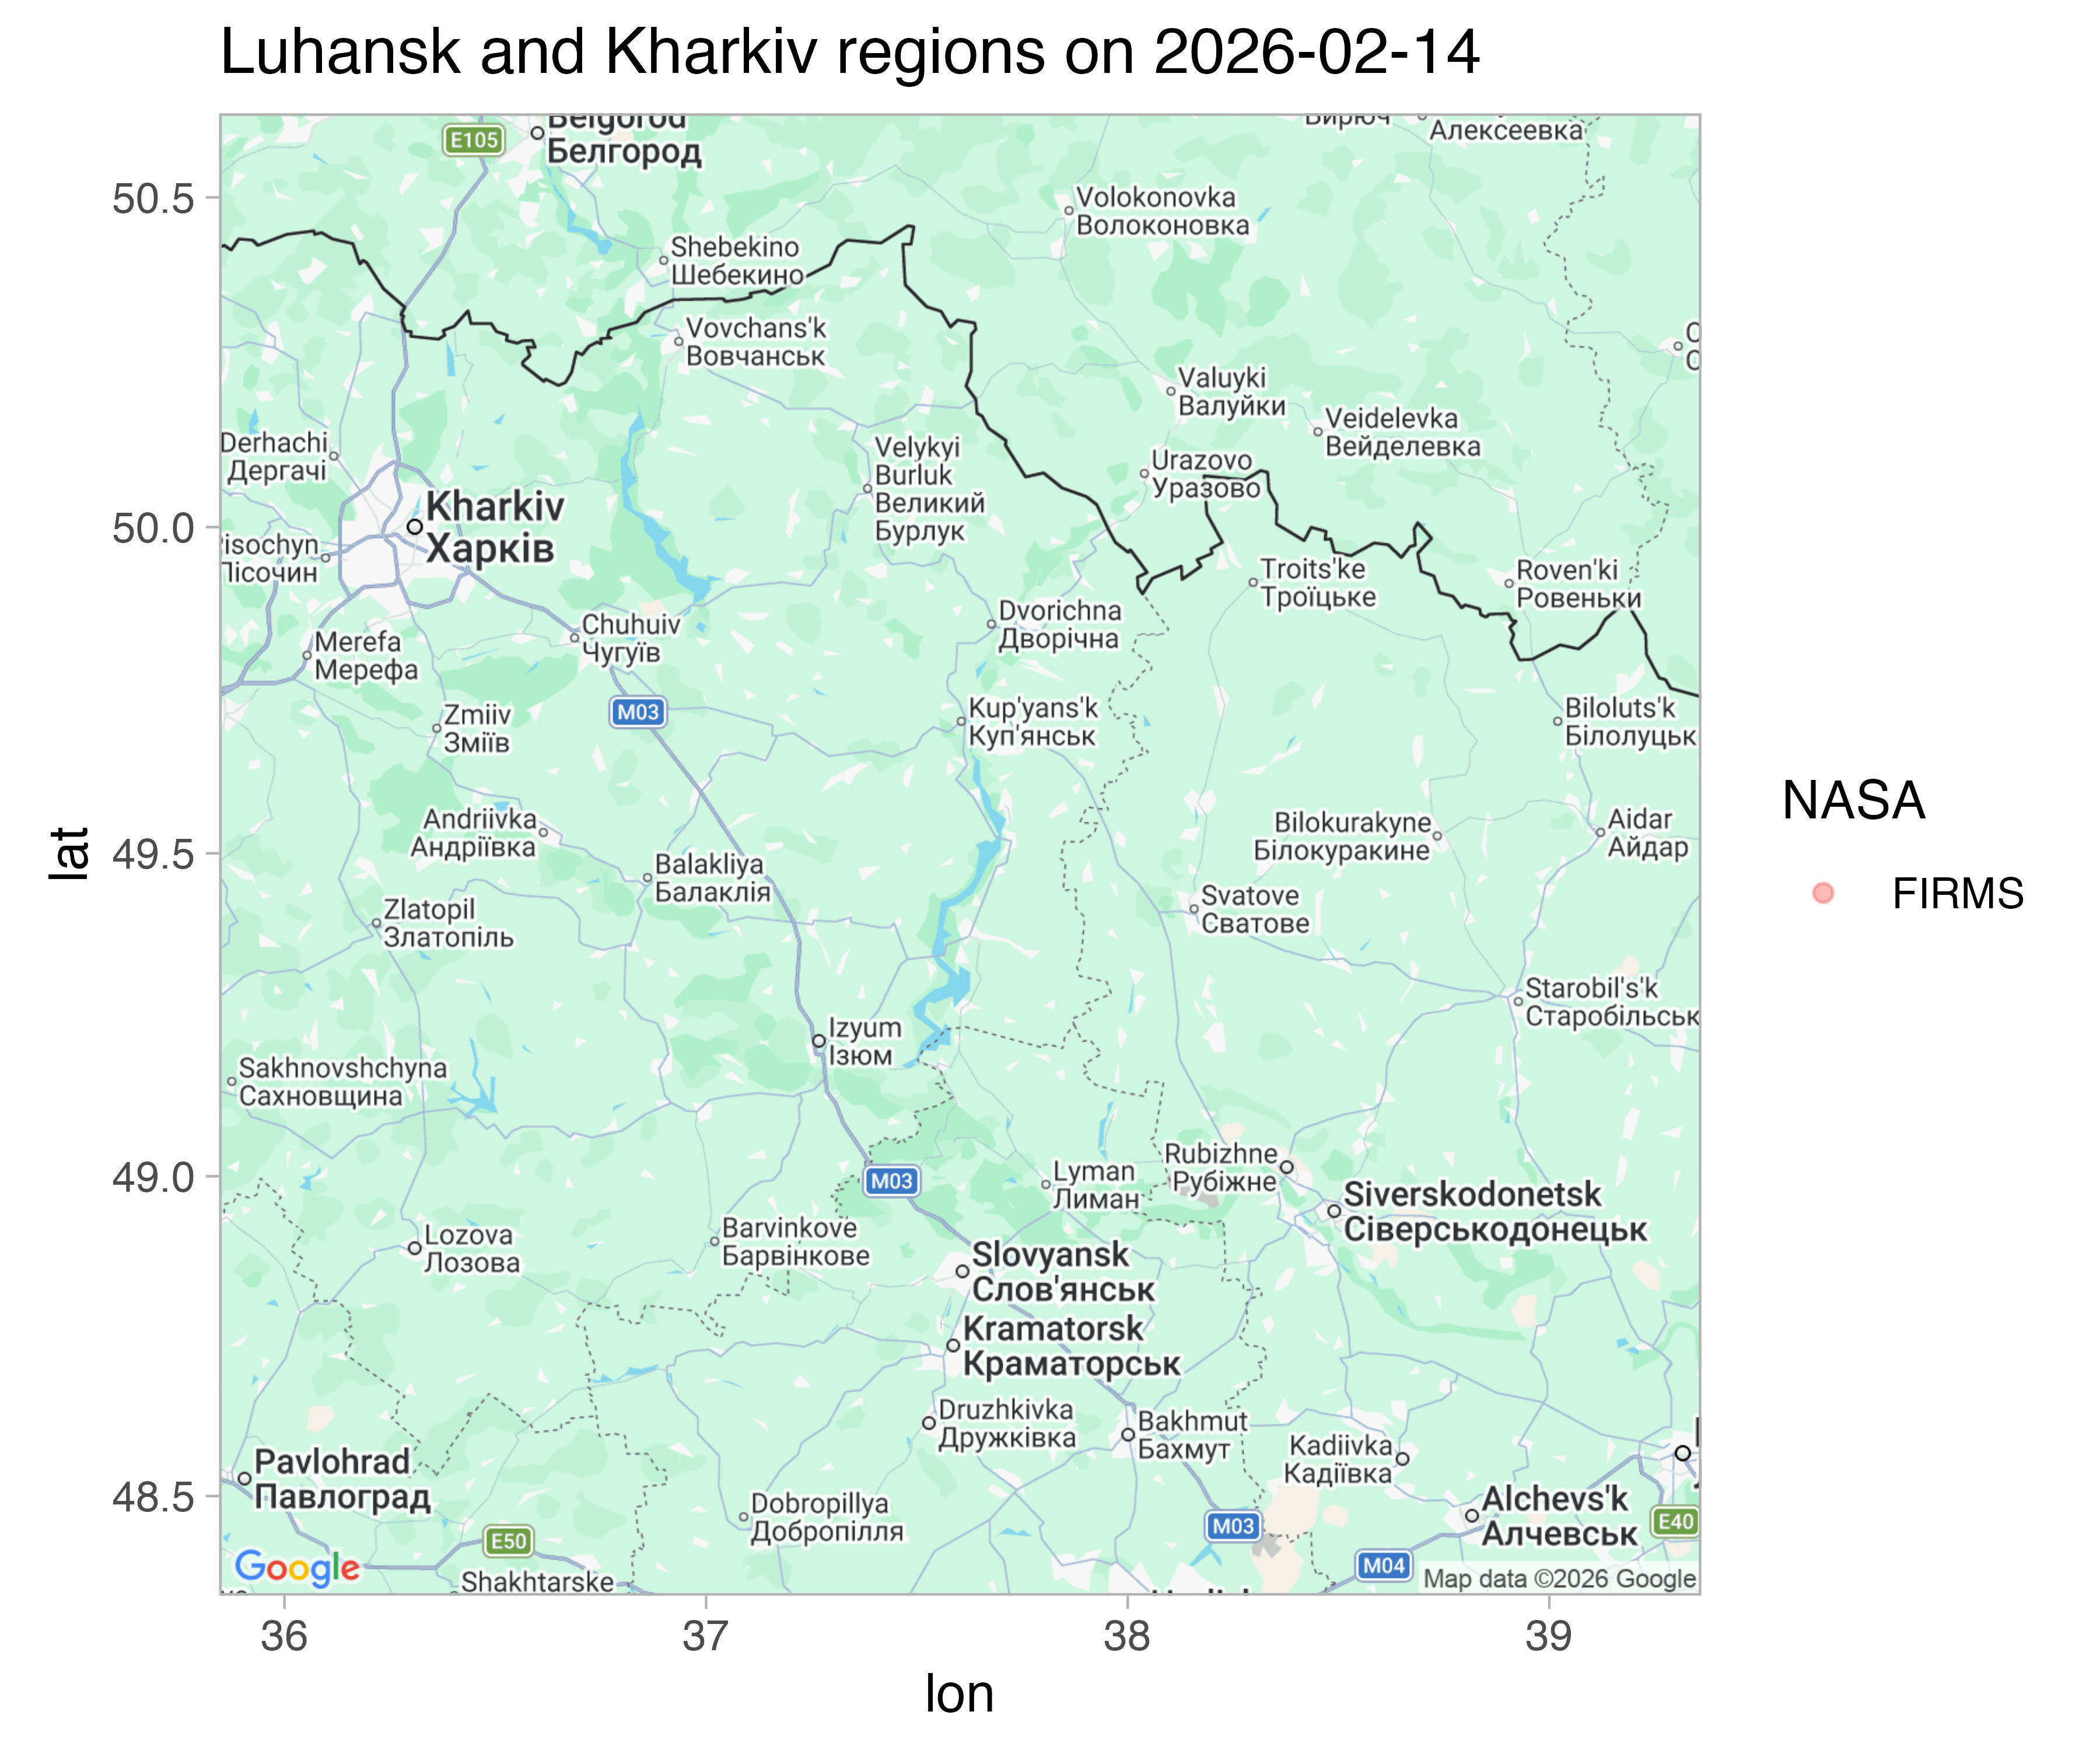 Russia has concentrated most of its combat forces in the Donbas attempting to breakthrough Ukranian lines established in 2014. FIRMS fire data indicates battles around Izyum, with some progress for Russia to the west.
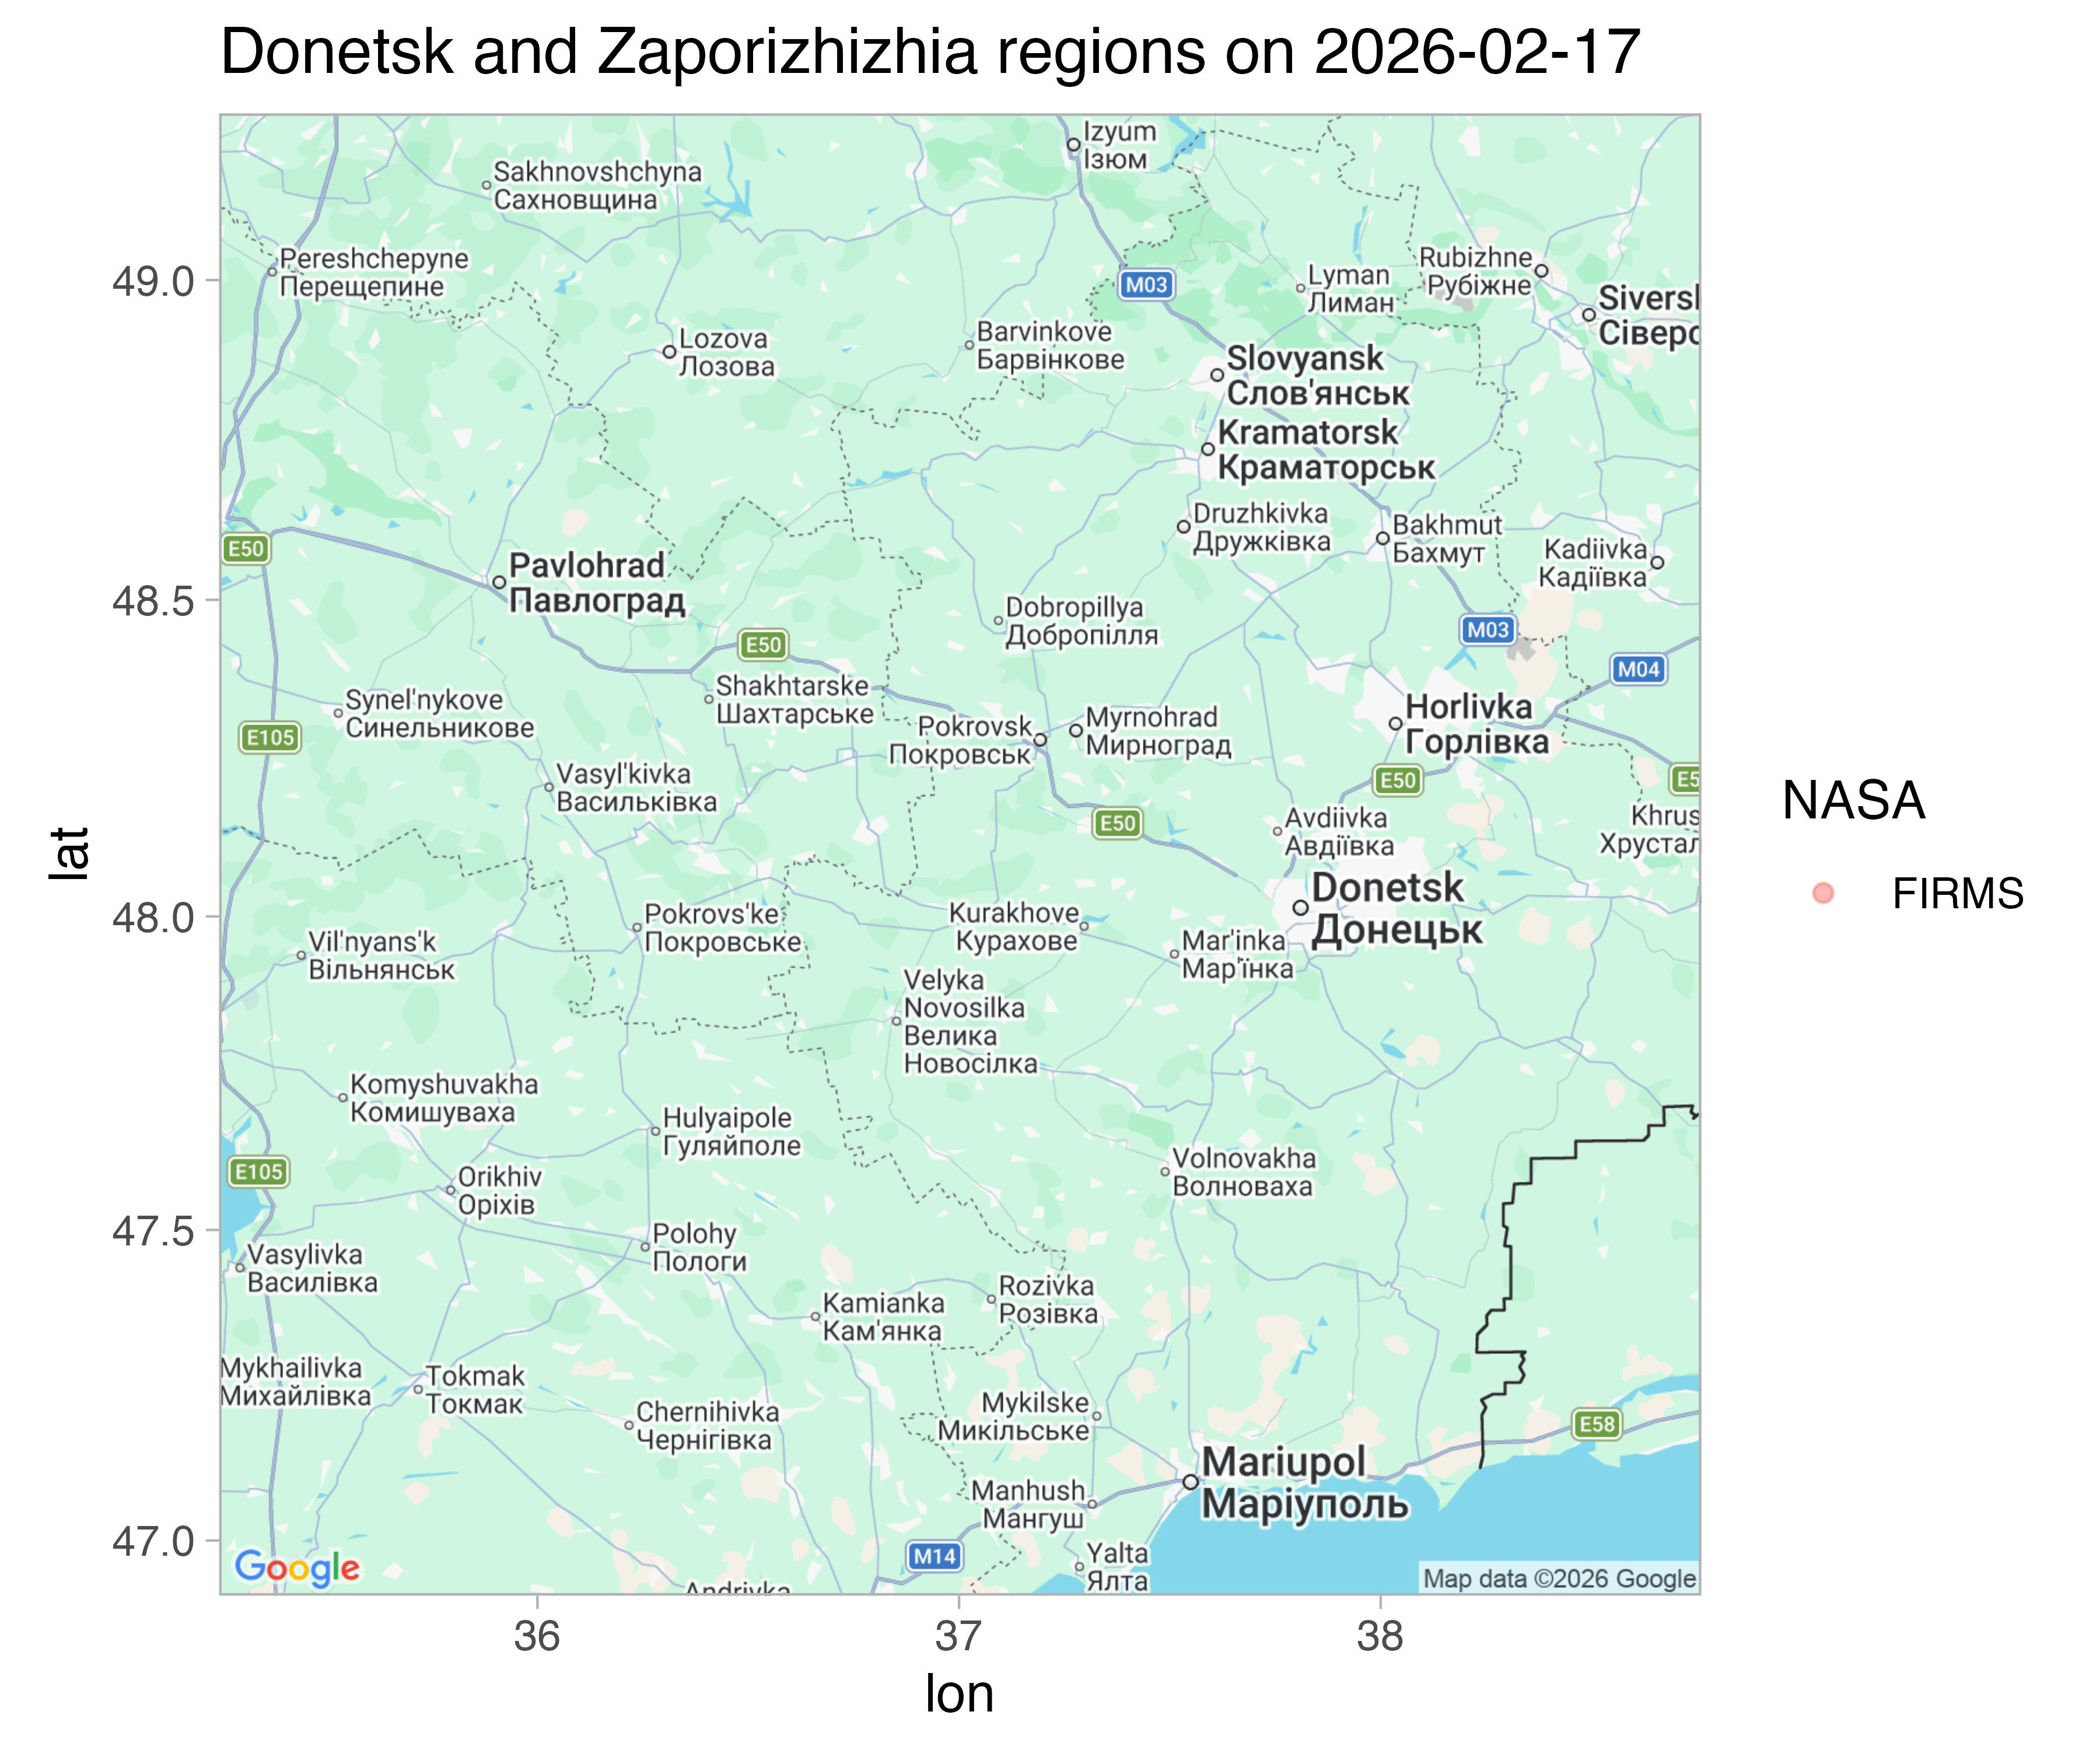 Russia has been using light infantry attacks against Ukranian settlements such as Bahkmut, resulting in much lower IR emissions compared to earlier fighting.
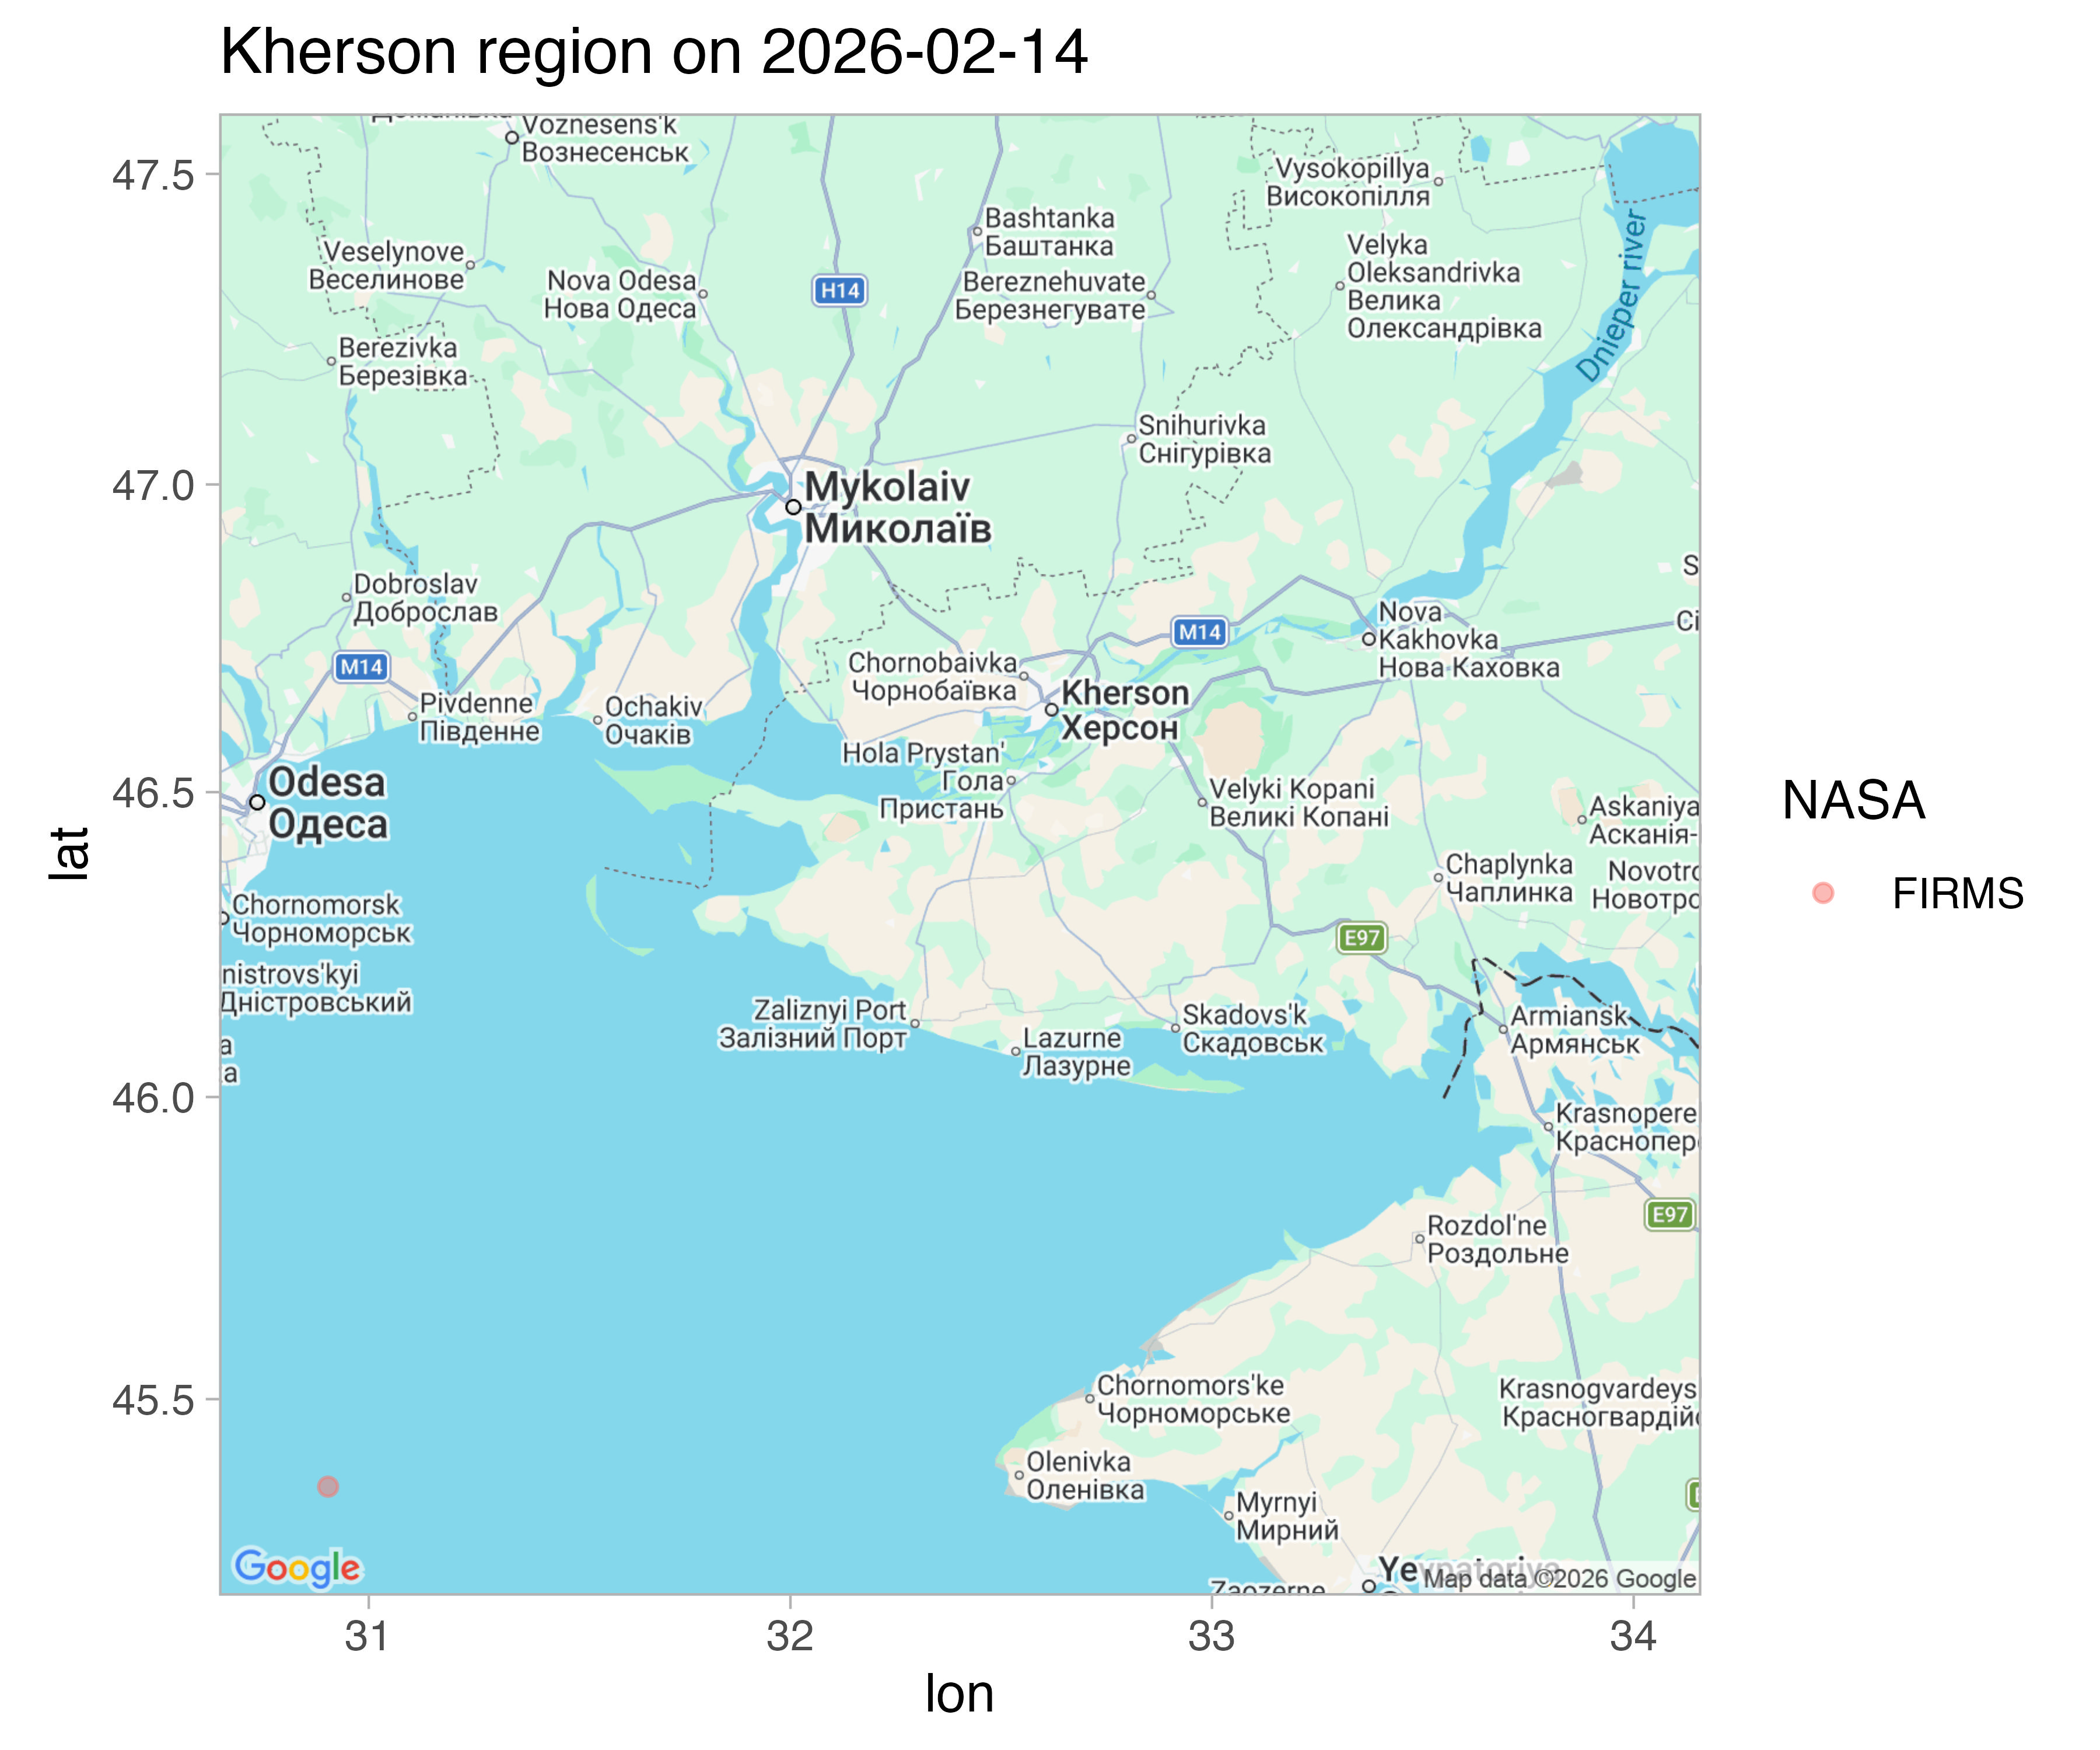 Kherson is an occupied city where the Russian advance was halted. FIRMS data does not indicate heavy combat in the area currently.
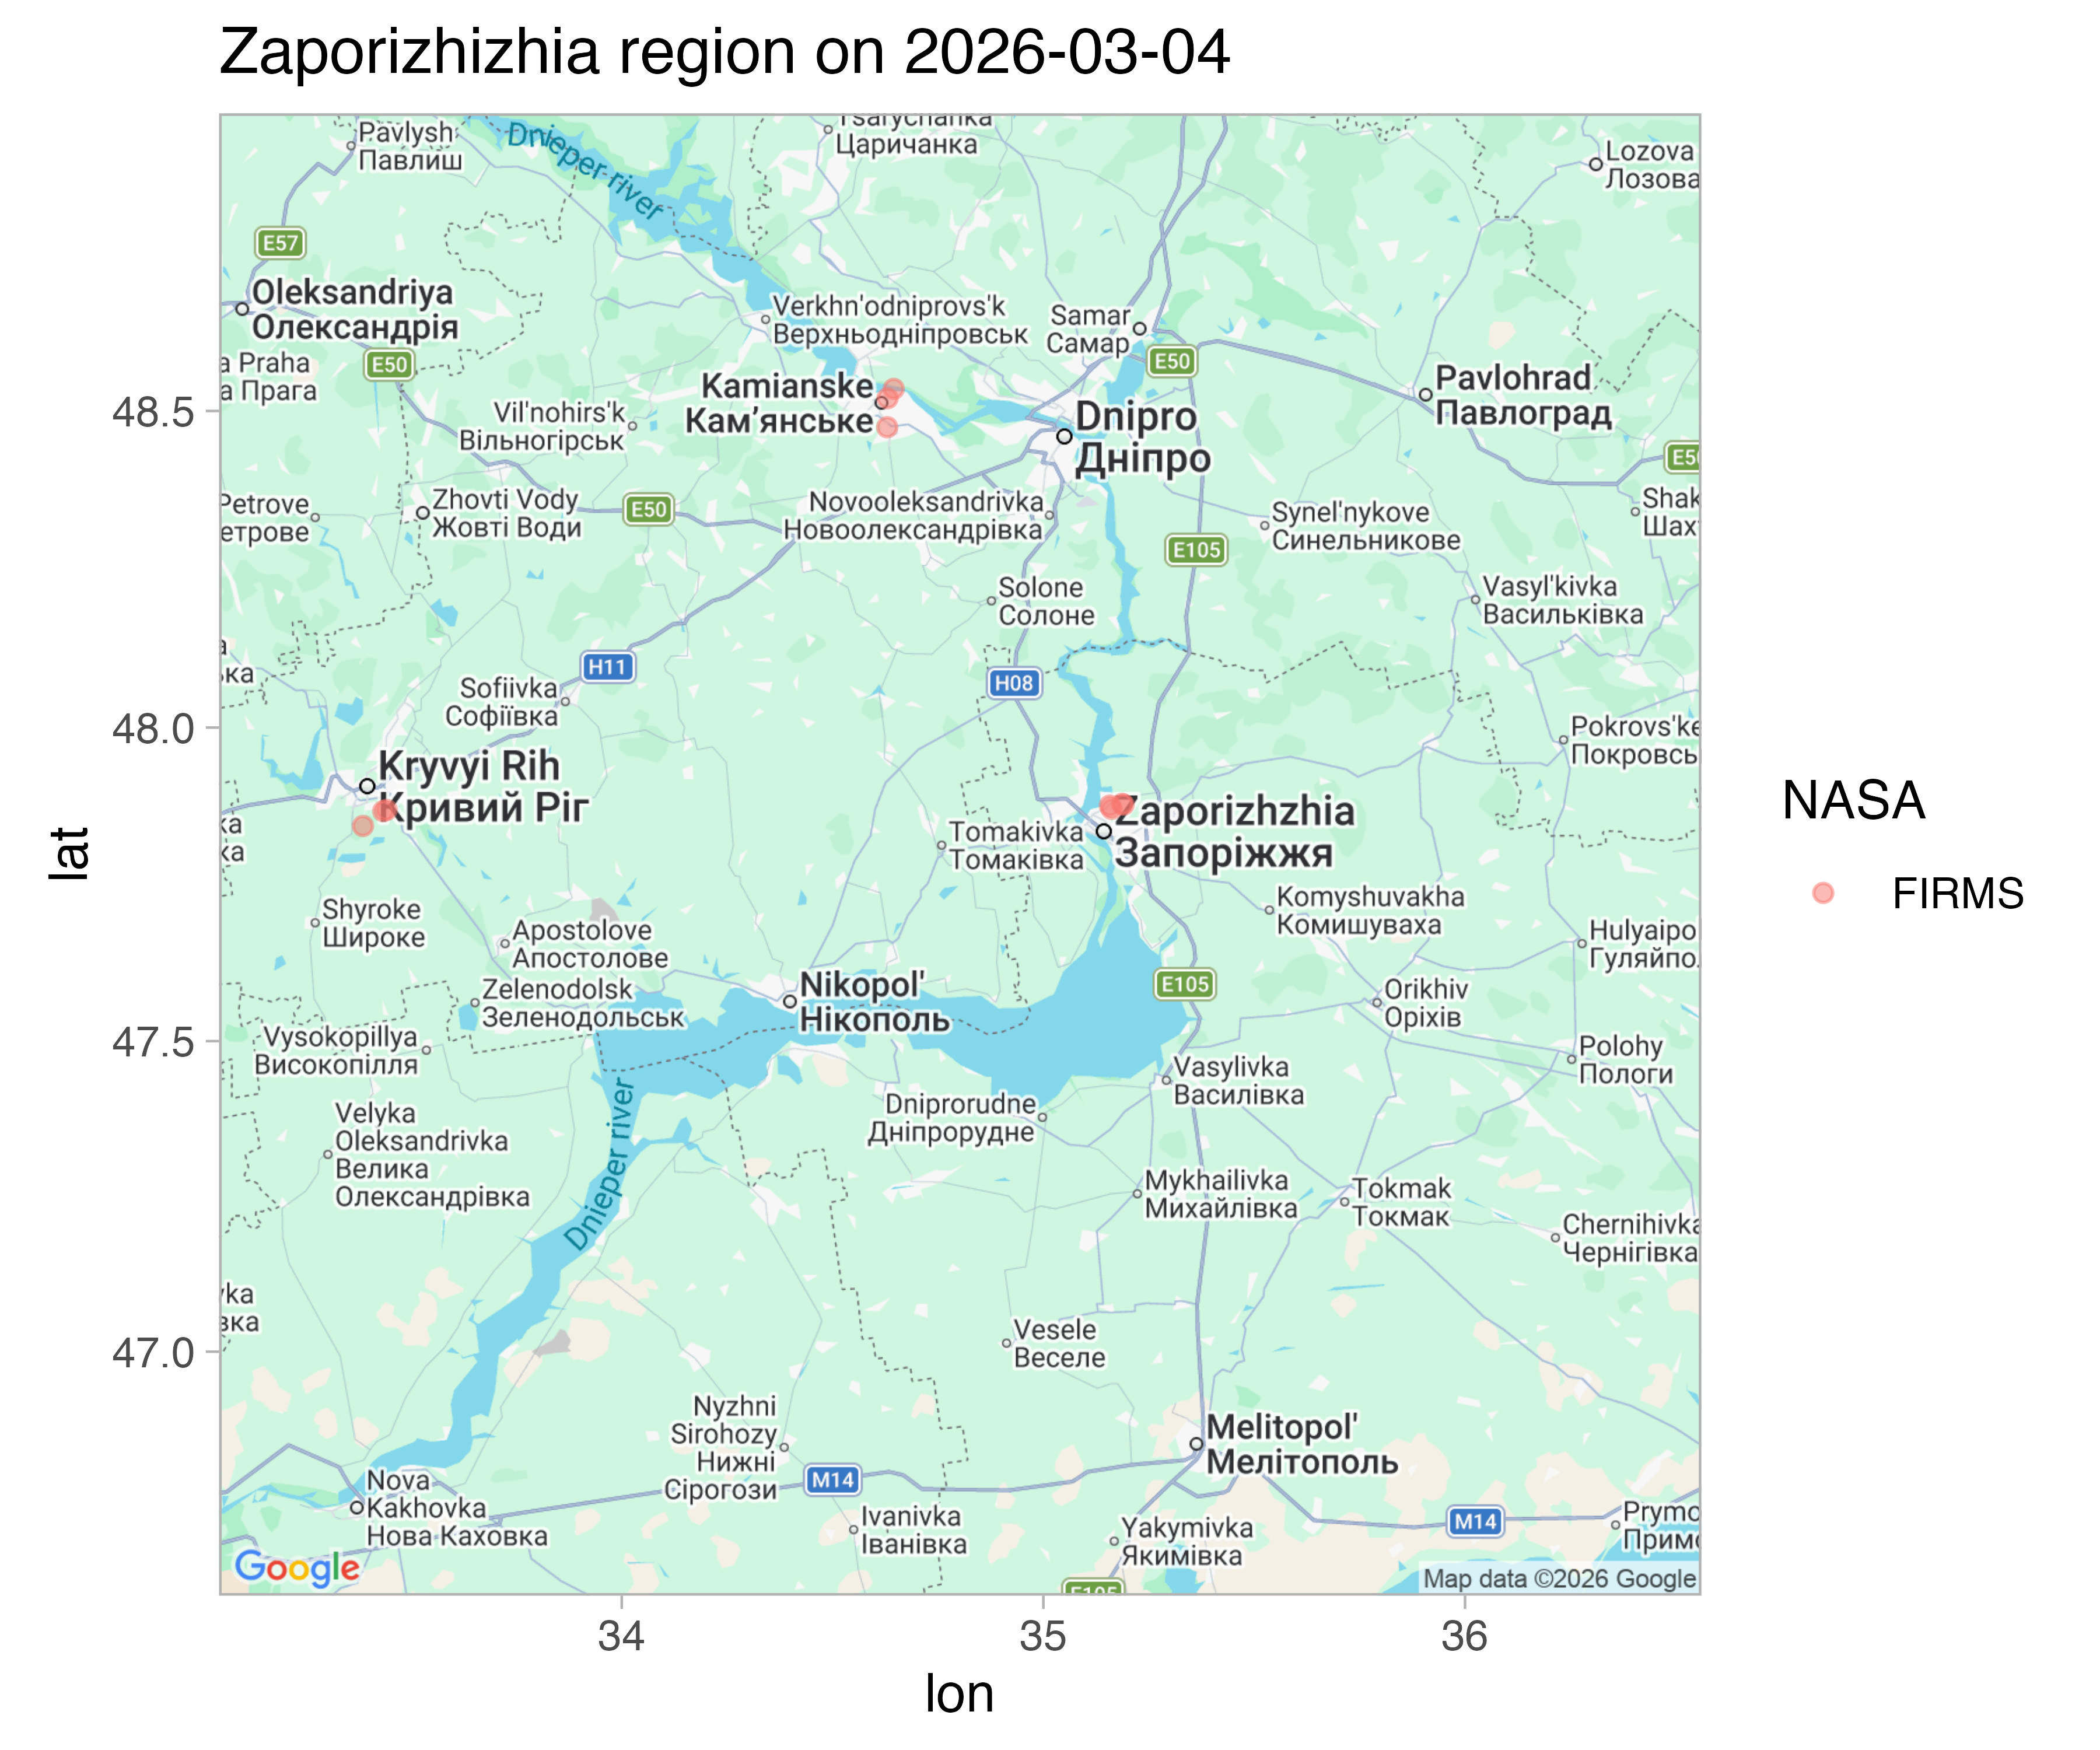 Zaporizhzhia is a comparatively quiet region, but there are isolated artillery strikes around Russian BTGs and missile strikes in population centers.
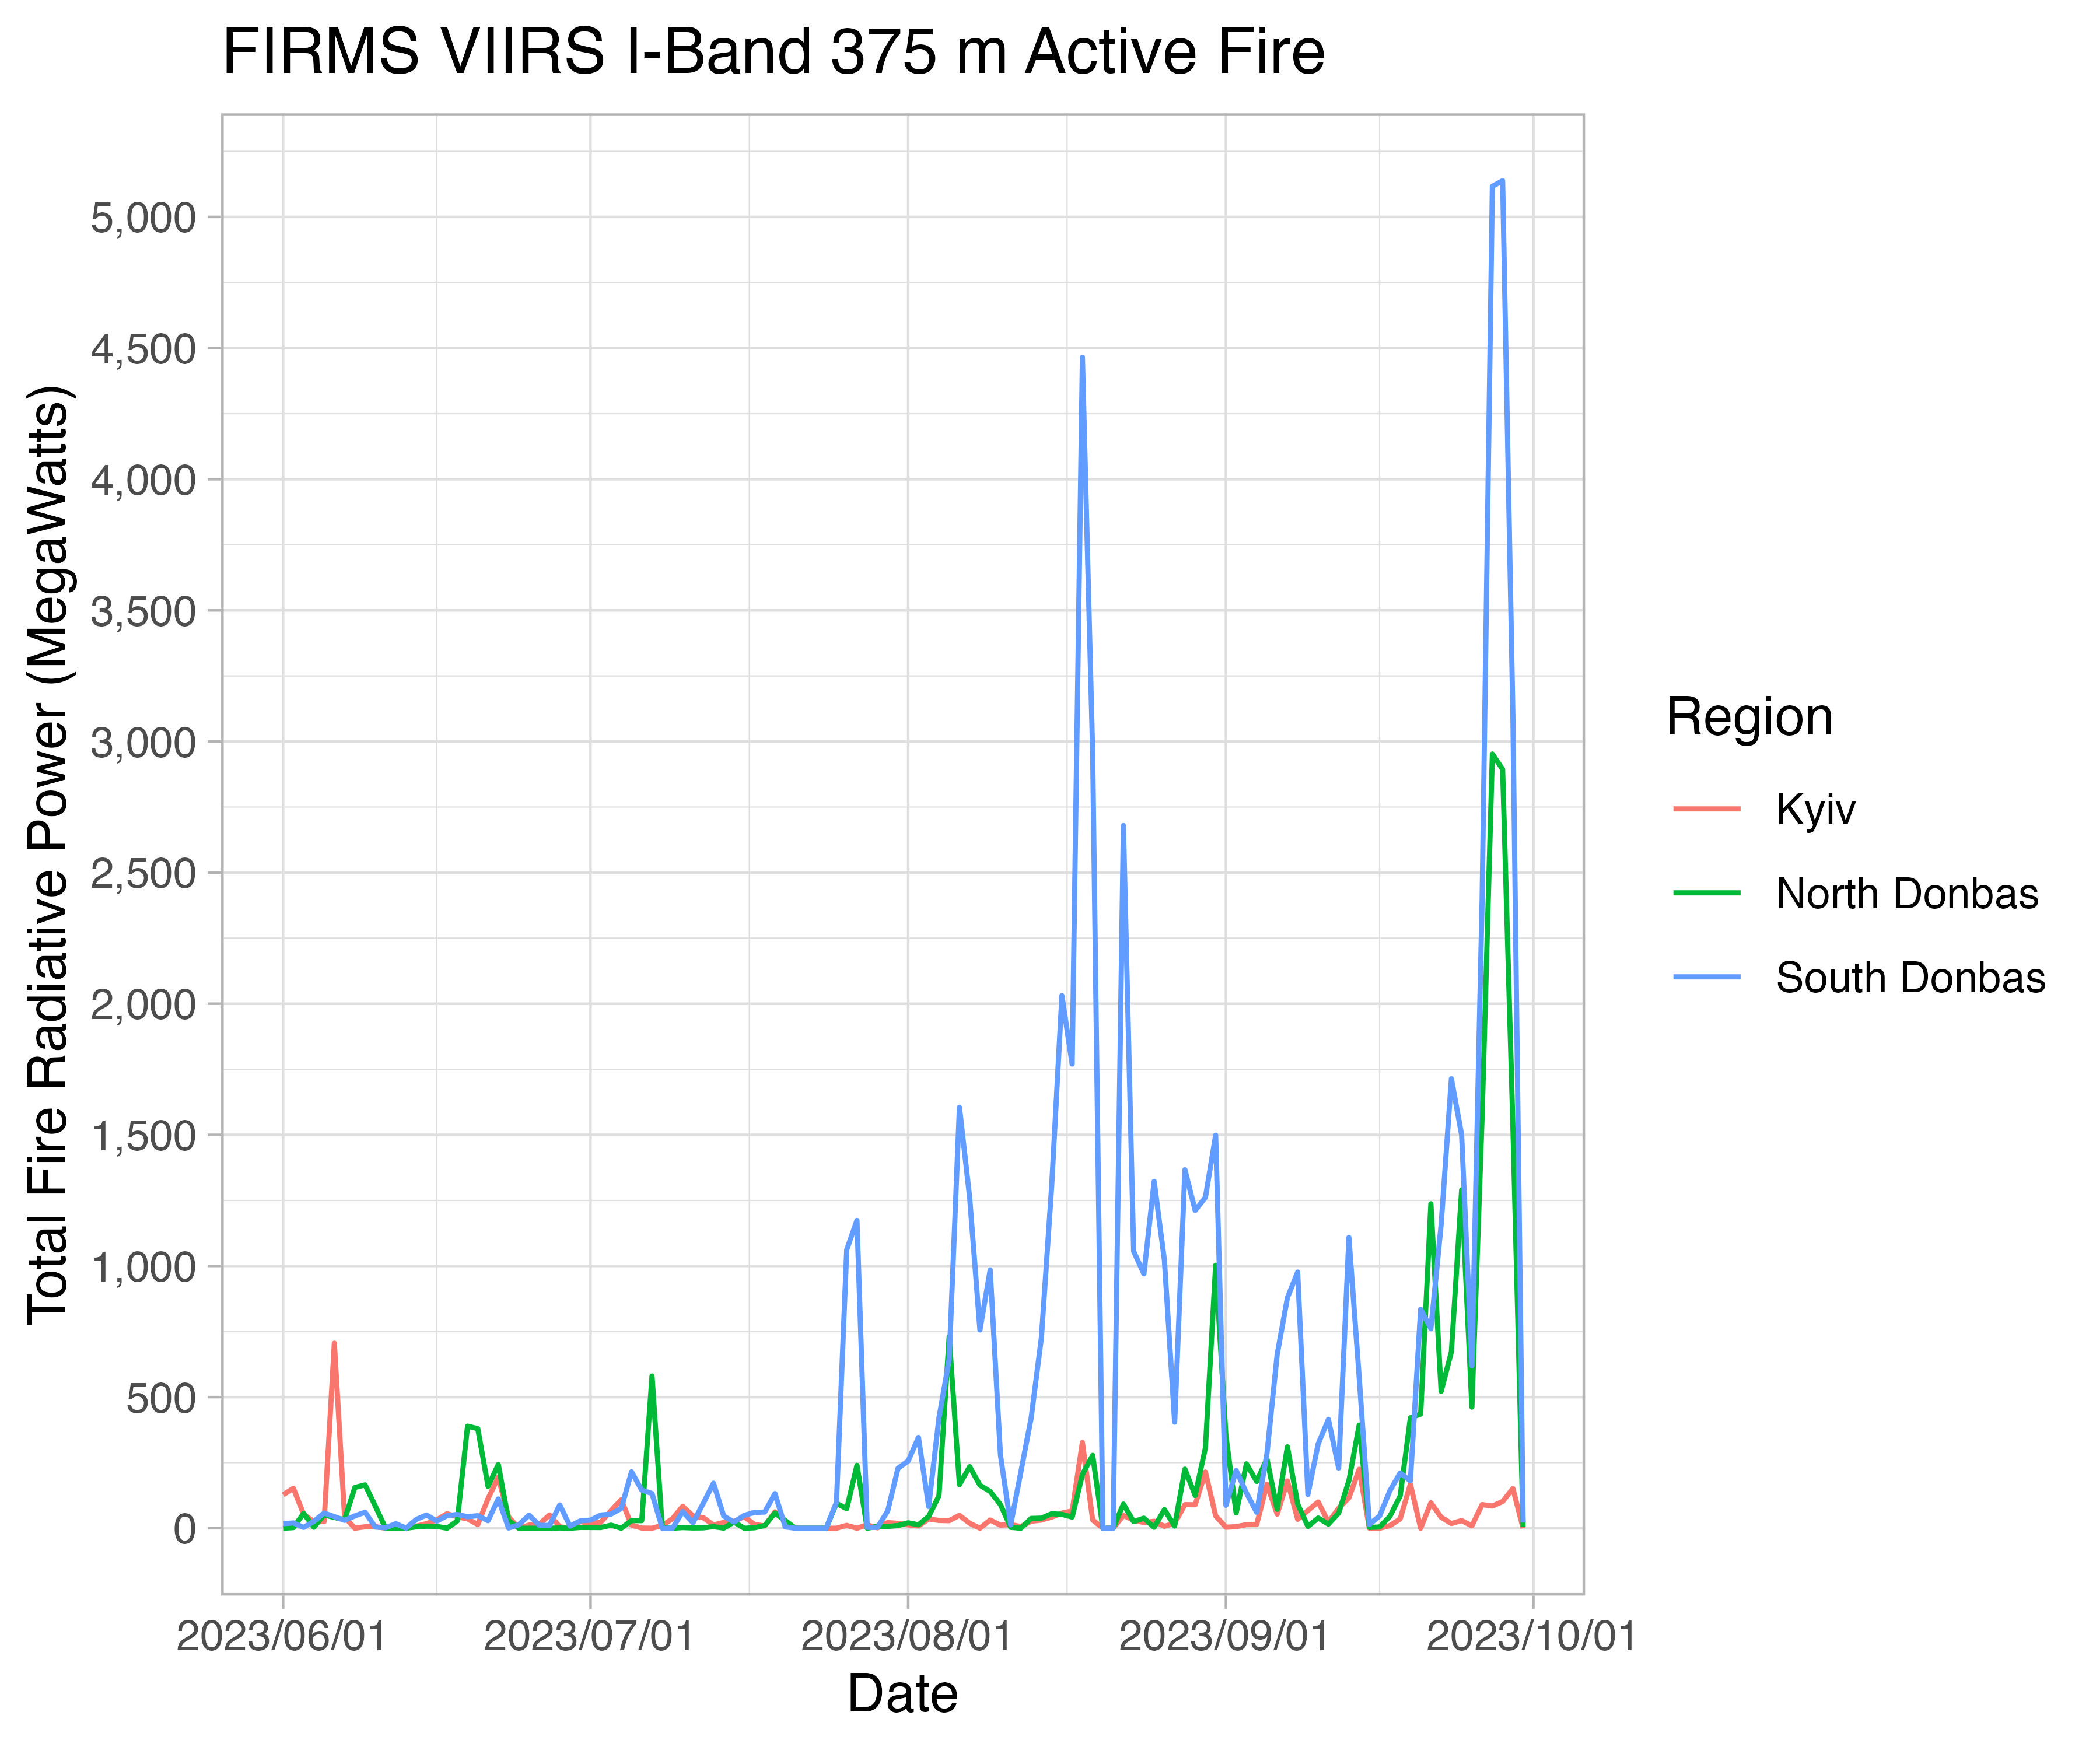 This includes Kyiv and the Donbas. Summing megawatts of energy radiated from regions of Ukraine helps highlight the independent war record. The Battle of Kyiv is clearly visible, with detectable fires concentrated in the last two weeks (March 15th - April 1st). The Battle of Donbas, following a repositioning of Russian forces, shows a more brief but just as intense spike in radiation confined to the first two weeks of May, followed by continues IR emissions into the fall. These IR emissions drop off rapidly following the successful Ukrainian Kharkiv offensive in the region in early September 2022.
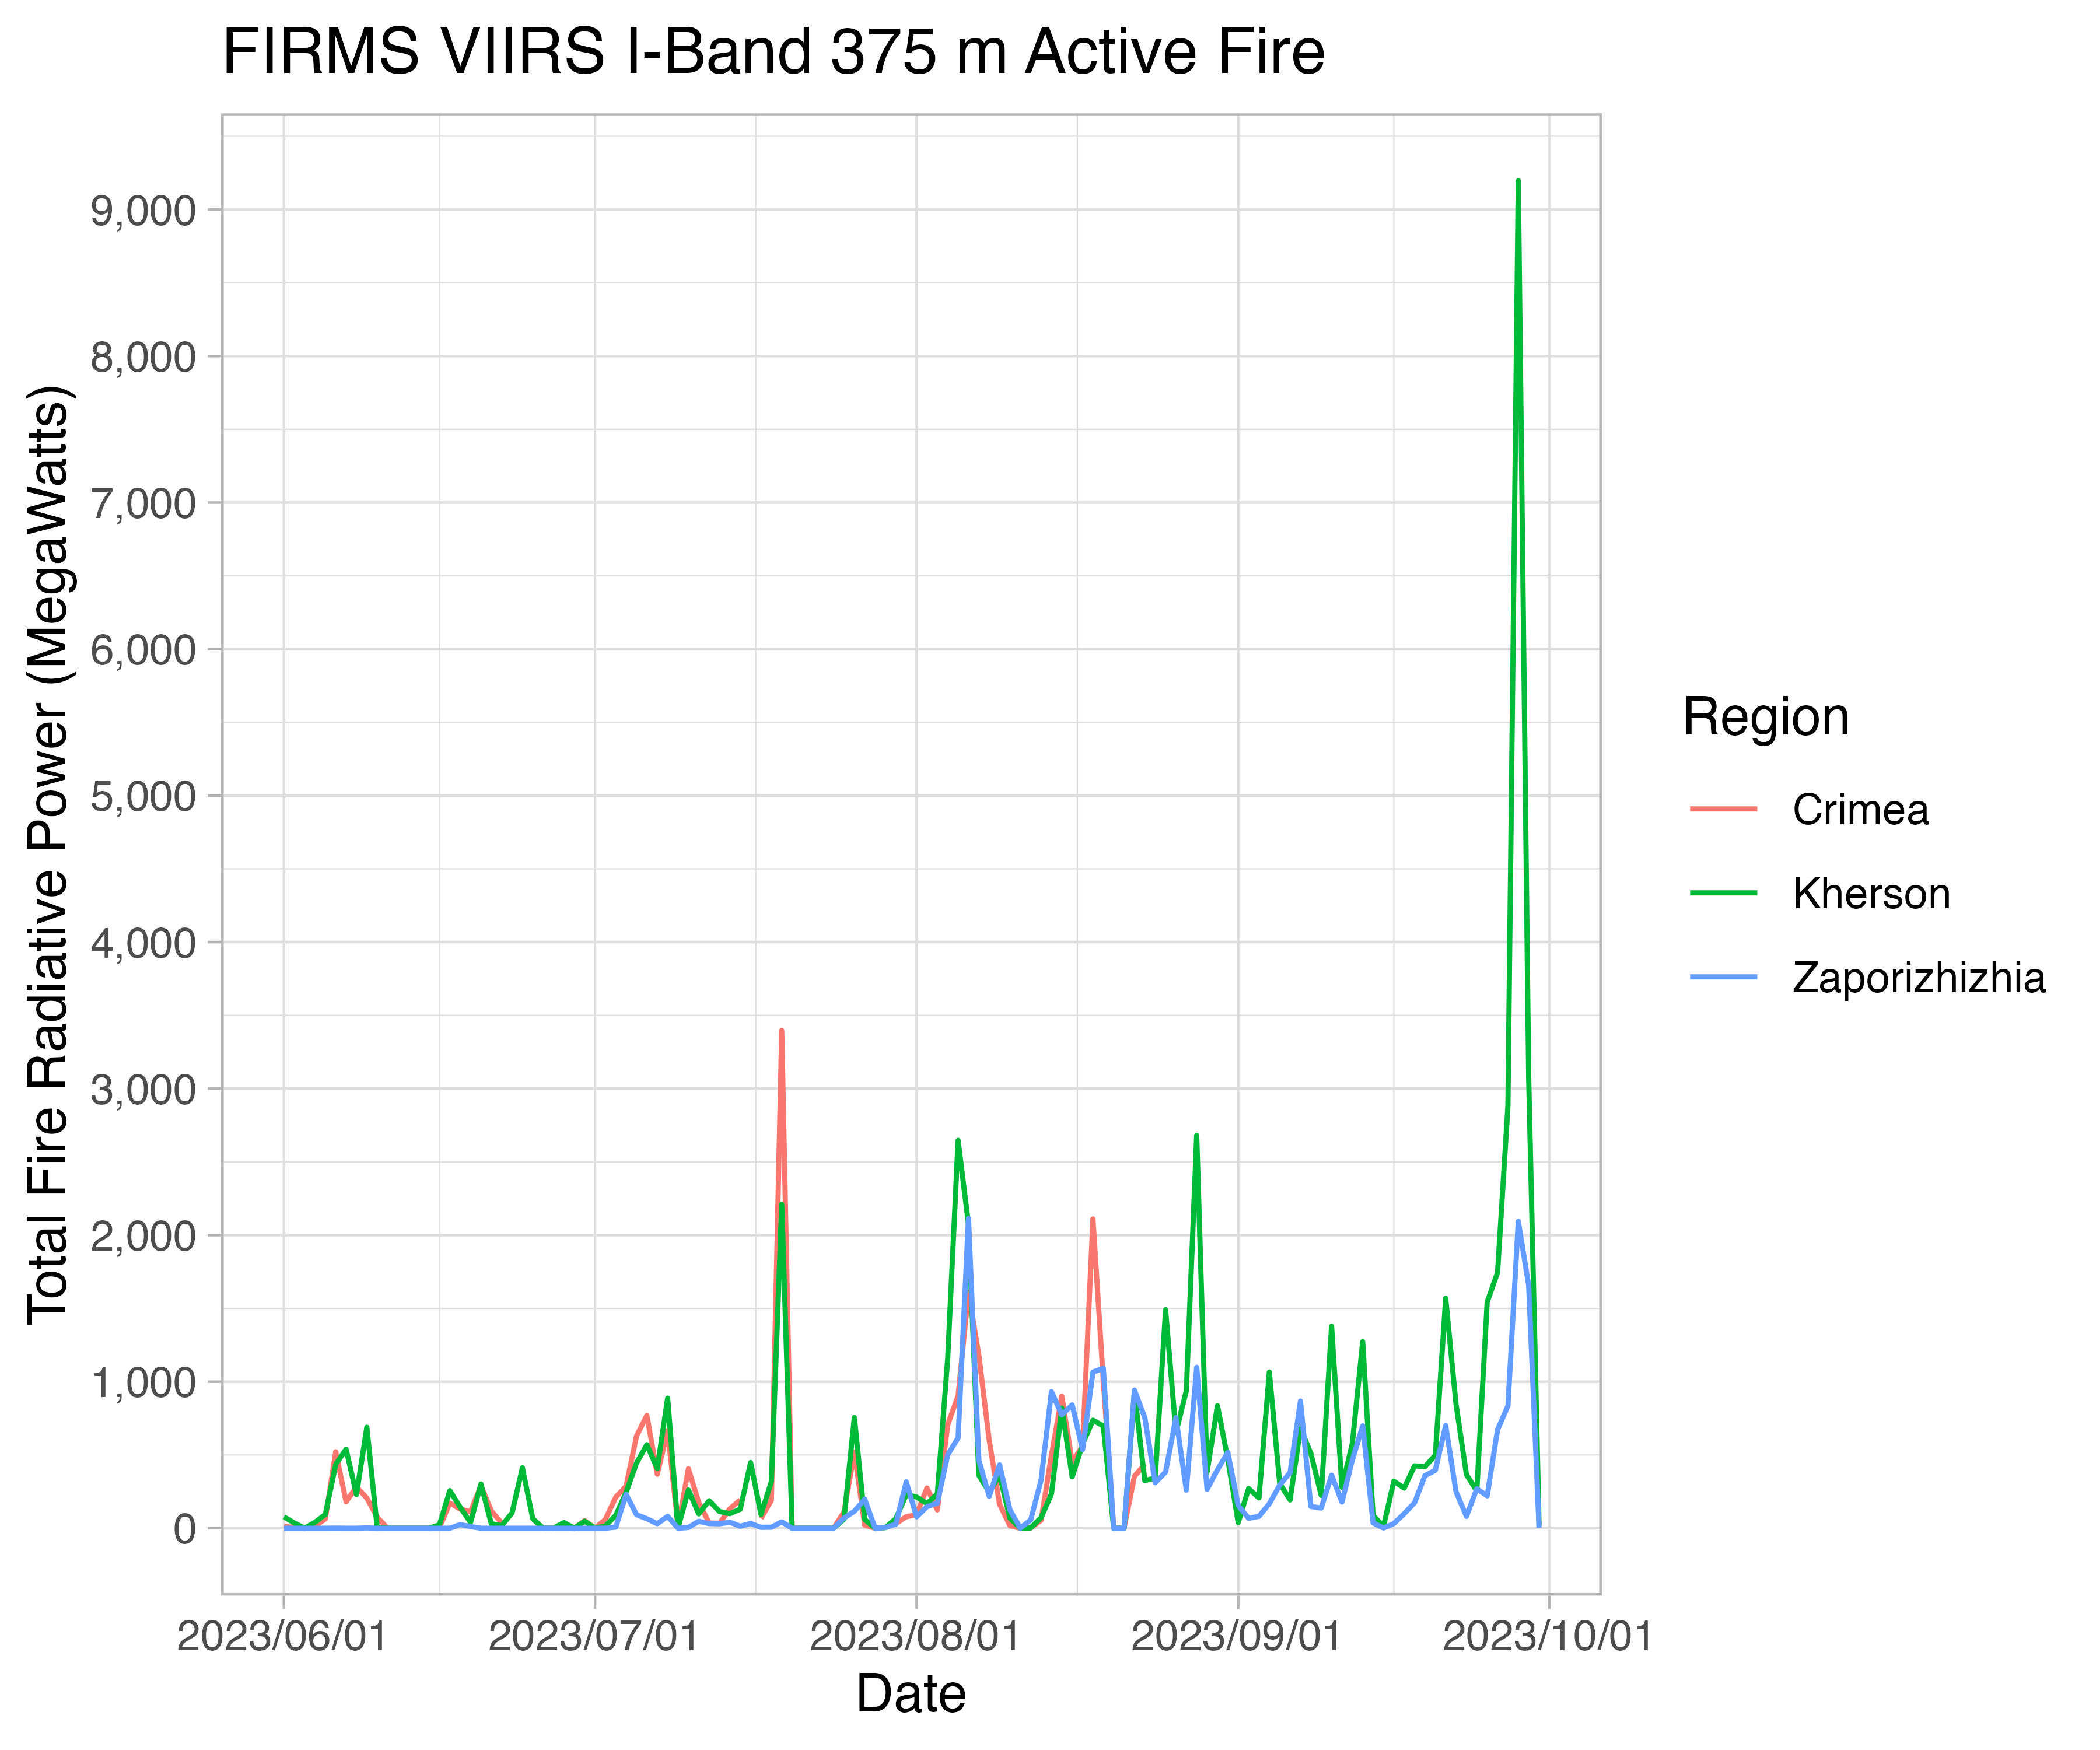 This region includes Kherson, Zaporizhizhia, and Crimea. Maximum IR activity occured in late summer 2022, with epidosodic increases likely related to specific attacks.