How to make multicolor line/area chart? #416
Comments
|
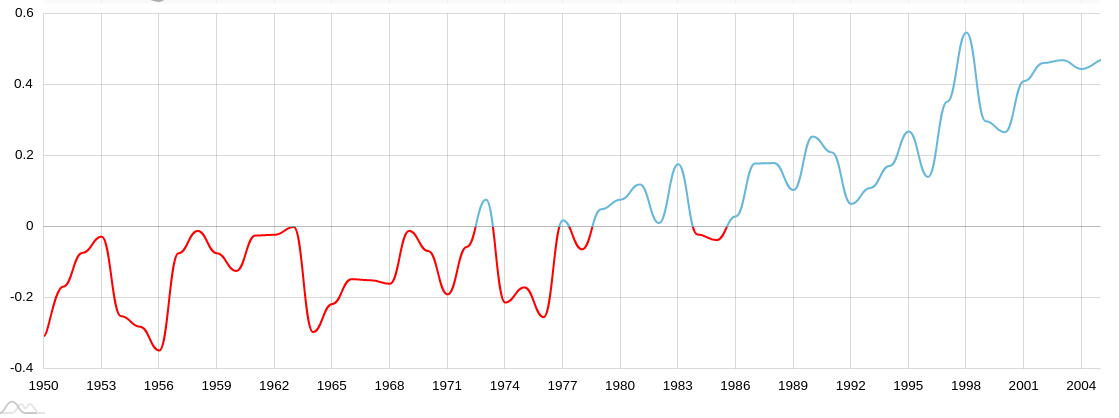
are you trying to do something like this?
lines are drawn as a single Path2D object, so it is not possible to assign different strokes to different segments. you can make this work with a bit of effort by setting the stroke to a horizontal linear CanvasGradient with hard color stops at the x value positions. it would have some similarity to this the gradient fills demo: https://leeoniya.github.io/uPlot/demos/gradient-fill.html here's how to create an hz gradient with hard stops and apply it to a stroke: https://jsfiddle.net/ezg64h1j/
var c = document.getElementById("myCanvas");
var ctx = c.getContext("2d");

var grd = ctx.createLinearGradient(0, 0, 300, 0);
grd.addColorStop(0, 'red');
grd.addColorStop(1 / 7, 'red');

grd.addColorStop(1 / 7, 'orange');
grd.addColorStop(2 / 7, 'orange');

grd.addColorStop(2 / 7, 'yellow');
grd.addColorStop(3 / 7, 'yellow');

grd.addColorStop(3 / 7, 'green');
grd.addColorStop(4 / 7, 'green')

grd.addColorStop(4 / 7, 'blue');
grd.addColorStop(5 / 7, 'blue');

grd.addColorStop(5 / 7, 'indigo');
grd.addColorStop(6 / 7, 'indigo');

grd.addColorStop(6/7, 'violet');
grd.addColorStop(1, 'violet');


ctx.strokeStyle = grd;
ctx.beginPath();
ctx.moveTo(0,0);

ctx.lineTo(1/7 * 300, 200);
ctx.lineTo(2/7 * 300, 0);
ctx.lineTo(3/7 * 300, 200);
ctx.lineTo(4/7 * 300, 0);
ctx.lineTo(5/7 * 300, 200);
ctx.lineTo(6/7 * 300, 0);
ctx.lineTo(7/7 * 300, 200);

ctx.stroke();

//ctx.fillStyle = grd;
//ctx.fillRect(0, 0, 300, 200);
i've actually been meaning to make another red-above/blue-below demo in the same category similar to these:
|


|
Chart.js has a cool method "getPixelForValue()" which helps to make these, at the moment I need to scale stops between 0-1 and also consider my pixel range right? |
uPlot's equivalent is
right. you can get the current scale value ranges from maybe take a look at the demo i already linked ;) https://github.com/leeoniya/uPlot/blob/master/demos/gradient-fill.html |
I was wonder if we can use multi-color for just one data set, I tried a list of colors but nothing happens:
The text was updated successfully, but these errors were encountered: