tutorial : Build a local solar PV plant monitoring system with Home Assistant and Grafana
This tutorial introduces an open source project, that you can build your own solar PV plant monitoring system by using bi-directional WiFi energy meter and some open source platforms including Home Assistant, InfluxDB and Grafana.
http://ha.iammeter.com:13000/ or http://grafana.iammeter.com
User name: iammeter
Password: iammeter
![System Overview]
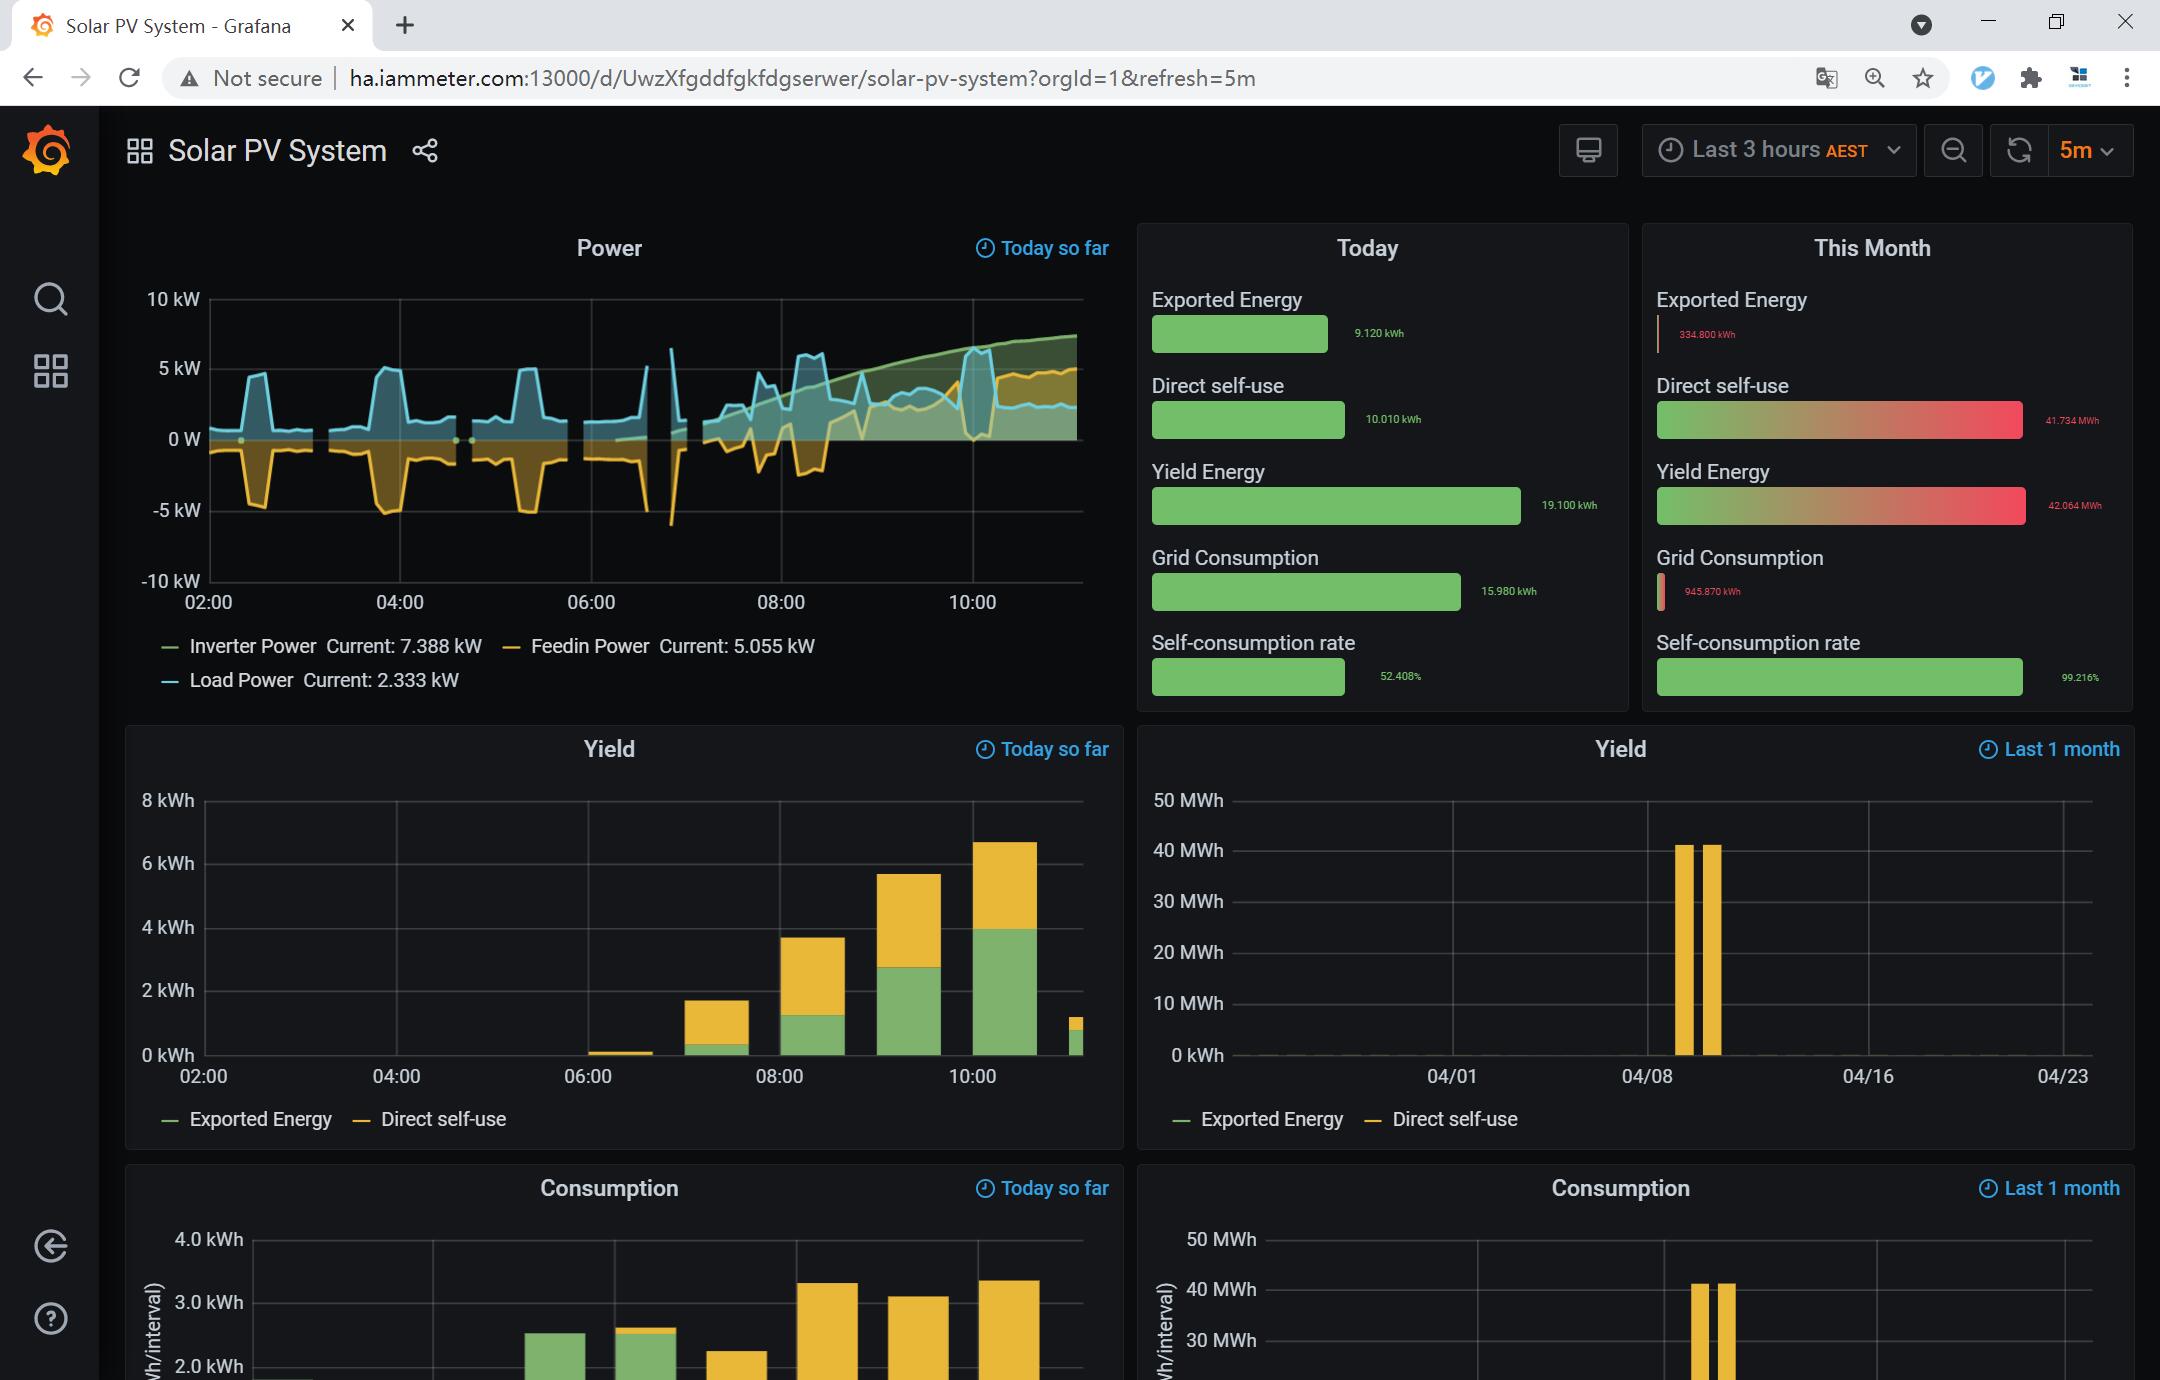
Power: Active Power
Exported energy: The surplus solar energy exported to grid
Direct self-use: The solar energy consumed by your home load
Yield Energy: The solar energy produced by solar PV system
Grid Consumption: The energy consumed from grid
Before building your own solar PV plant monitoring system, you need to install a bi-directional meter supporting integration with Home Assistant, in your solar PV plant.
Meter Example: https://www.home-assistant.io/integrations/iammeter/
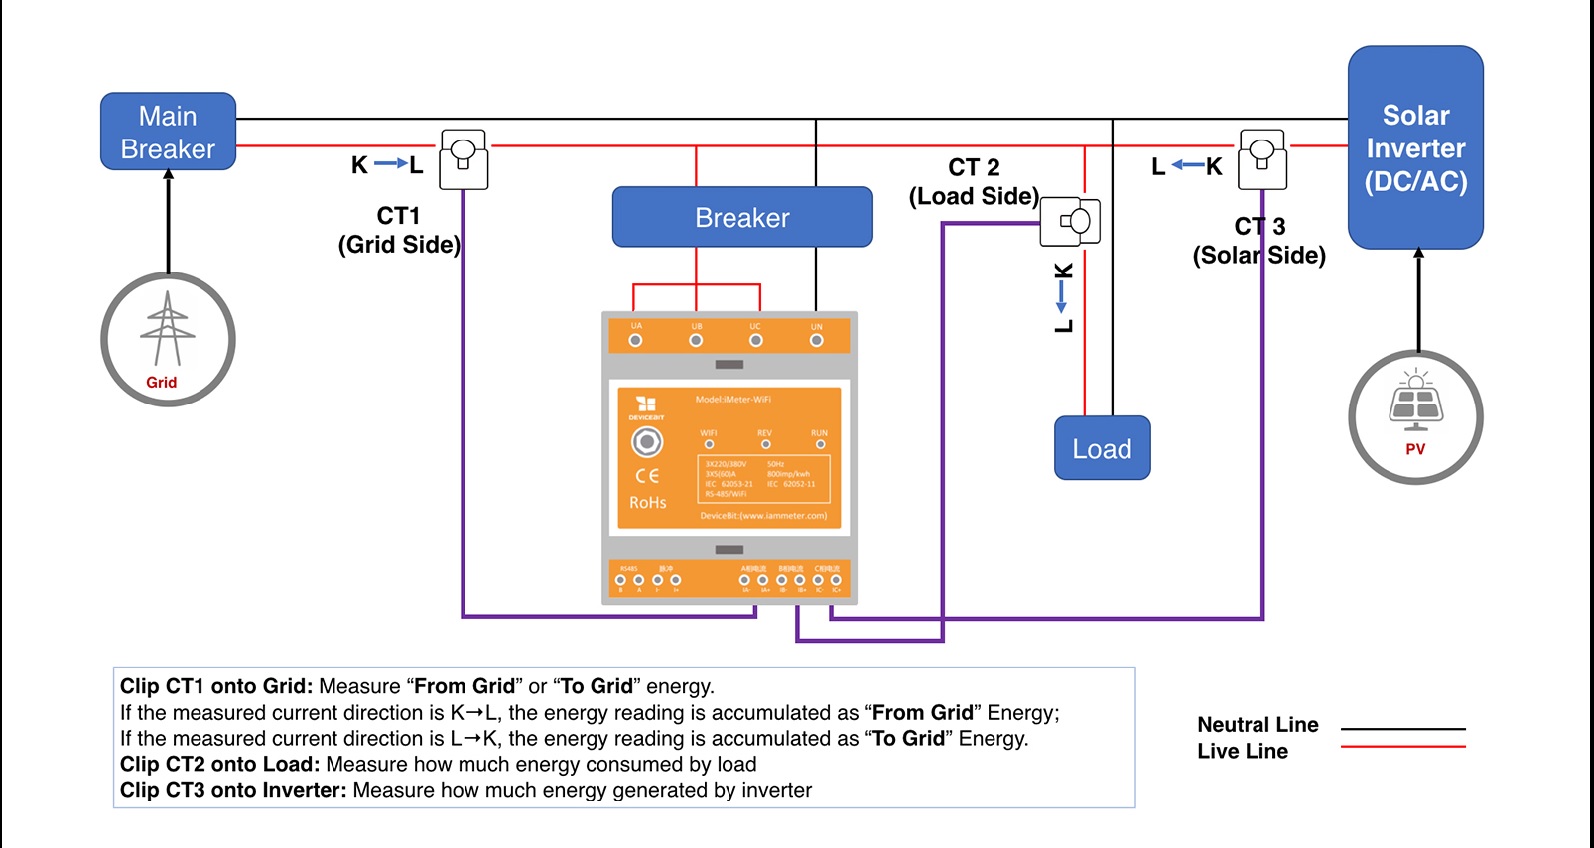
Meter Wiring Diagram
Then you need to finish few steps to build your own solar PV plant monitoring system.
Data Flow

1). Set up the meter and upload the data to Home Assistant; 2). Home Assistant calculates the energy_hourly and energy_daily based on uploaded data and store all data in InfluxDB. 3). Call the data on Grafana and present in different data graphs. You can use Grafana template (ID: 13295) to display the data.
https://github.com/lewei50/Solar-PV-Monitoring/tree/master/HomeAssistant-InfluxDB-Grafana
You can quick start by following below steps,
4.1 Install a bi-directional Wi-Fi energy meter supporting integration with Home Assistant in your solar PV plant
Meter Example: https://www.home-assistant.io/integrations/iammeter/. Please refe to above wiring diagram.
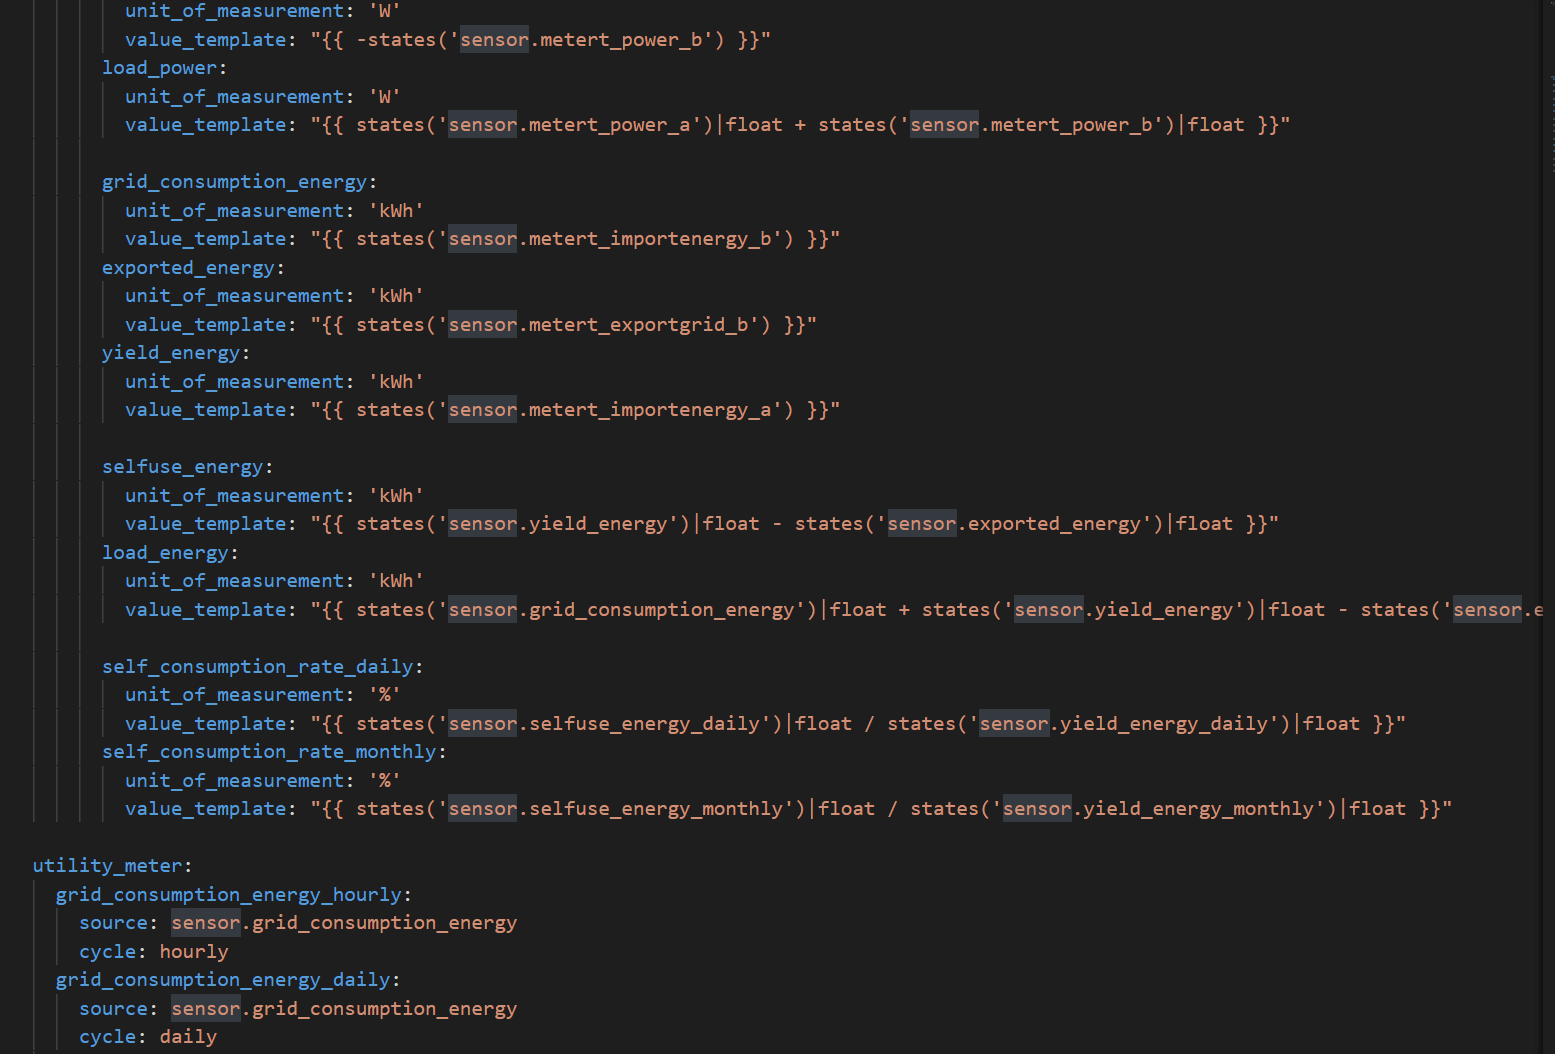
Add this file solariammeter.yaml to the directory "Packages"
Replace the Default storage of Home Assistant to InfluxDB 1.x(not support InfluxDB 2.x). For details of the Home Assistant integration, please refer to https://www.home-assistant.io/components/influxdb/
add the following to your configuration.yaml file:
influxdb:
  host: 192.168.1.6
  port: 8086
  database: homeassistant
  username: homeassistant
  password: <yourpassword>
  max_retries: 3
  default_measurement: state
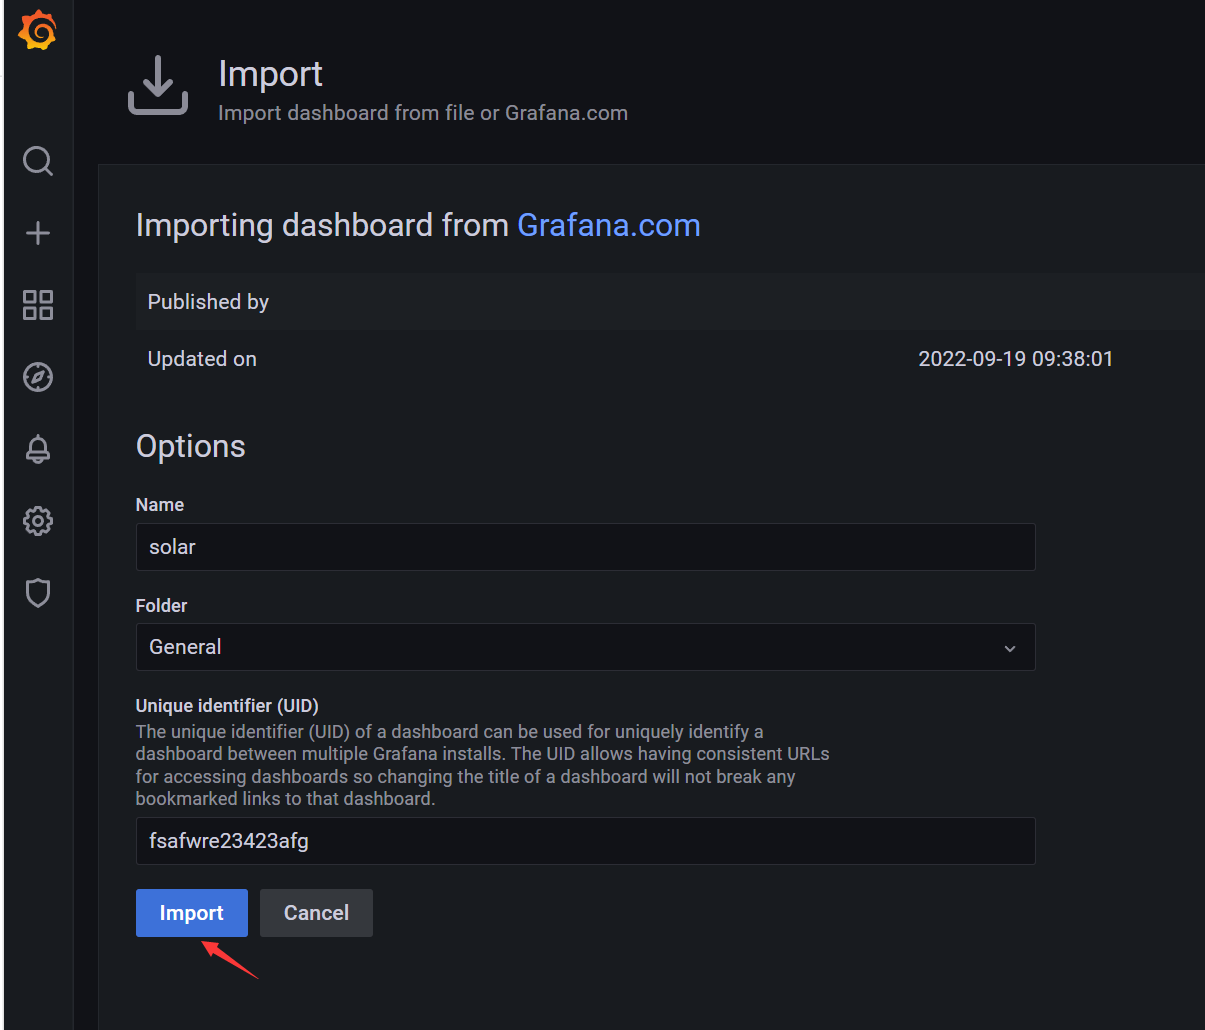
You can use below Grafana template to display the data. Grafana ID 13295.


You need to get the following data from infixdb
| inverter_power |
|---|
| feedin_power |
| load_power |
| grid_consumption_energy |
| exported_energy |
| yield_energy |
| selfuse_energy |
| load_energy |
| self_consumption_rate |
| grid_consumption_energy_hourly |
| exported_energy_hourly |
| yield_energy_hourly |
| selfuse_energy_hourly |
| load_energy_hourly |
| self_consumption_rate_hourly |
| grid_consumption_energy_daily |
| exported_energy_daily |
| yield_energy_daily |
| selfuse_energy_daily |
| load_energy_daily |
| self_consumption_rate_daily |
| grid_consumption_energy_monthly |
| exported_energy_monthly |
| yield_energy_monthly |
| selfuse_energy_monthly |
| load_energy_monthly |
| self_consumption_rate_monthly |