A basic implementation of a Gantt Chart using D3.js based on the work of Dimitry Kudryavtsev.
New features:
- Adds new model elements: milestone and datelines. New attributes added to task element: id, label, style and CSS classname.
- Axis rendering is refactored and extracted to new clases.
- Redraw method has been removed, only draw method is needed to render and re-render data.
- Gantt chart now handles task overlapping and dynamically resizes category axis tick ranges.
- Chart height and width are calculated from X,Y axis domaing lenght.
- Style and CSS class name can be provided on tasks, milestones and datelines.
- When a task bar not totally fits on current time domain, it is drawn partially.
- Adds axis grid line drawing functionallity.
- svg element structure refactoring, axis, grid and graph components are now grouped under "g" elements, and a CSS selector is defined for each group/element, so styling can easily be overrided.
- Includes methods to assign event handlers on tasks, milestones and datelines user actions.
- Multiple charts can be presented in a same page.
- Progress percentage can be assigned to each task, a bar within task rectangle is drawn to show it.
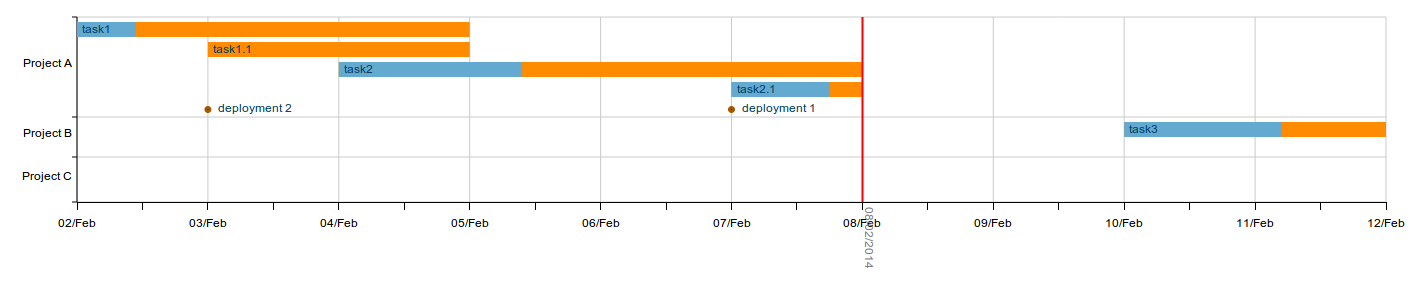
The Gantt chart handles four elements to represent data:
-
Category: category elements group tasks and define vertical axis items. Each tasks must necessarily have a category. Each category is defined using a string representing its name, ex: "Project A". Categories can be setted on gantt chart using the
categories( array )method, but if they aren't provided, the gantt chart will deduce them from categories used in the provided tasks.
If you call the categories method with a string array, the gantt chart will draw in the category axis one item for each item in the passed array, despite a category could have no related tasks. -
Task: is the basic element to assign information to a period of time. It is drawn using a rectangle bar. A task has these attributes:
var task = {
  "id": "1",          // unique task identifier
  "label": "task1",   // descriptive text to show within task bar
  "category": "Project A",
  "startDate": new Date(2014,8,10),
  "endDate": new Date(2014,8,13),
  "progress": [0,1]   // % of taks completion (optional)
  "style": "fill:red",      // style to apply to task bar (optional)
  "class": "completedTask"  // CSS class to apply to task bar (optional)
};
Note: needless to say, only one of the styling attributes should be used, style or class.
- Milestones: they define events or information related to a specific day. These elements are represented with a circle mark with their corresponding label next to them. Each milestone has this information:
var milestone = {
  "id": "1",                // unique task identifier
  "label":"deployment 1",   // descriptive text to show next to milestone mark
  "category": "Project B",  // category to which milestone belongs
  "date": new Date(2014,1,7),
  "style": "color:blue",    // (optional)
  "class": "staging_deploy" // (optional)
};- Datelines: these elements let the user draw a line in the gantt chart to point a relevant day. Each dateline has this information:
var dateline = {
  "date": new Date(2014,1,8),
  "style": "stroke:rgb(255,0,0);stroke-width:2", // (optional)
  "class": "project_deadline" // (optional)
};
To assign this information to the gantt chart, you have to call the appropiate setter before the draw method is called.
var categories = [ "Project A", "Project B", "Project C"]

var tasks = [
  {"id": "1","category":"Project A", "label":"task1","startDate":new Date(2014,1,2),"endDate":new Date(2014,1,5), "progress":0.15},
  {"id": "11","category":"Project A","label":"task1.1","startDate":new Date(2014,1,3),"endDate":new Date(2014,1,5)},
  {"id": "2","category":"Project A","label":"task2","startDate":new Date(2014,1,4),"endDate":new Date(2014,1,8), "progress":0.35},
  {"id": "21","category":"Project A","label":"task2.1","startDate":new Date(2014,1,7),"endDate":new Date(2014,1,8), "progress":0.75},
  {"id": "3","category":"Project B","label":"task3","startDate":new Date(2014,1,10),"endDate":new Date(2014,1,12), "progress":0.6}
];

var milestones = [
    {"id": 1,"category":"Project A", "label":"deployment 1","date":new Date(2014,1,7)},
    {"id": 2,"category":"Project B", "label":"deployment 2","date":new Date(2014,1,3)}
];


var datelines = [
  {"date": new Date(2014,1,8)}
];

var gantt = d3.gantt().categories(categories)
  .tasks(tasks)
  .mileStones(milestones)
  .dateLines(datelines)
  .draw();
The complete example can be found in example1.
Svg components are grouped using "g" elements to easily select appropiated elements in rendering operations. This selection is made using tag.classname CSS selectors. Each element type has its own css class name, so users can override styling according to their needs. This is the element and css classname structure.
  svg.chart
    g.gantt-chart
      g.grid-group [1]
        line.gridX [0,*]
        line.gridY [0,*]
      g.xaxis-group [1]
        path.domain [1]
        line.tickX minor [0,*]
        g.tickX major [0,*]
          line [1]
          text [1]
      g.yaxis-group [1]
        line.axisY [1]
        line.tickY  [0,*]
        g [0,*]
          text.tickY-label [0,*]
      g.gantt-bars [1]
        g.g_task [0,*]
          text.task-bar [1]
          rect.task-progress-bar [1]
          text.task-label [1]
        g.g_mileStone [0,*]
          circle.milestone-mark [1]
          text.milestone-label [1]
        g.g_dateline [0,*]
          line.dateline-line [1]
          text.dateline-label [1]
The number next to class name indicates the number of times the element can appear. For example, text.dateline-label can be found multiple times under the g.g_dateline element, but there is just one g.g_dateline element in the svg chart.
Gantt chart comes with a default styling implementation that can be found in [gantt-chart-d3.css] (https://github.com/gusriobr/Gantt-Chart/blob/master/gantt-chart-d3.css).
You can set the height and width of the gantt chart using the gantt.height() and gantt.width() methods. If these values aren't provided, the gantt chart is drawn using these default values:
- height: as much length as needed to draw the category axis.
- width: body.clientWidht
The category axis lanes length are calculated dynamically using provided tasks. When two tasks are overlapped, the gantt chart will draw the later task under the overlapped task, and the corresponding category axis lane will be expanded to fit the two parallel tasks width. There's no limit in the number of parallel task to draw.
To change this behaviour (for example to define overlapping based on task relation in addition to time constraints, or to set a fixed length for each category lane), provide a different implementation of overlappingResolver class.
You can modify the category lane length calculation modifying the categoryAxisRenderer.config parameters (bar padding, task bar height, margins, task bar minimun height, ...).
###Event handling Gannt chart provides methods to establish handlers to treat user actions on task bars, milestones marks and datelines. Each object type has its own method: '''javascript gantt.taskEventHandler(event, handler) gantt.milestoneEventHandler(event, handler) gantt.datelineEventHandle(event, handler) ''' Where event, is a string event type, such as "click", "mouseover", etc. It defines the event that will be catched by the handler, and handler is a js function that receives as parameter the object model in which user has executed an action.
So to handle click events on tasks, just code:
gantt.taskEventHandler('click', function (t){
  console.log("this is the task you clicked " + t.label);
})Relies on the fantastic D3 visualization library to do lots of the heavy lifting for stacking and rendering to SVG.
Copyright 2014 Gustavo Río Briones
Licensed under the Apache License, Version 2.0 (the "License"); you may not use this file except in compliance with the License. You may obtain a copy of the License at
http://www.apache.org/licenses/LICENSE-2.0
Unless required by applicable law or agreed to in writing, software distributed under the License is distributed on an "AS IS" BASIS, WITHOUT WARRANTIES OR CONDITIONS OF ANY KIND, either express or implied. See the License for the specific language governing permissions and limitations under the License.