You signed in with another tab or window. Reload to refresh your session.You signed out in another tab or window. Reload to refresh your session.You switched accounts on another tab or window. Reload to refresh your session.Dismiss alert
for i := range tbl {
	tbl[i] = make([]uint32, w)
}


// Background: The Go's memory allocator will ask caller to sweep spans in some scenarios.
// This can cause memory allocation request latency unpredictable, if the list of spans which need sweep is too long.
// For memory allocation large than 32K, the allocator will never allocate memory from spans list.
//
// The memory referenced by the CMSketch will never be freed.
// If the number of table or index is extremely large, there will be a large amount of spans in global list.
// The default value of `d` is 5 and `w` is 2048, if we use a single slice for them the size will be 40K.
// This allocation will be handled by mheap and will never have impact on normal allocations.
arena := make([]uint32, d*w)
for i := range tbl {
		tbl[i] = arena[i*int(w) : (i+1)*int(w)]
}
Golang 性能分析及优化
Background
想要调优,必须知道一个程序的瓶颈在哪,Golang本身自带的pprof和trace可以定位程序大部分的性能问题,这篇文章会介绍下pprof以及trace的使用。
pprof
pprof文件收集
pprof是一般用来收集CPU,内存,Goroutine等一系列的消耗工具。
针对HTTP server,直接导入一个包即可开启pprof。
import _ "net/http/pprof"下载pprof也比较简单:
大部分生产环境应该都有对应的Jenkins去收集这些,不需要手动去跑。
pprof的种类分为profile、heap、threadcreate、block、mutex
分析
pprof可以使用命令行或者是web UI进行分析,一般来说web UI比较方便的可以看火焰图等。
命令行
pprof -source_path ${GOPATH}/src:${GOROOT}/src ~/Downloads/profile_*.pb.gz这里需要指定一下对应的gopath文件夹,不然打印出来的code可能有些无法显示,这里以profile为例子可以看下
Top命令可以指定Flat、Cum或者Sum,三者的定义分别如下:
参考下面这个例子就可以很清晰的知道:
Flat的cost为step3,Cum的Cost为step1+ step2+ step3+ step4。
Peek命令可以追踪上一层函数,List命令可以展示指定函数消耗的时间片。
Web UI
Web UI的使用还是比较方便的,平时都是直接拿这个调试的,对应的命令
pprof -source_path ${GOPATH}/src:${GOROOT}/src -http "localhost:12346" ~/Downloads/profile_*.pb.gz调用关系图可以参考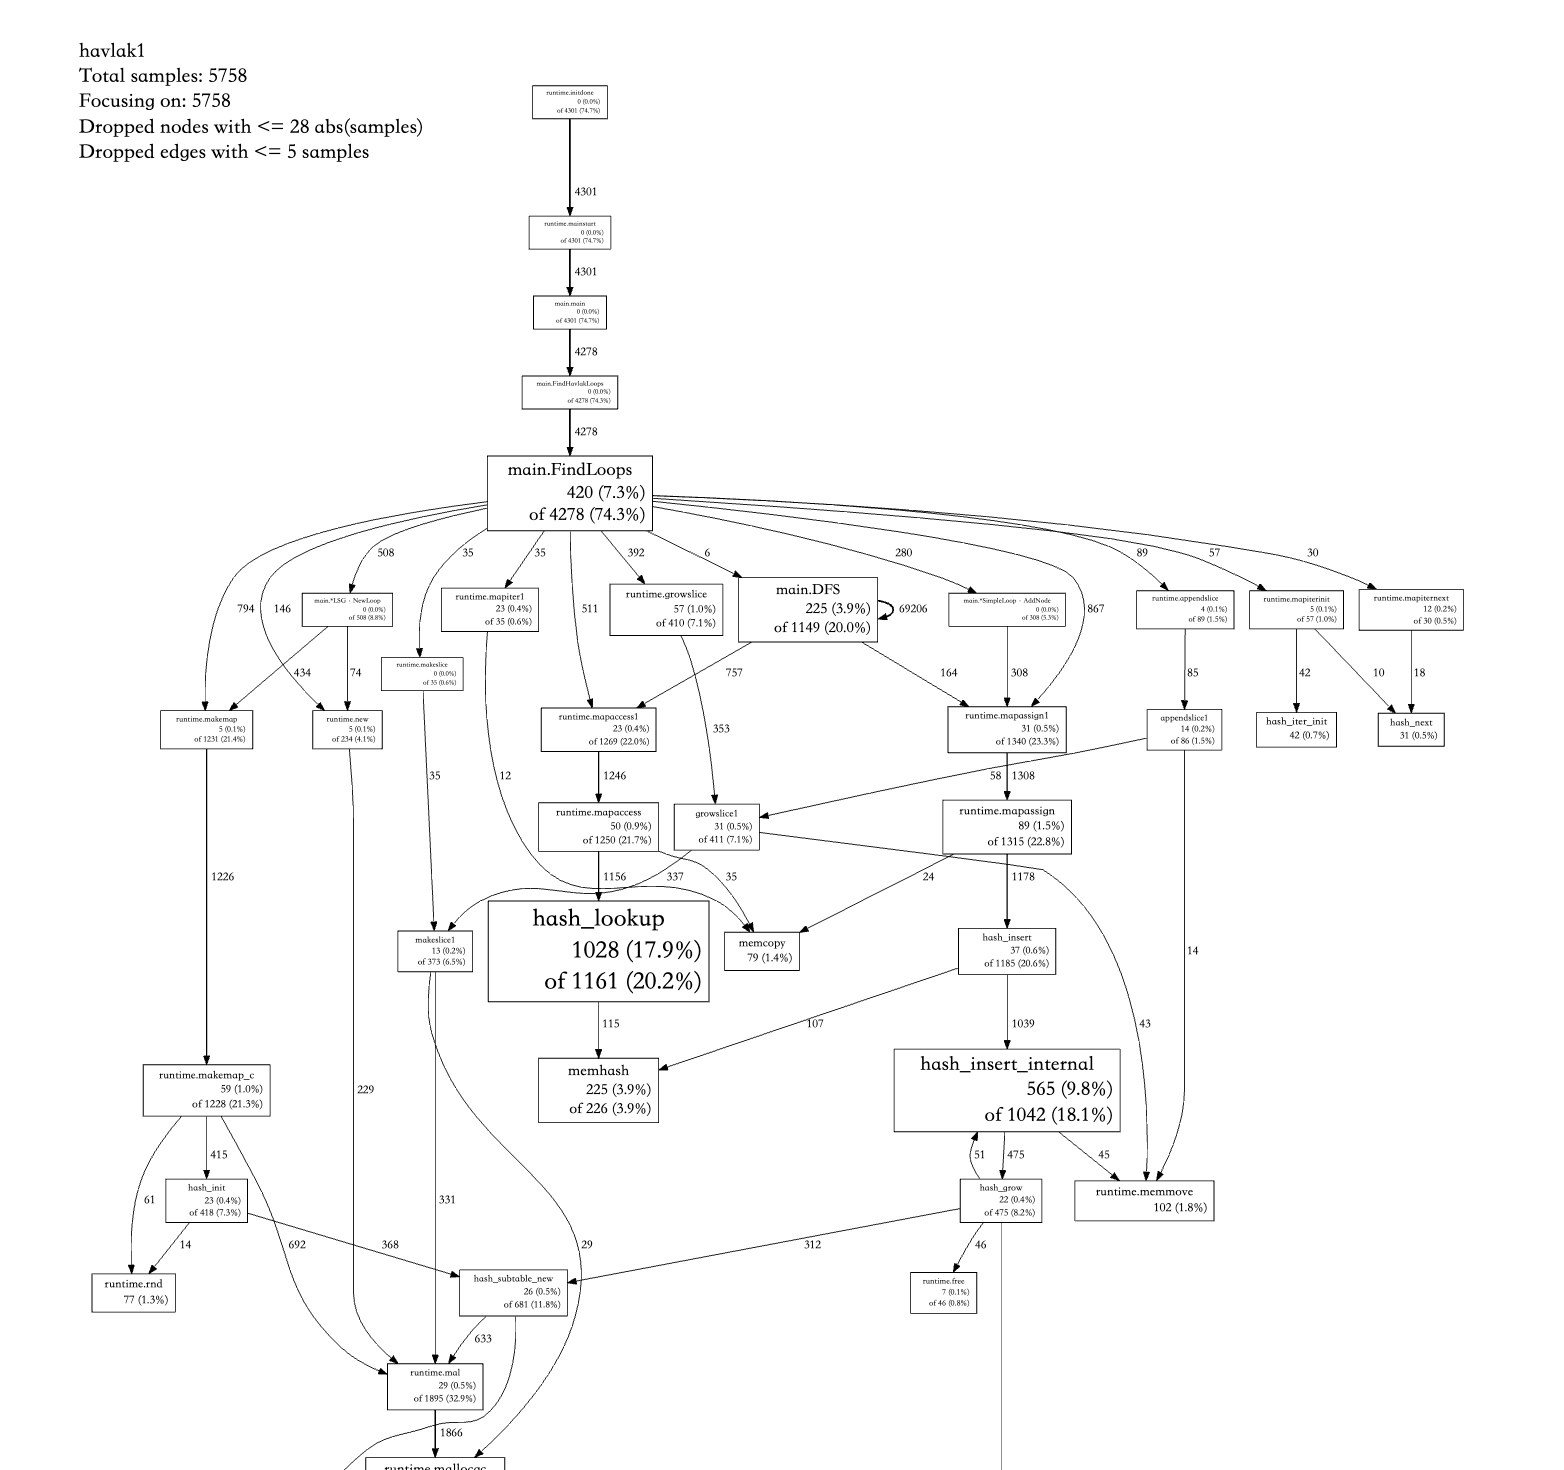
火焰图可以参考

个人使用感觉还是web UI比较舒服。
trace
trace可以撑的上是大杀器,在分析整个程序的吞吐以及GC对应的相关瓶颈更加实用,他可以分析所有goroutine的生命周期,调度创建以及销毁时间(必须是在采样的时间内)。
启动也很简单,一行命令搞定即可,只可以在chrome上展示
go tool trace trace.out, 如果打开是空白,可以尝试用gotip打开。View Trace:整个程序执行期间的生命周期,包括heap变化,GC时间,goroutine在哪些P上调用.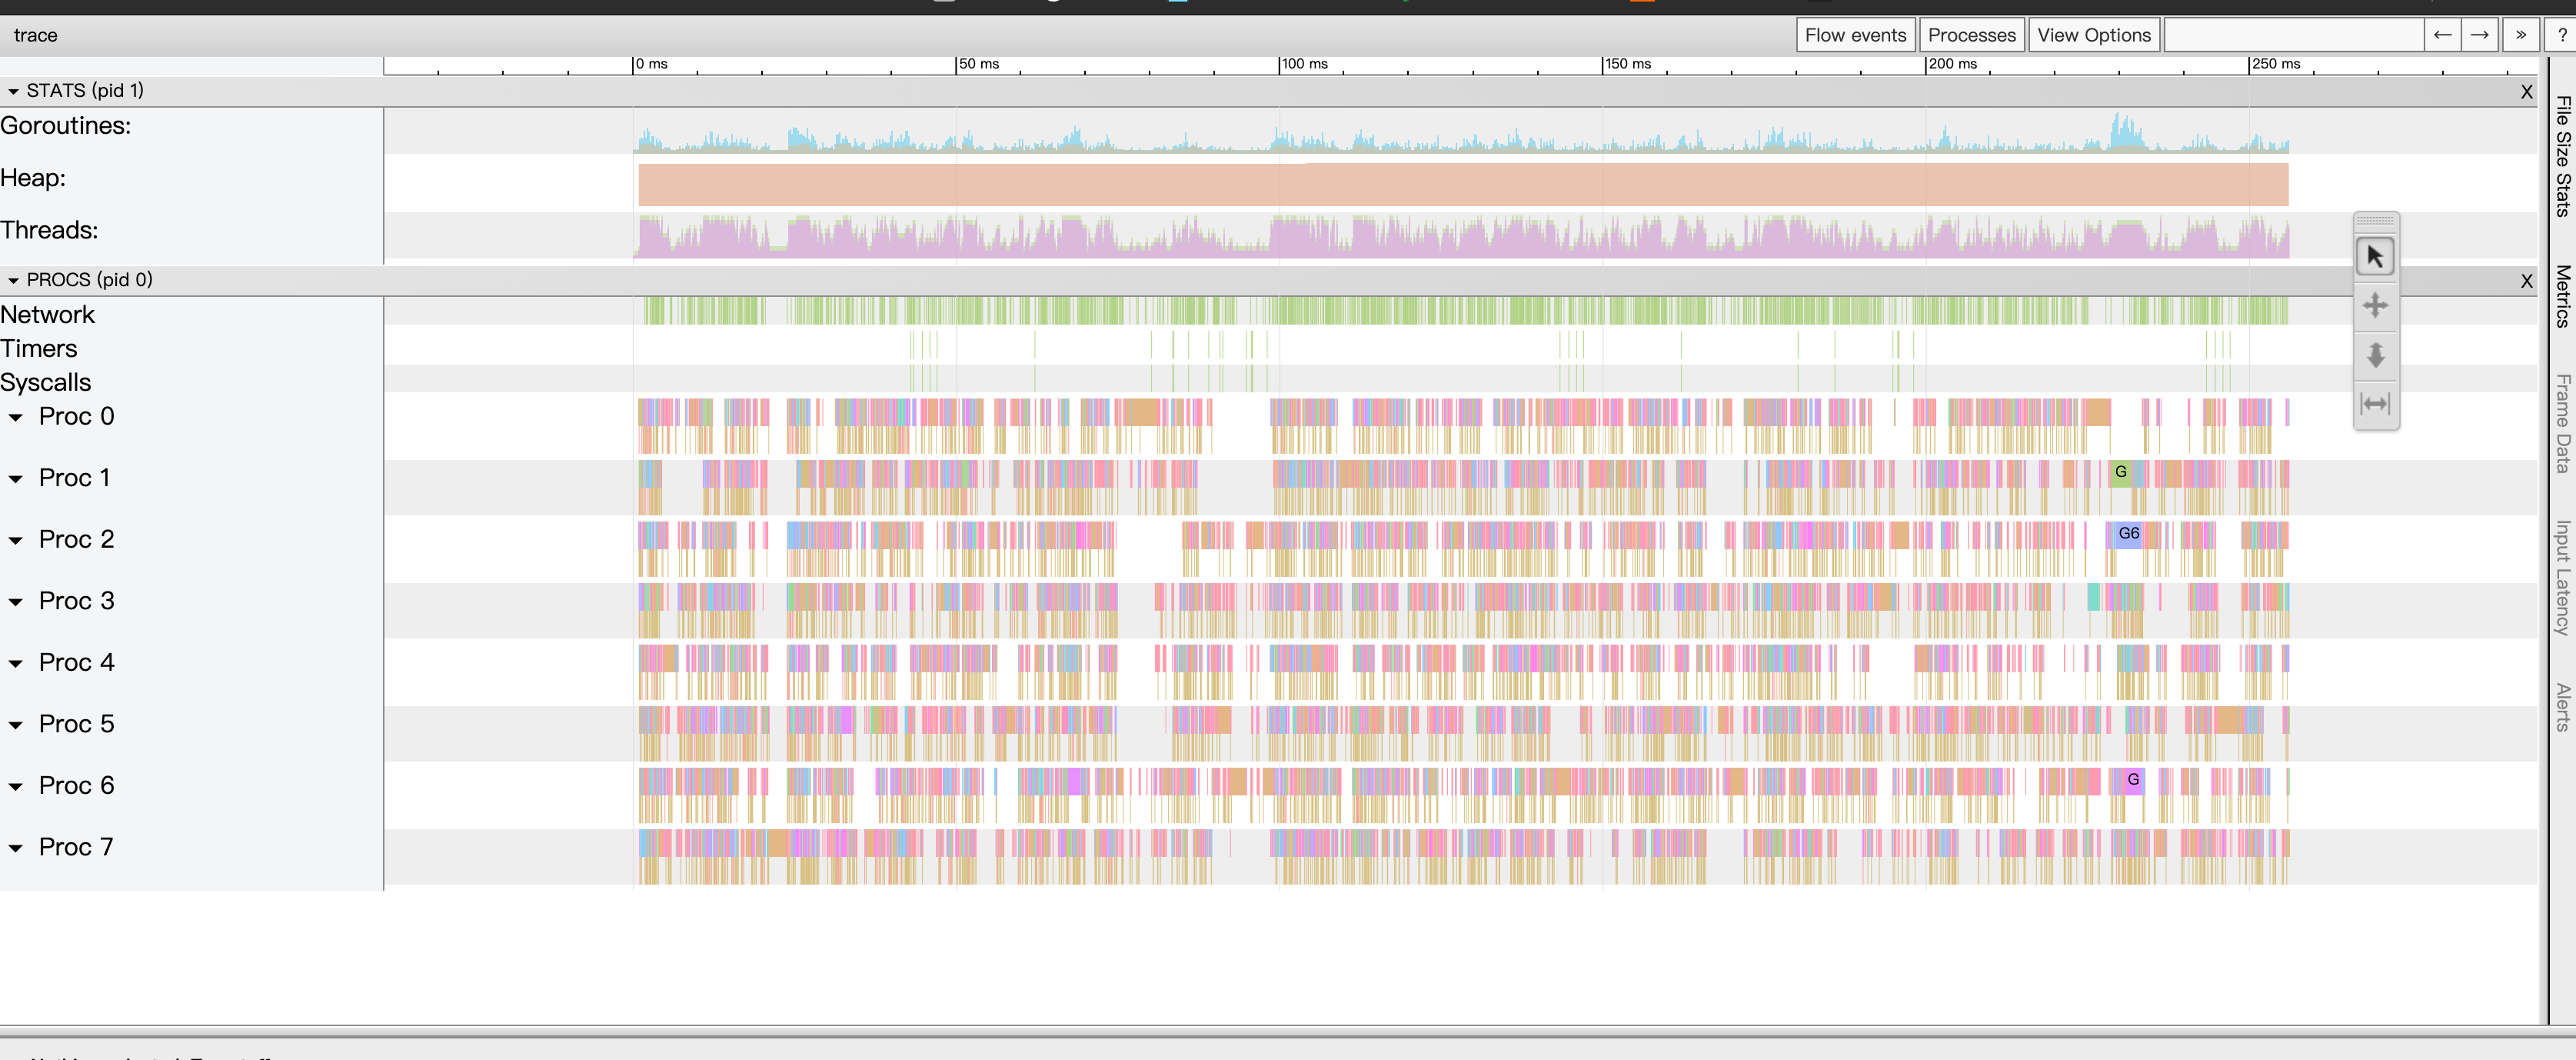
Goroutine analysis: 一共有多少个goroutine,每个goroutine分别占用了多少时间.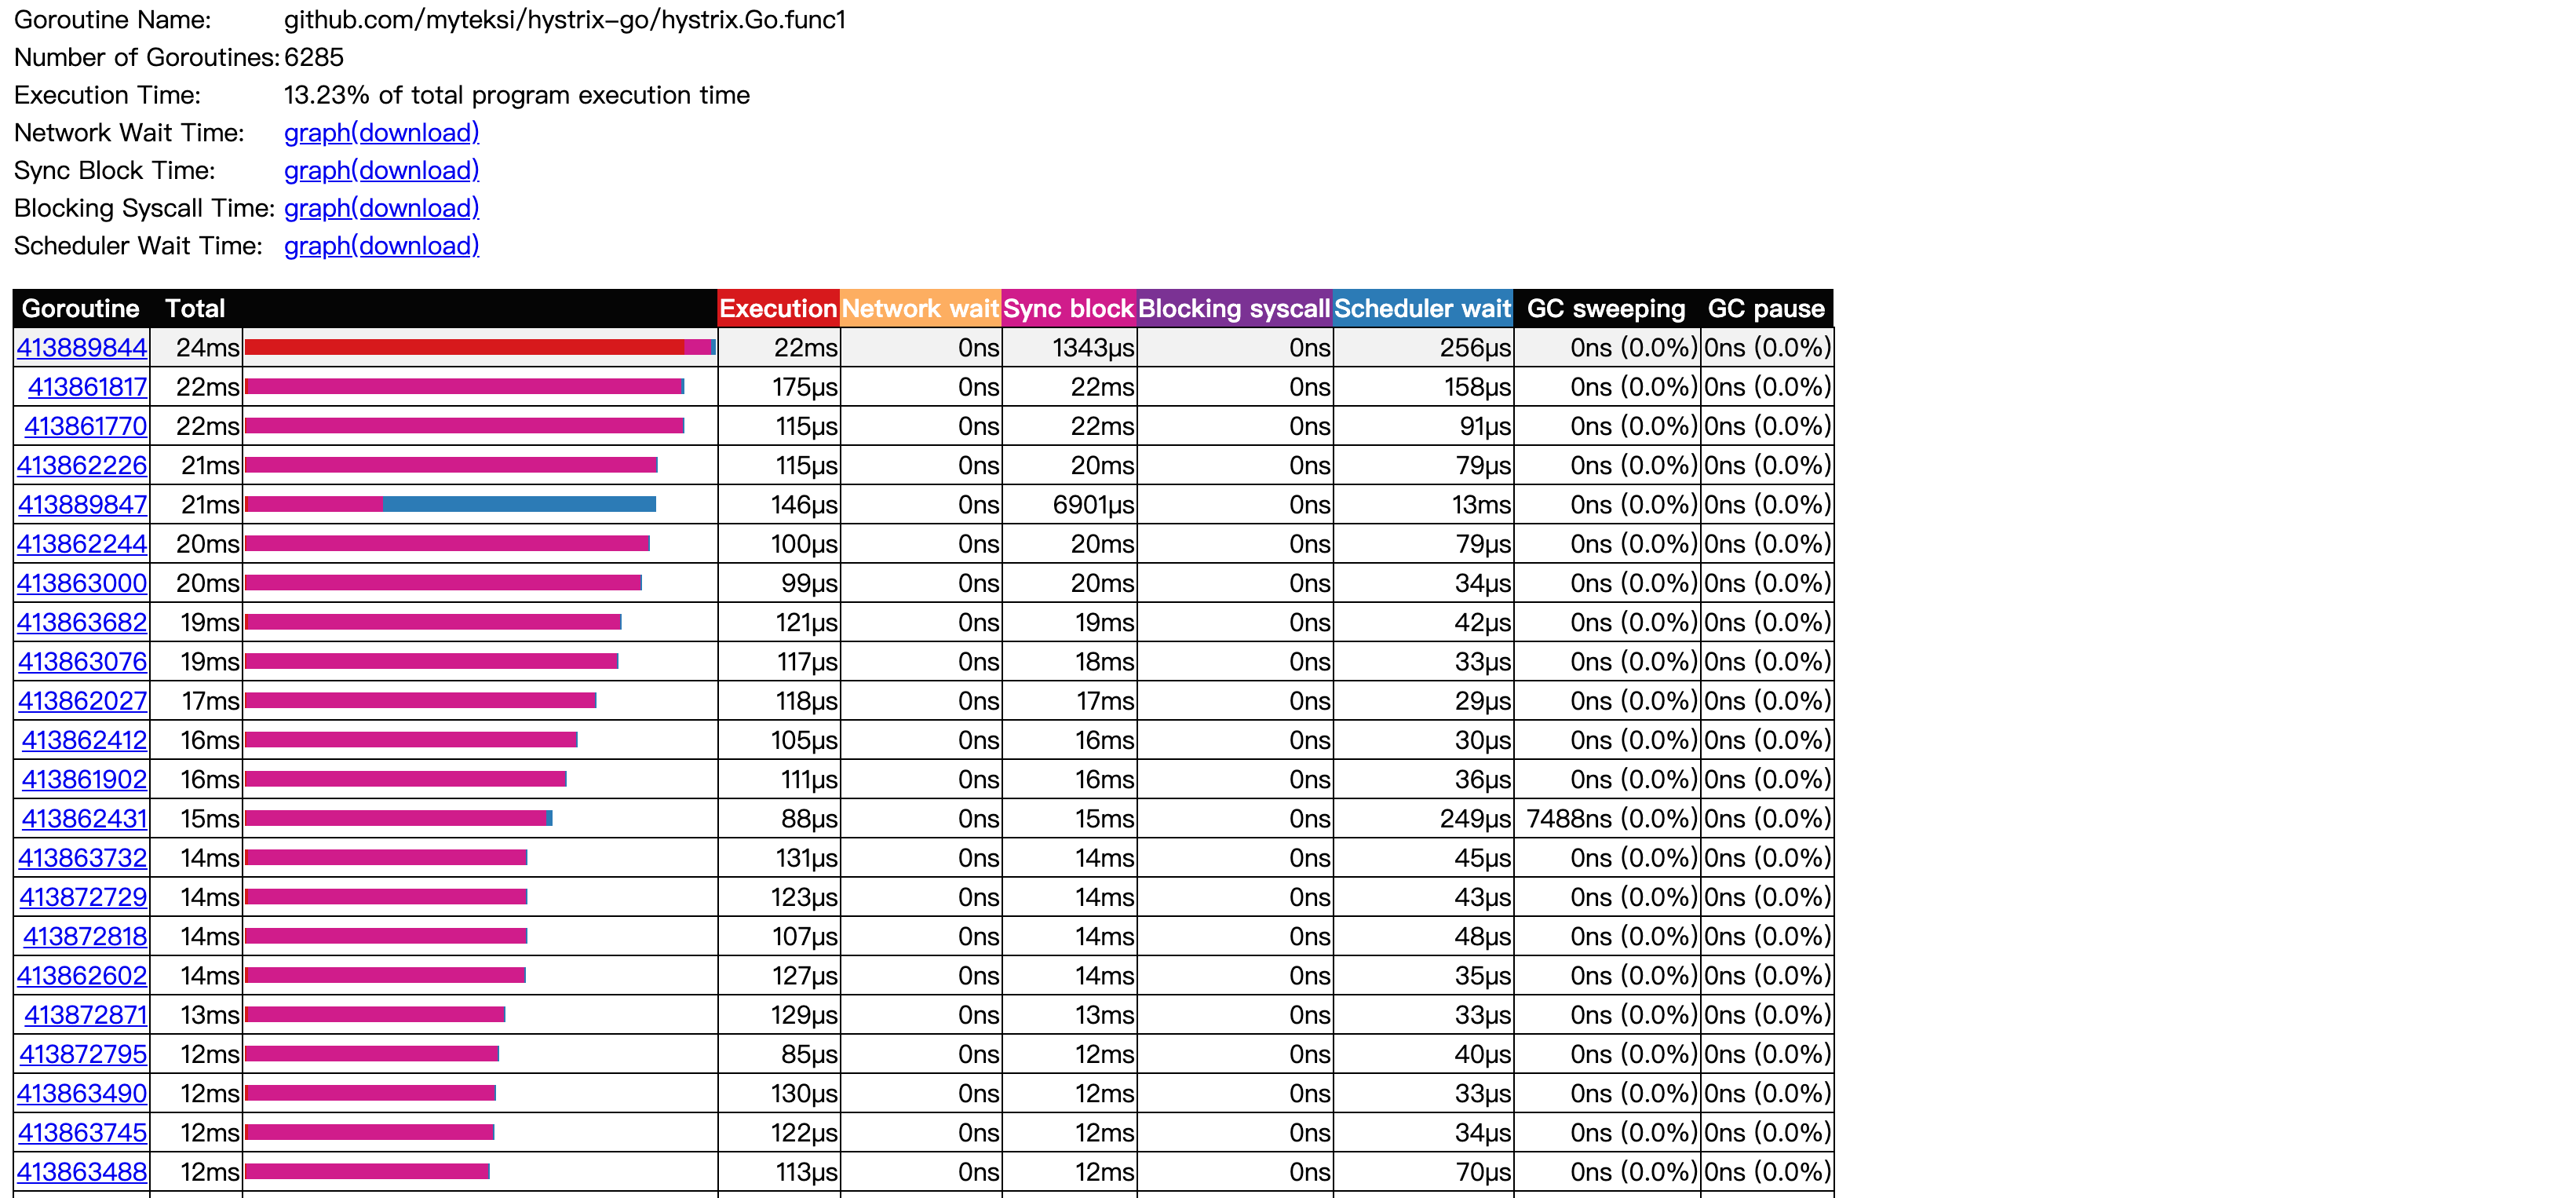
Network/Sync/Syscall blocking profile: Goroutine分别在网络/同步阻塞/系统调用上花费了多少时间
Scheduler latency profiler: 调度花费的时间,一般指的G从runnable到running中间花费了多久.
Minimum mutator utilization: 用来分析整个程序的性能吞吐,这个比较实用。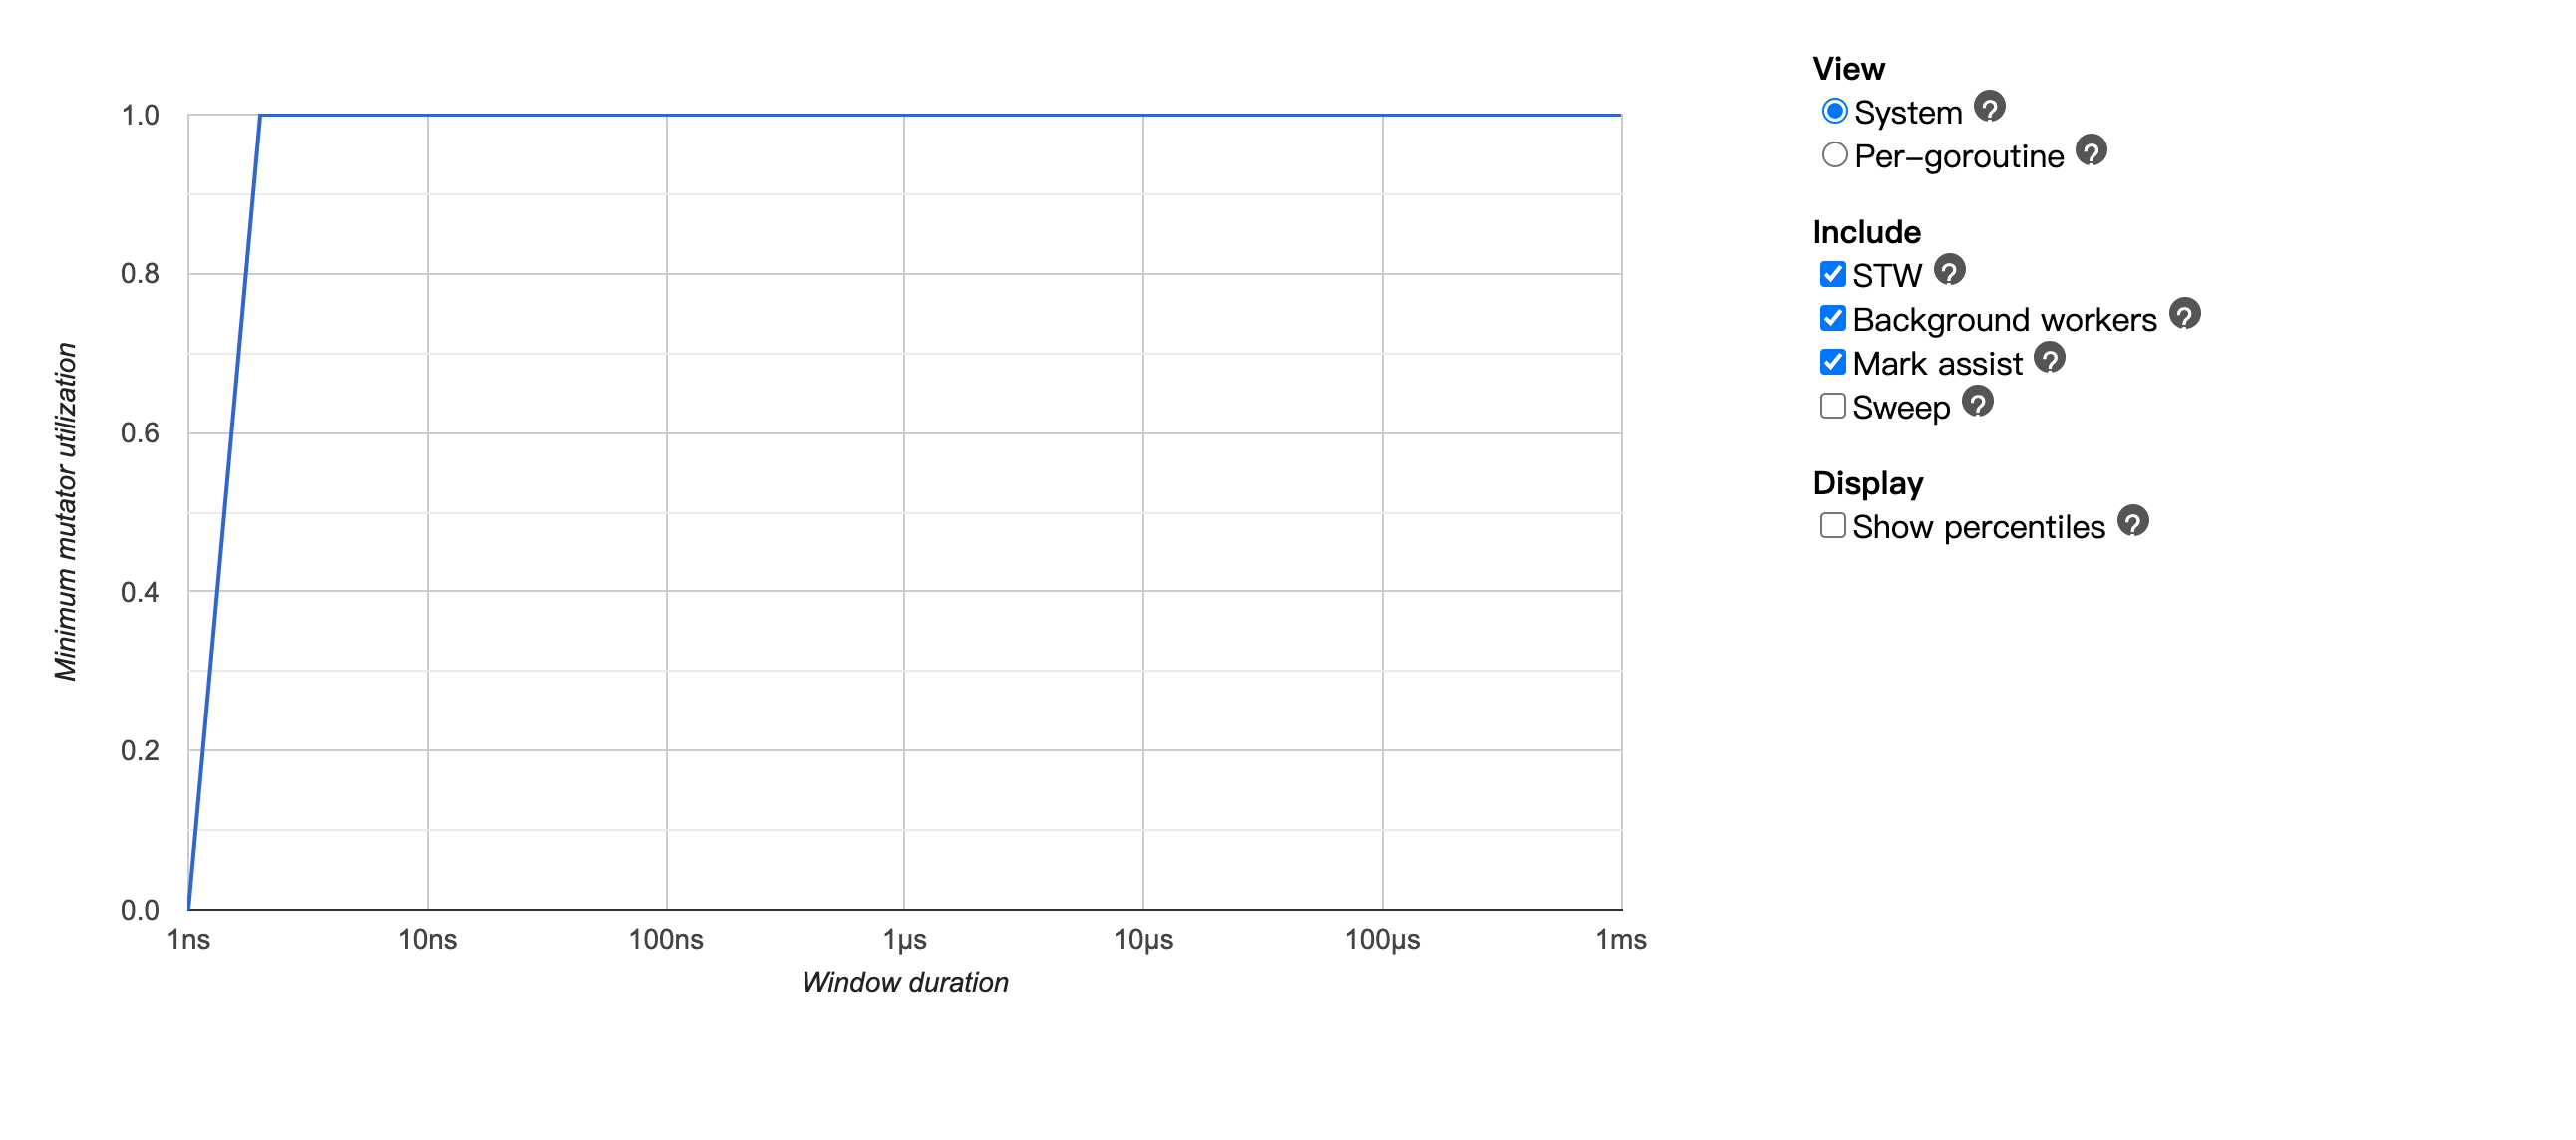
在trace里就重点聊下MMU这个东西吧,在GC的概念里面运行的程序就可以认为是一个mutator,这里能观察到不同的GC事件对于整个系统性能的影响。

x轴可以理解为采样的时间点,y轴则代表程序整体可以使用的吞吐,1.0表示整个系统可用率为100%,为0则表示当前的GC STW了,系统当前不可用。
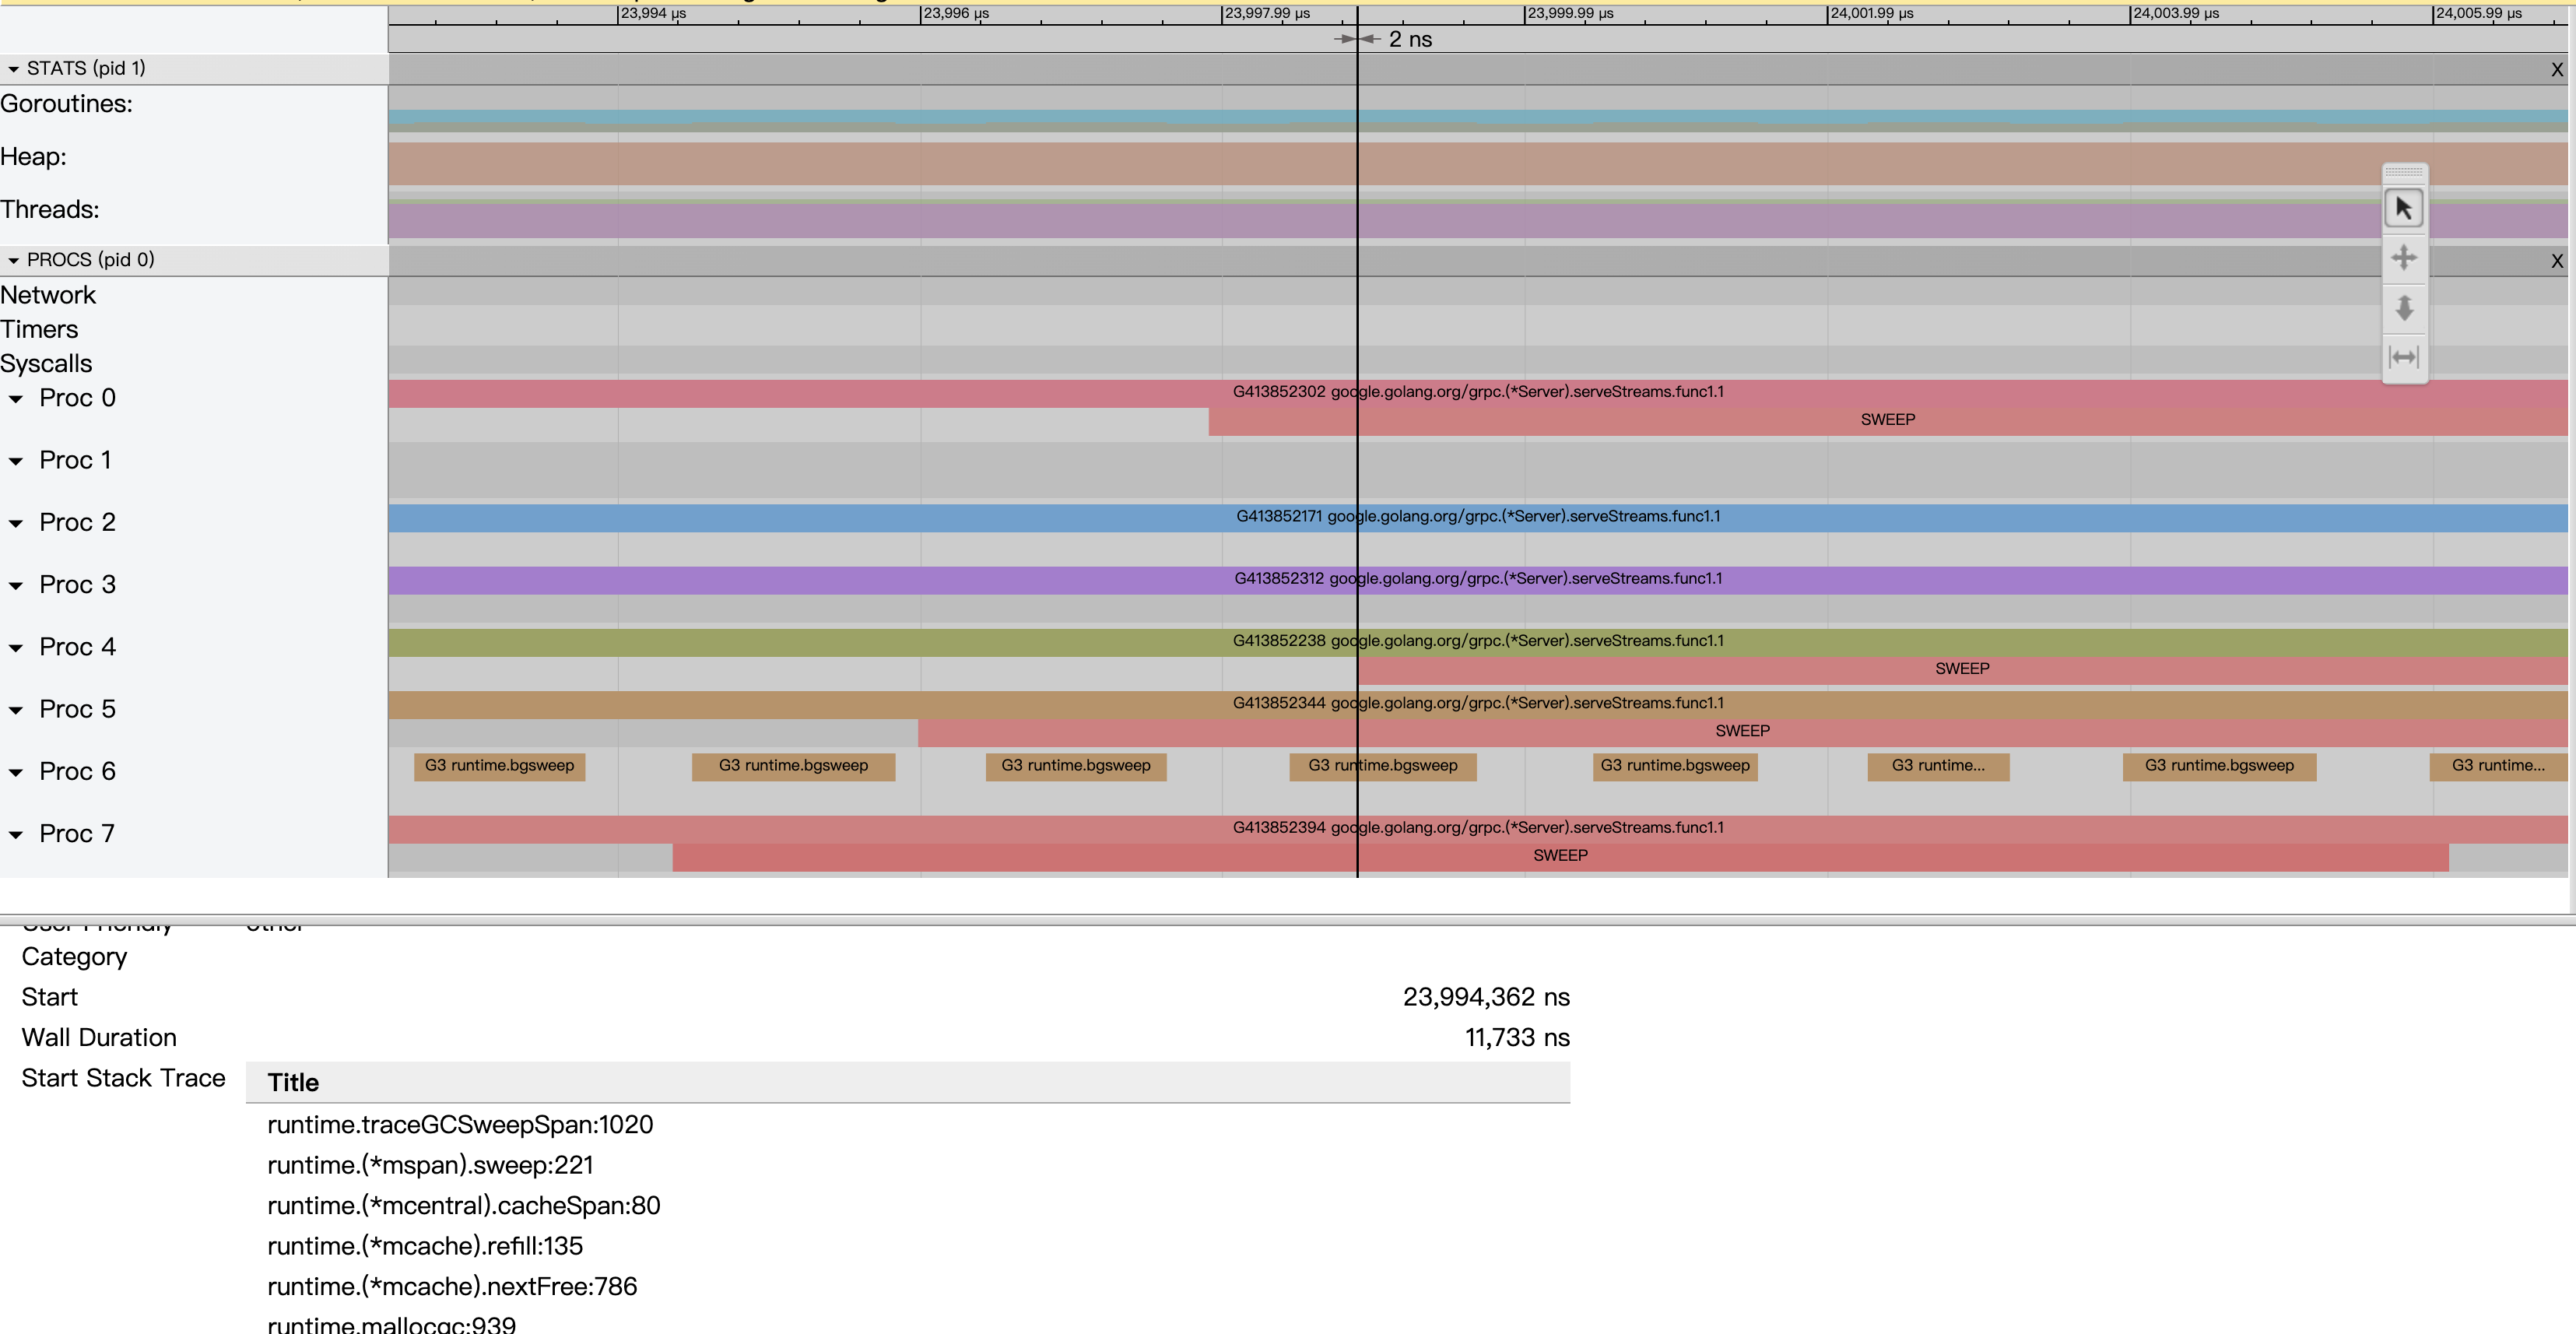
一个简单的例子来看,对比上面的图,加上了Sweep之后可以打线,整个系统的吞吐变慢了,直道1ms左右才看到系统的吞吐恢复到90%左右,这里就是一个典型的sweep latency过长的情况。
点击上面的线,可以具体看到具体的调用栈。sweep一般有两个地方会调用:1.background sweep在后台定期的去扫 2.allocate的时候会从已经mark为不用的对象里面重新拿
优化
STW latency
Go在1.14之前是没有抢占调度的,在STW的时候需要所有的goroutine park下来,抢占点位一般有两个:要么进入系统调用或者扩栈。如果当前有一个G一直在tight loopli里面跑着,就会导致STW的时间无限拉长。
上面这段代码就永远不会输出OK,同理也永远进入不了GC。
所以在进行问题排查的时候,需要我们自己去注意看函数里面是否有一些超级大的循环导致STW latency过长。
Go 1.14使用信号量去抢占,已经fix了这个问题,在M启动的时候会去注册信号量,有需要的时候直接进行抢占。
Mark assist
在Heap里面的活对象越多,Mark的latency就会越长。
所以优化可以从几个角度考虑
对于比较大的slice,尽量避免使用指针,使用数组可以有效的优化GC(GC认为数组是一个对象,使用数组相当于减少了扫描个数)。
更少的goroutine意味着更好的性能,Mark assist 会去扫面goroutine的栈,如果栈太长, latency也会越高。
Sweep latency
具体可以参考这个issue,当heap里面没有垃圾,不停的allocate导致sweep latency过长。根本原因是span list太长,要扫的对象太多。具体分为两种情况:
Go在1.15修复了这个问题,扫描一定长度的span就不继续往下扫了。tidb之前也有个热修复将对象不分配在mcache上,2048byte变成40K, 直接将对象变大用mheap去管理也是十分trick,
要优化的话可以考虑:
小结
一般pprof更方便用来定位程序代码的瓶颈,trace可以更加方便的定位GC导致的一些latency,针对不同的latency可以做不同的优化,具体场景需要具体的分析。
The text was updated successfully, but these errors were encountered: