Tests performance of various proxies/load balancers. Based on the Proxy-Benchmarks.
We test the following proxies:
- Caddy
- Envoy
- NGINX
- Silverwind
We use the docker-compose to do the performance test.Install the docker on your computer and confirm that the your computer have enough cpu and memory.There are three services in the docker-compose including the hey(Testing Tool),proxy and the backend.We limit the cpu cores(4 core) and memory(8GB) for the service.
Our testing environment is based on the PC.And the cpu of the PC is 13th Gen Intel(R) Core(TM) i5-13600K,the memory of the PC is 32GB.
Graphs created using https://www.rapidtables.com/tools/bar-graph.html
hey -n 100000 -c 250 -m GET http://haproxy:80/
Summary:
Total: 1.2244 secs
Slowest: 0.0890 secs
Fastest: 0.0001 secs
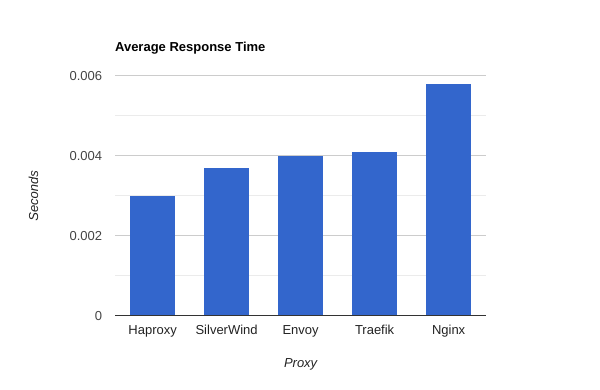
Average: 0.0030 secs
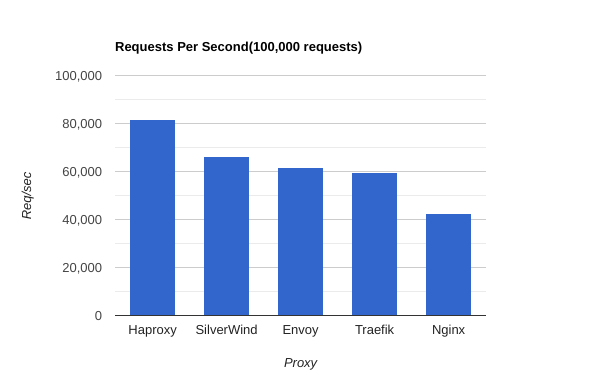
Requests/sec: 81674.2776
Total data: 13300000 bytes
Size/request: 133 bytes
Response time histogram:
0.000 [1] |
0.009 [98150] |■■■■■■■■■■■■■■■■■■■■■■■■■■■■■■■■■■■■■■■■
0.018 [1443] |■
0.027 [149] |
0.036 [89] |
0.045 [52] |
0.053 [21] |
0.062 [44] |
0.071 [29] |
0.080 [20] |
0.089 [2] |
Latency distribution:
10% in 0.0005 secs
25% in 0.0013 secs
50% in 0.0025 secs
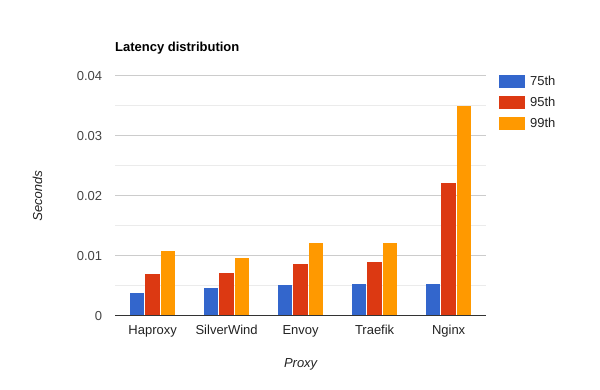
75% in 0.0039 secs
90% in 0.0057 secs
95% in 0.0070 secs
99% in 0.0108 secs
Details (average, fastest, slowest):
DNS+dialup: 0.0000 secs, 0.0001 secs, 0.0890 secs
DNS-lookup: 0.0001 secs, 0.0000 secs, 0.0545 secs
req write: 0.0000 secs, 0.0000 secs, 0.0472 secs
resp wait: 0.0027 secs, 0.0000 secs, 0.0306 secs
resp read: 0.0002 secs, 0.0000 secs, 0.0340 secs
Status code distribution:
[200] 100000 responses
hey -n 100000 -c 250 -m GET http://silverwind:6667

Summary:
  Total:	1.5067 secs
  Slowest:	0.0199 secs
  Fastest:	0.0001 secs
  Average:	0.0037 secs
  Requests/sec:	66370.1064

  Total data:	13800000 bytes
  Size/request:	138 bytes

Response time histogram:
  0.000 [1]	|
  0.002 [15865]	|■■■■■■■■■■■■■
  0.004 [49346]	|■■■■■■■■■■■■■■■■■■■■■■■■■■■■■■■■■■■■■■■■
  0.006 [24350]	|■■■■■■■■■■■■■■■■■■■■
  0.008 [7404]	|■■■■■■
  0.010 [2204]	|■■
  0.012 [578]	|
  0.014 [201]	|
  0.016 [42]	|
  0.018 [7]	|
  0.020 [2]	|


Latency distribution:
  10% in 0.0017 secs
  25% in 0.0024 secs
  50% in 0.0034 secs
  75% in 0.0046 secs
  90% in 0.0061 secs
  95% in 0.0072 secs
  99% in 0.0097 secs

Details (average, fastest, slowest):
  DNS+dialup:	0.0000 secs, 0.0001 secs, 0.0199 secs
  DNS-lookup:	0.0000 secs, 0.0000 secs, 0.0114 secs
  req write:	0.0000 secs, 0.0000 secs, 0.0084 secs
  resp wait:	0.0036 secs, 0.0001 secs, 0.0158 secs
  resp read:	0.0001 secs, 0.0000 secs, 0.0089 secs

Status code distribution:
  [200]	100000 responses
hey -n 100000 -c 250 -m GET http://envoy:8050

Summary:
  Total:	1.6169 secs
  Slowest:	0.0276 secs
  Fastest:	0.0001 secs
  Average:	0.0040 secs
  Requests/sec:	61847.1944

  Total data:	24700000 bytes
  Size/request:	247 bytes

Response time histogram:
  0.000 [1]	|
  0.003 [38412]	|■■■■■■■■■■■■■■■■■■■■■■■■■■■■■■■■■■■■■■
  0.006 [40571]	|■■■■■■■■■■■■■■■■■■■■■■■■■■■■■■■■■■■■■■■■
  0.008 [15220]	|■■■■■■■■■■■■■■■
  0.011 [4273]	|■■■■
  0.014 [1016]	|■
  0.017 [322]	|
  0.019 [95]	|
  0.022 [60]	|
  0.025 [15]	|
  0.028 [15]	|


Latency distribution:
  10% in 0.0013 secs
  25% in 0.0022 secs
  50% in 0.0034 secs
  75% in 0.0052 secs
  90% in 0.0072 secs
  95% in 0.0087 secs
  99% in 0.0121 secs

Details (average, fastest, slowest):
  DNS+dialup:	0.0000 secs, 0.0001 secs, 0.0276 secs
  DNS-lookup:	0.0000 secs, 0.0000 secs, 0.0139 secs
  req write:	0.0000 secs, 0.0000 secs, 0.0119 secs
  resp wait:	0.0037 secs, 0.0001 secs, 0.0276 secs
  resp read:	0.0002 secs, 0.0000 secs, 0.0137 secs

Status code distribution:
  [200]	100000 responses
hey -n 100000 -c 250 -m GET http://traefik:80/

Summary:
  Total:	1.6810 secs
  Slowest:	0.0256 secs
  Fastest:	0.0001 secs
  Average:	0.0041 secs
  Requests/sec:	59486.9083

  Total data:	28800000 bytes
  Size/request:	288 bytes

Response time histogram:
  0.000 [1]	|
  0.003 [29996]	|■■■■■■■■■■■■■■■■■■■■■■■■■■■■
  0.005 [43114]	|■■■■■■■■■■■■■■■■■■■■■■■■■■■■■■■■■■■■■■■■
  0.008 [18210]	|■■■■■■■■■■■■■■■■■
  0.010 [6093]	|■■■■■■
  0.013 [1868]	|■■
  0.015 [487]	|
  0.018 [144]	|
  0.021 [36]	|
  0.023 [36]	|
  0.026 [15]	|


Latency distribution:
  10% in 0.0013 secs
  25% in 0.0024 secs
  50% in 0.0036 secs
  75% in 0.0054 secs
  90% in 0.0074 secs
  95% in 0.0090 secs
  99% in 0.0122 secs

Details (average, fastest, slowest):
  DNS+dialup:	0.0000 secs, 0.0001 secs, 0.0256 secs
  DNS-lookup:	0.0000 secs, 0.0000 secs, 0.0142 secs
  req write:	0.0000 secs, 0.0000 secs, 0.0089 secs
  resp wait:	0.0039 secs, 0.0001 secs, 0.0229 secs
  resp read:	0.0002 secs, 0.0000 secs, 0.0082 secs

Status code distribution:
  [200]	100000 responses
 hey -n 100000 -c 250 -m GET http://nginx:80/

Summary:
  Total:        2.3592 secs
  Slowest:      0.1100 secs
  Fastest:      0.0002 secs
  Average:      0.0058 secs
  Requests/sec: 42387.9092

  Total data:   14400000 bytes
  Size/request: 144 bytes

Response time histogram:
  0.000 [1]     |
  0.011 [93403] |■■■■■■■■■■■■■■■■■■■■■■■■■■■■■■■■■■■■■■■■
  0.022 [1568]  |■
  0.033 [3424]  |■
  0.044 [1354]  |■
  0.055 [0]     |
  0.066 [0]     |
  0.077 [217]   |
  0.088 [22]    |
  0.099 [2]     |
  0.110 [9]     |


Latency distribution:
  10% in 0.0025 secs
  25% in 0.0032 secs
  50% in 0.0042 secs
  75% in 0.0053 secs
  90% in 0.0074 secs
  95% in 0.0222 secs
  99% in 0.0350 secs

Details (average, fastest, slowest):
  DNS+dialup:   0.0000 secs, 0.0002 secs, 0.1100 secs
  DNS-lookup:   0.0001 secs, 0.0000 secs, 0.0839 secs
  req write:    0.0000 secs, 0.0000 secs, 0.0825 secs
  resp wait:    0.0056 secs, 0.0001 secs, 0.0796 secs
  resp read:    0.0001 secs, 0.0000 secs, 0.0795 secs

Status code distribution:
  [200] 100000 responses
hey -n 100000 -c 250 -m GET http://caddy:80/


Summary:
  Total:	5.6219 secs
  Slowest:	0.1762 secs
  Fastest:	0.0001 secs
  Average:	0.0137 secs
  Requests/sec:	17787.6741

  Total data:	20900000 bytes
  Size/request:	209 bytes

Response time histogram:
  0.000 [1]	|
  0.018 [79835]	|■■■■■■■■■■■■■■■■■■■■■■■■■■■■■■■■■■■■■■■■
  0.035 [8384]	|■■■■
  0.053 [5385]	|■■■
  0.071 [4909]	|■■
  0.088 [1263]	|■
  0.106 [193]	|
  0.123 [17]	|
  0.141 [3]	|
  0.159 [8]	|
  0.176 [2]	|


Latency distribution:
  10% in 0.0019 secs
  25% in 0.0038 secs
  50% in 0.0071 secs
  75% in 0.0140 secs
  90% in 0.0450 secs
  95% in 0.0562 secs
  99% in 0.0748 secs

Details (average, fastest, slowest):
  DNS+dialup:	0.0000 secs, 0.0001 secs, 0.1762 secs
  DNS-lookup:	0.0000 secs, 0.0000 secs, 0.0084 secs
  req write:	0.0000 secs, 0.0000 secs, 0.0049 secs
  resp wait:	0.0136 secs, 0.0001 secs, 0.1762 secs
  resp read:	0.0001 secs, 0.0000 secs, 0.0086 secs

Status code distribution:
  [200]	100000 responses