Google Earth Engine (GEE) Application to visualize and compare land cover changes and Digital Elevation Models (DEM) over the wetland areas of the Northern Gulf of Mexico and Florida at very high-resolutions.
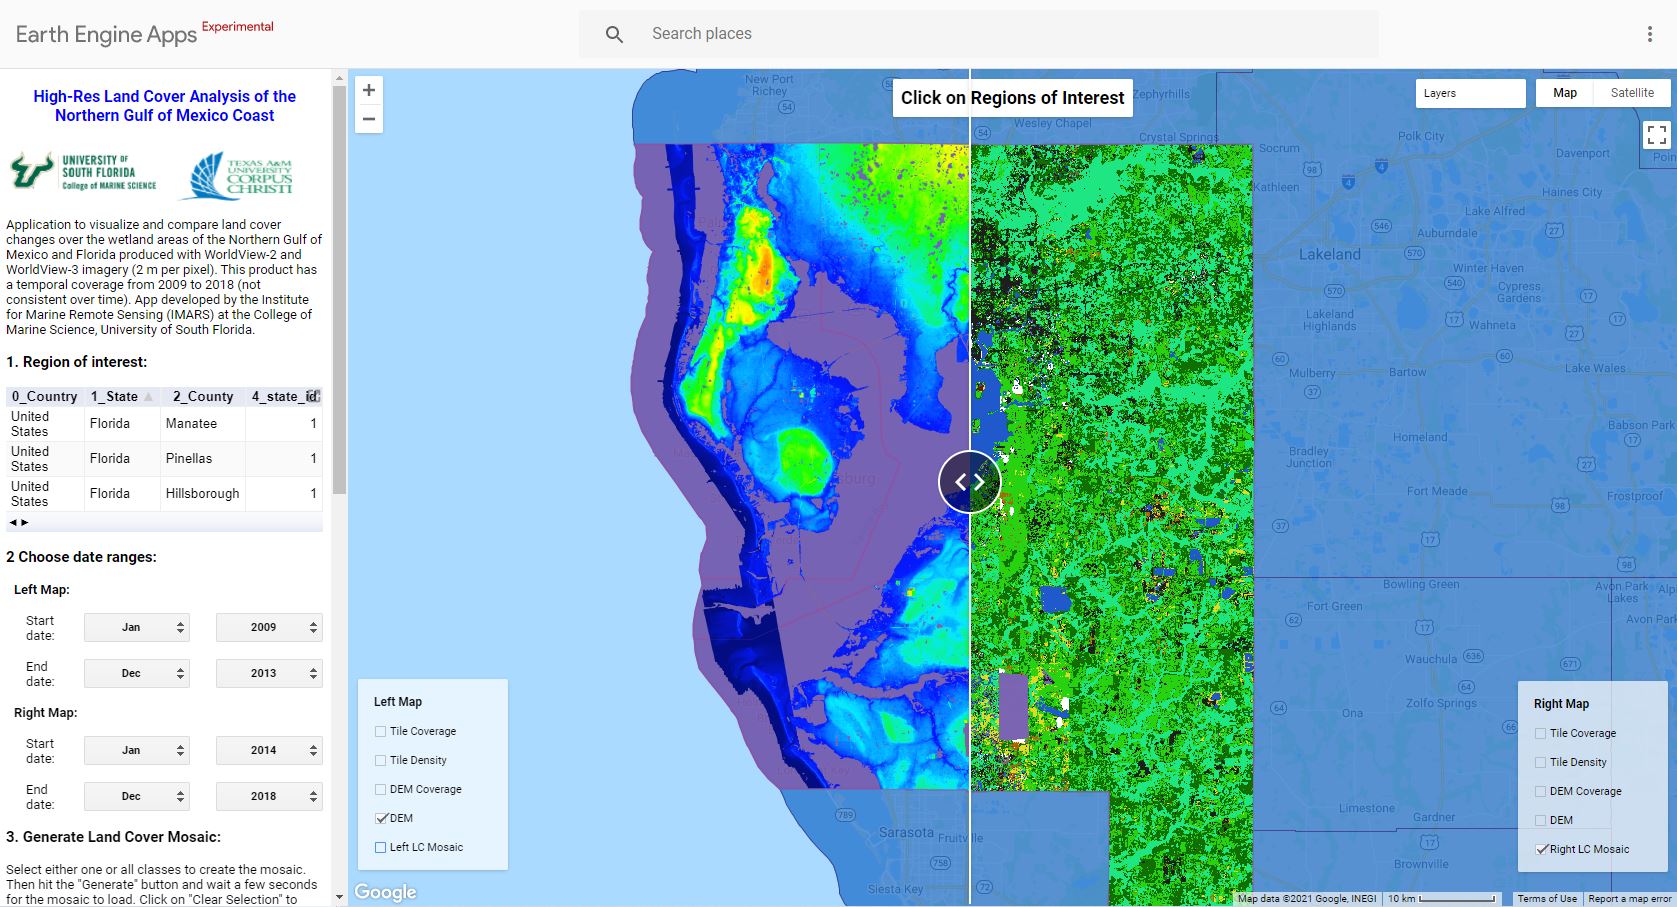
The 3D Wetlands App provide access to two large collections, (1) Landcover and (2) DEM, ingested to Earth Engine. The landcover product offer access to 12,929 processed and classified imagery at 2 m per pixel from WorldView-2 and WorldView-3 satellites, with temporal coverage from 2009 to 2018 (this is not consistent over time).
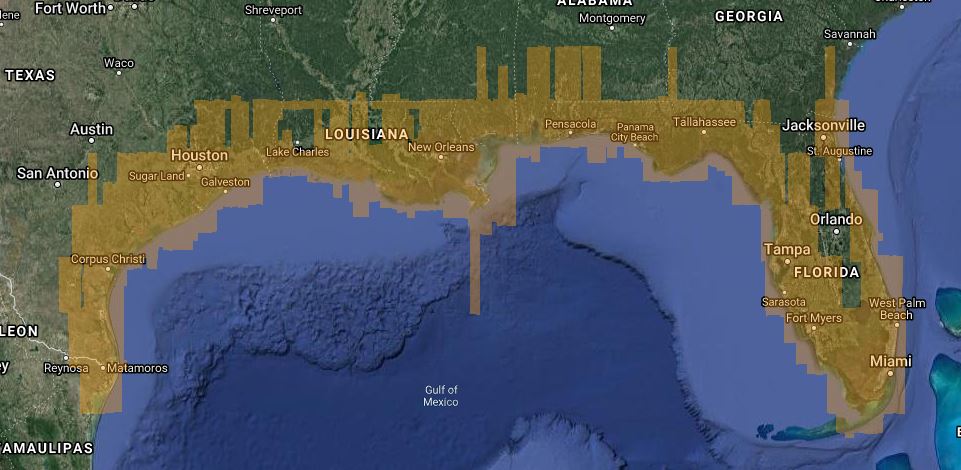
Satellite imagery coverage:
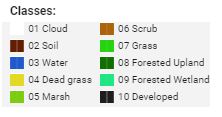
The landcover analysis includes the following classes:
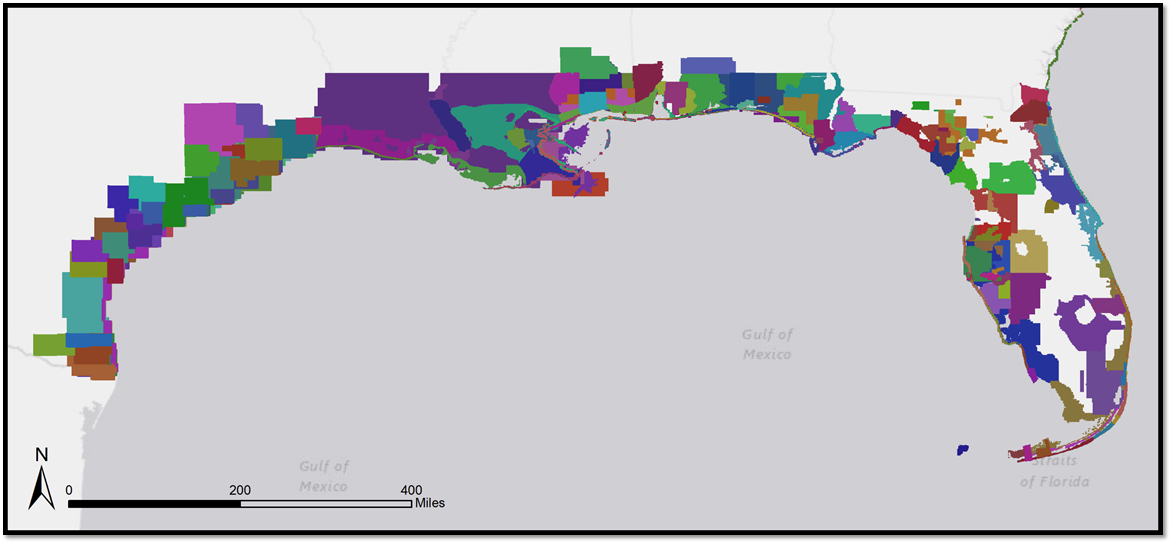
The DEM product was built with 178 airborne topographic Lidar surveys (bare-earth) over the wetland and coastal areas of the Northern Gulf of Mexico and Florida. This product has horizontal resolution of 2-m per pixel and vertical accuracy of 0.2 m.
DEM Coverage:
The 3D Wetlands App is open access through GEE. The users do not require a GEE account to use all the features available in the app interface. If the user has a GEE account can have access to an advanced version which will allow to export data to the respective Google Drive account by clicking a button. To this point previous experience with GEE is not required. However, the access of the landcover and DEM collections for other specific uses through the code editor previous knowledge with GEE is required (See the GEE Documentation).
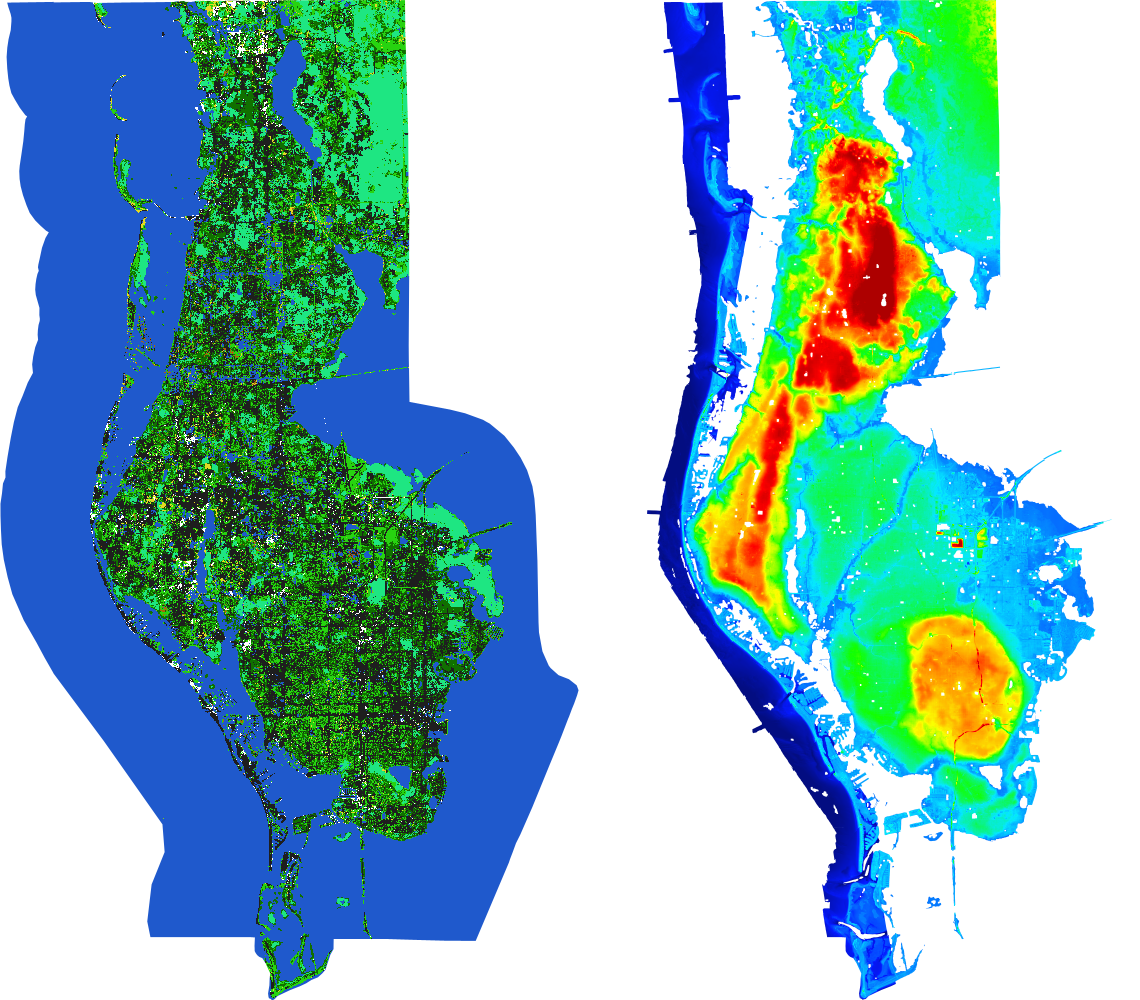
- Create, visualize and compare land cover mosaics of two user-defined periods in one or more selected Counties:

- Visualize the DEM associated to the selected Counties:
- See the number of images (land cover) available in selected Counties and number of images used to create a mosaic:
- Create mosaics including all or single landcover classes:
- Draw transects on the map and explore elevation and land cover profiles:
- Download the generated mosaics and DEM as .png, max resolution 1000x1000px (Basic Interface):
- Export the generated mosaics and DEM as a GeoTiff image (Advanced Interface):
- Calculate the area (km2) of each class in the mosaic for the whole region or at elevation ranges and export as a .csv file (Advanced Interface):
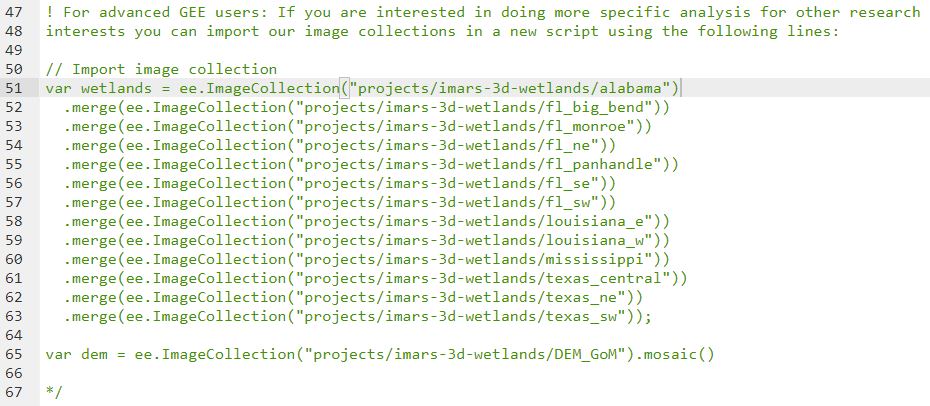
- Access to the whole landcover and DEM collections through the code editor (Advanced Interface).
- How are the landcover mosaics generated?
The landcover mosaics are generated by calculating the maximum value of each pixel across the stack of all available images in the selected Counties. This prioritazes classes with higher pixel values such as Developed (pixel value 11) and minimize the presence of clouds (pixel value 1). If a single class is selected, then the final mosaic is just a stack of the respective pixel values.
- Do I need a Google Earth Engine account to use the app?
No, everyone can use the 3D Wetlands app through the GEE App platform. But, a GEE account is required for exporting data and other advanced features.
- Can I have access to the landcover and DEM collections?
Yes, full access to the collections is possible trough the GEE code editor (Advanced Interface).
- Can I download the generated mosaics and DEM trough the app?
Yes, the mosaics can be downloaded as .png (Basic Interface) or .tiff (Advanced Interface).
- I don't see any map after pressing the "Generate" button
- Make sure you have selected at least one County.
- Make sure you have selected a valid period for both left and right maps.
- Check the number available images for the selected County and Tile Coverage Layer.
- I don't see any map or area estimations to be downloaded
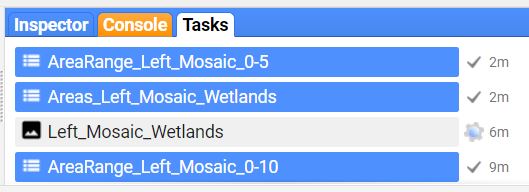
- Make sure you have pressed 'Run' in the Tasks tab.
- Check if the process is still running on server.
- Search for any new file in your Google Drive.
- Why I see an error when trying to plot a elevation profile?
The transect have to start from valid Land Cover and DEM values.
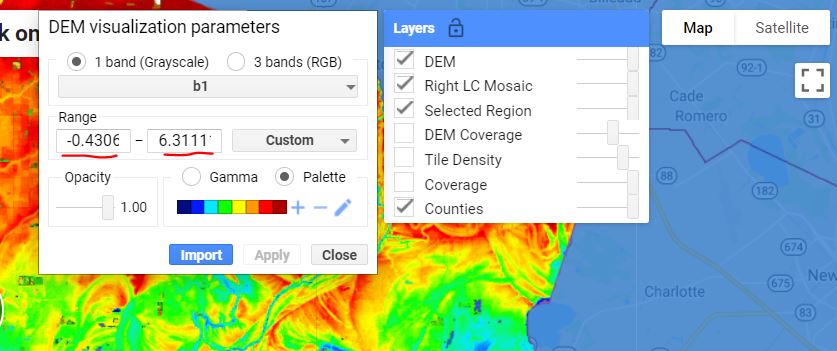
- Can I change the color bar legend of the DEM layer?
The color bar is generated automatically from percentile 1% to percentile 99%. The colors and raneg only can be edited by using the Layers button (right upper corner) eabled in the Advanced Interface. To edit the DEM layer of the left side of the map you need to drag the splitter all the way to the right of the Layers button.
The 3D Wetlands App provide access to processed satellite imagery and DEM data as a tool for public and academic use. The raw satellite data is property of DigitalGlobe. The 3D Wetlands App is a product of the ongoing research project Enhanced 3-D Mapping for Habitat, Biodiversity, and Flood Hazard Assessments of Coastal and Wetland Areas of the Southern US granted by NSF to Frank Muller-Karger and Timothy Dixon at the University of South Florida, in collaboration with James Gibeaut at the Harte Research Institute, TAMU-CC.
The WorldView imagery was processed at the Institute for Marine Remote Sensing (IMARS) at the College of Marine Science, University of South Florida and the DEM was acquired by the Harte Research Institute for Gulf of Mexico Studies at Texas A&M University - Corpus Christi. Google Earth Engine is the platform where the data is stored and distributed. Special thanks to Noel Gorelick who helped to ingest the image collections in GEE.