Dirichlet Boundary condition debugging (or visualization) #140
Comments
|
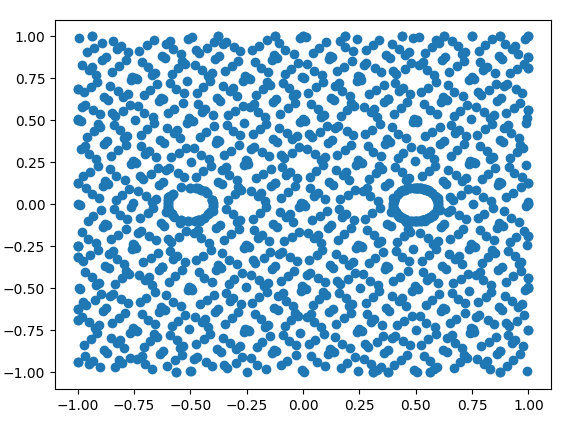
All the training points are in |
|
Thank you very much for your answer. However, But I want to plot only data on the boundaries. Specifically, I want to make the following boundary condition. This is what How can I get only boundary points from |

|
You can check You can also define the three BCs separately. |
|
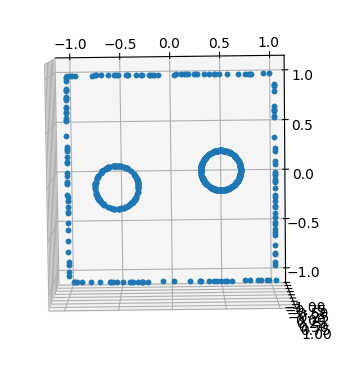
Thanks for your help! def plot_boundary_conditions(pde):
boundary_conditions = pde.bcs
X_train = np.array(pde.train_x)
plt.figure()
ax = plt.axes(projection=Axes3D.name)
mat = []
for bc in boundary_conditions:
x = bc.filter(X_train)
val = bc.func(x)
m = np.hstack((x, val))
mat.append(m)
mat = np.vstack(mat)
ax.plot3D(mat[:, 0], mat[:, 1], mat[:, 2], ".")
plt.show()
|
Thanks for the valuable addition! I tried to use your function but got this error: Please assist. |
|
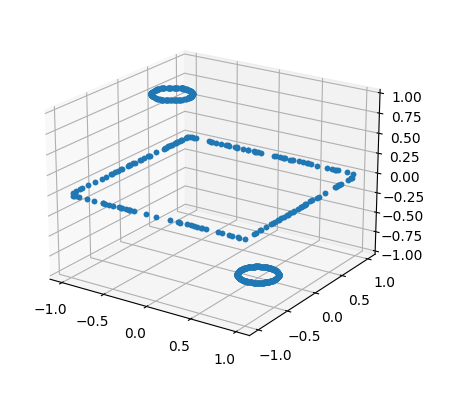
@engsbk Oh. I chose a very confusing variable name. def plot_boundary_conditions(pde_data):
boundary_conditions = pde_data.bcs
X_train = np.array(pde_data.train_x)
plt.figure()
ax = plt.axes(projection=Axes3D.name)
mat = []
for bc in boundary_conditions:
x = bc.filter(X_train)
val = bc.func(x)
m = np.hstack((x, val))
mat.append(m)
mat = np.vstack(mat)
ax.plot3D(mat[:, 0], mat[:, 1], mat[:, 2], ".")
plt.show()
def main():
def pde(x, y):
dy_x = tf.gradients(y, x)[0]
dy_x, dy_y = dy_x[:, 0:1], dy_x[:, 1:]
dy_xx = tf.gradients(dy_x, x)[0][:, 0:1]
dy_yy = tf.gradients(dy_y, x)[0][:, 1:]
return -dy_xx - dy_yy
def boundary_outer(x, on_boundary):
norm = np.sqrt(x[0]**2 + x[1]**2)
return on_boundary and (norm > 0.9)
def boundary_inner(x, on_boundary):
norm = np.sqrt(x[0]**2 + x[1]**2)
return on_boundary and (norm < 0.9)
def value_outer(x):
num_data = x.shape[0]
return np.zeros((num_data,1))
def value_inner(x):
num_data = x.shape[0]
return np.ones((num_data,1))
outer = dde.geometry.Rectangle([-1,-1], [1,1])
inner = dde.geometry.Rectangle([-0.5,-0.5], [0.5, 0.5])
geom = dde.geometry.CSGDifference(outer, inner)
bc_outer = dde.DirichletBC(geom, value_outer, boundary_outer)
bc_inner = dde.DirichletBC(geom, value_inner, boundary_inner)
data = dde.data.PDE(geom, pde, [bc_outer, bc_inner], num_domain=6000, num_boundary=600, num_test=15000)
net = dde.maps.FNN([2] + [50] * 4 + [1], "tanh", "Glorot uniform")
model = dde.Model(data, net)
plot_boundary_conditions(data)
model.compile("adam", lr=0.001)
losshistory, train_state = model.train(epochs=50000)
model.compile("L-BFGS-B")
losshistory, train_state = model.train()
dde.saveplot(losshistory, train_state, issave=True, isplot=True)
if __name__ == "__main__":
main()I had to make a clear distinction between the pde function and pde data. |
|
@KeunwooPark Hi, |
|
Hi @KarimMache |
|
Hi @KeunwooPark, if name == "main": |
|
@KarimMache |
|
Hi @KeunwooPark, thank you a lot |
|
@KeunwooPark, |
|
@KarimMache data = dde.data.PDE(geom, pde, [bc_outer, bc_inner], num_domain=6000, num_boundary=600, num_test=15000)
# geom: Domain infomation
# bc_* : boundary conditions
# num_domain: number of samples inside the domain for training
# num_boundary: number of samples on the boundary for training
# num_test: number of samples inside the domain for testingFor the time dependant PDE, Burgers might be helpful. For the saving part, you can save each data matrix in a PDE object (train_x, train_y, etc.) in a pickle as you did in the previous comment. |
|
@KeunwooPark, if name == "main": |
|
@KarimMache data = dde.data.PDE(geom, pde, [bc_outer, bc_inner], num_domain=6000, num_boundary=600, num_test=15000)
with open("data.pkl", 'wb') as f:
pickle.dump(data.train_x, f, pickle.HIGHEST_PROTOCOL)
pickle.dump(data.train_y, f, pickle.HIGHEST_PROTOCOL)
pickle.dump(data.test_x, f, pickle.HIGHEST_PROTOCOL)
pickle.dump(data.test_y, f, pickle.HIGHEST_PROTOCOL)When loading, data = dde.data.PDE(geom, pde, [bc_outer, bc_inner])
with open("data.pkl", 'rb') as f:
data.train_x = pickle.load(f)
data.train_y = pickle.load(f)
data.test_x = pickle.load(f)
data.text_y = pickle.load(f)
data.num_test = data.test_x.shape[0] |
Hi.
Is there any tool for visualizing DirichletBC?
I'm trying to solve the Poisson equation with different 2D shapes and it doesn't work as expected.
I want to check if my boundary conditions are set as intended.
If there is a visualization tool for boundary conditions, my problem would be solved, but I couldn't find one.
Do you have any suggestions for debugging DirichletBC?
The text was updated successfully, but these errors were encountered: