Geo Mapper is a python script focused on giving geographical visualization of social networks by showing the connections between the users inside the network. The script was created for social network analysis and can be applied on any datasets with location-based information available.
I've been looking after some visualization tools for social networks in order to present a visual representation of the the Atepassar social network, helping me to see how the users are connected and visualize the friendships between them.
AtePassar is a famous educational brazilian social network for students all around Brazil that study for exams to get a civil public job. Nowadays I work for as a cientist chief responsible of creating and bringing collective intelligence to improve the features of the website. I was performing some analysis over the social network and how the students interacted. So I decided to create a new visualization that showed how geography and political borders affected where students lived relative to their friends.
The social network in March,2013 has more than 200k users from several cities of the country.
I've coded a Python script which exports the data from the social network profile users and then convert it to a structured file with information of each user's current city and summed the number of friends between each pair of cities. Then, I merged the data with the longitude and latitude of each city. The coordinates of the brazilian cities were fetched from the Google Map's API where I queried the coordinates by providing the address (city, state, Country) of each user.
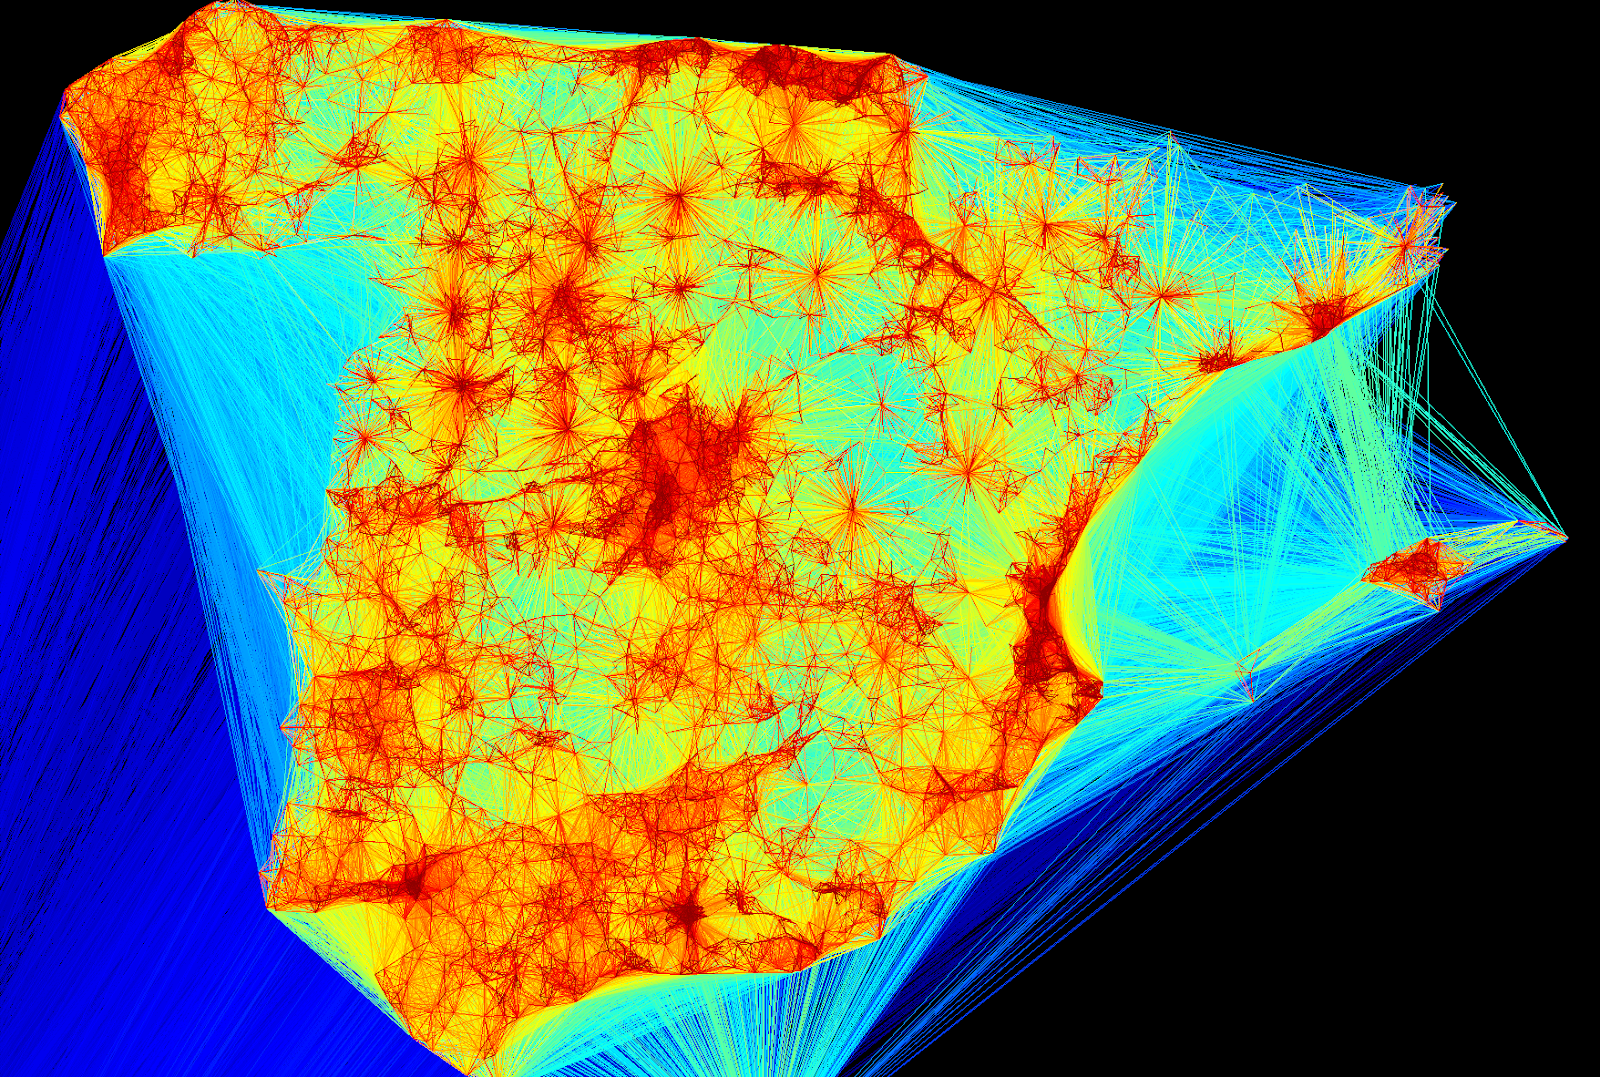
The result is shown below:
Atepassar Social Network Connections

There are some interesting insights about it:
Notice that we only draw student connections, no other geographic information is needed. Brazi's geographical shape and population distribution emerge naturally, showing the denser populated regions, nearly unpopulated areas and also the local hubs: smaller cities with many connections to the neighbouring towns.
Yes, you can use it for your own social network!
To run it download the script geo_mapper.py . It requires the libraries: PIL, Matplotlib and Numpy.
The parameters for the script are:
if __name__ == '__main__':
    parser = OptionParser(usage=SUPPRESS_USAGE)
    print 'geocialMapper v.%s\nBy %s\n' %(__version__,__author__)
    print "Type --help parameter for help.\n"

    parser.add_option('-i','--input-file',dest='input_file',
                       help='Pickle object file with coordinates and quantity')
    parser.add_option('-s','--size',dest='size',
                       help='image dimmensions height,width')
    parser.add_option('-o', '--output-file', dest='output_file', default= 'map.jpg',
                       help='Output file for saving the image')
    parser.add_option('-c', '--colormap', dest='mode', default='wb',
                       help='Mode of colormap used: wb, all')
    parser.add_option('-p', '--connection', dest='n_connections', default=0, type='int',
                       help= 'Threshold for the number of interconnections between cities')

    (options,args) = parser.parse_args()

    if not options.input_file:
        parser.error('You must specifiy a valid pickle object to load data (-i parameter) !')

    if not options.size:
        parser.error('You must specifiy the dimmensions of the image (-s parameter) !')

    run_main(options)
The input-file must be a dict serialized on pickle file, which the elements are:
{ ((latO,longO),(latD,longD)): qtd, ...}

#(latO,longO) are the latitude and longitude of the origin location. Both are float values.
#(latD,longD) ate the latitude and longitude of the destiny location. Both are float values.
#qtd: An integer that represents the number of connections between both coordinates (cities).
The size is the output image dimmensions. Ex: 600,600
The output-file is the destination for saving the image.
The colormap used for plotting the lines.
Calling the script:
$ python geo_mapper.py -i data.pk -s 1600,1600 -o output_map.jpg
The result will be the data.pk coordinates plotted on a image saved with the name output_map.jpg and
dimmensions 1600x1600.
Tuenti visualization social network by Andreas Kaltenbrunner
Send issues, proposals, etc. to github's issue tracker .
If you've got questions regarding development, you can email me directly at marcel@atepassar.com
Latest sources are available from github:
https://github.com/marcelcaraciolo/Geo-Friendship-Visualization
This module was written by Marcel Caraciolo
Simplified BSD