
These datasets are currently included:
- MLB2016
- USA_Election_2016
All datasets include the market lines from www.pinnacle.com for the events and timestamps are in UTC. Bettings odds are in the USODDS format that can be transformed into other formats (e.g. probability) with the use of library(odds.converter).
# Install from Cran
install.packages("pinnacle.data")

# Or the the development version from GitHub:
# install.packages("devtools")
devtools::install_github("marcoblume/pinnacle.data")
This dataset contains all wagering lines for the entire MLB 2016 season including playoffs. The data is in tibble format with metadata such as time, team names, starting pitchers, etc. In-Game data is stored in a nested column named "Lines".
Example question: What was the range of expected total runs according to the prediction market at Pinnacle?
library(tidyverse)

MLB2016 %>%
  unnest() %>%
  group_by(GameID) %>%
  arrange(desc(EnteredDateTimeUTC)) %>%
  slice(1) %>%
  ungroup() %>%
  group_by(TotalPoints) %>%
  summarize(Count = n())

# A tibble: 16 x 2
   TotalPoints Count
         <dbl> <int>
 1         5.5     2
 2         6.0    16
 3         6.5    54
 4         7.0   196
 5         7.5   464
 6         8.0   421
 7         8.5   513
 8         9.0   425
 9         9.5   180
10        10.0    74
11        10.5    46
12        11.0    24
13        11.5    18
14        12.0    11
15        12.5    15
16        13.0     3
Example question: How many games went Over/Under/Landed on the total?
library(tidyverse)

MLB2016 %>%
  unnest() %>%
  group_by(GameID) %>%
  arrange(desc(EnteredDateTimeUTC)) %>%
  slice(1) %>%
  ungroup() %>%
  select(GameID,TotalPoints,FinalScoreAway,FinalScoreHome) %>%
  mutate(TotalOutcome = case_when(
    FinalScoreAway + FinalScoreHome > TotalPoints ~ "Over",
    FinalScoreAway + FinalScoreHome < TotalPoints ~ "Under",
    FinalScoreAway + FinalScoreHome == TotalPoints ~ "Landed"
    )
) %>%
  group_by(TotalPoints,TotalOutcome) %>%
  summarize(Count = n()) %>%
  print(n=100)

# A tibble: 37 x 3
# Groups:   TotalPoints [?]
   TotalPoints TotalOutcome Count
         <dbl>        <chr> <int>
 1         5.5        Under     2
 2         6.0         Over     7
 3         6.0        Under     9
 4         6.5         Over    30
 5         6.5        Under    24
 6         7.0       Landed    19
 7         7.0         Over    91
 8         7.0        Under    86
 9         7.5         Over   234
10         7.5        Under   230
11         8.0       Landed    31
12         8.0         Over   212
13         8.0        Under   178
14         8.5         Over   249
15         8.5        Under   264
16         9.0       Landed    52
17         9.0         Over   186
18         9.0        Under   187
19         9.5         Over    84
20         9.5        Under    96
21        10.0       Landed     5
22        10.0         Over    33
23        10.0        Under    36
24        10.5         Over    16
25        10.5        Under    30
26        11.0       Landed     2
27        11.0         Over    12
28        11.0        Under    10
29        11.5         Over    10
30        11.5        Under     8
31        12.0       Landed     2
32        12.0         Over     4
33        12.0        Under     5
34        12.5         Over     7
35        12.5        Under     8
36        13.0       Landed     1
37        13.0         Over     2
US 2016 Presidential Election data is also available now:
library(pinnacle.data)
USA_Election_2016

# A tibble: 1,443 × 5
       EnteredDateTime      TeamName1    TeamName2 MoneyUS1 MoneyUS2
                <dttm>          <chr>        <chr>    <dbl>    <dbl>
1  2016-07-18 09:34:38 Hilary Clinton Donald Trump     -243      212
2  2016-07-18 19:15:42 Hilary Clinton Donald Trump     -251      218
3  2016-07-19 04:49:41 Hilary Clinton Donald Trump     -260      226
4  2016-07-19 21:48:05 Hilary Clinton Donald Trump     -281      243
5  2016-07-21 17:47:46 Hilary Clinton Donald Trump     -275      238
6  2016-07-21 20:09:50 Hilary Clinton Donald Trump     -271      235
7  2016-07-21 20:36:35 Hilary Clinton Donald Trump     -253      220
8  2016-07-21 20:37:24 Hilary Clinton Donald Trump     -237      207
9  2016-07-21 20:49:05 Hilary Clinton Donald Trump     -233      204
10 2016-07-21 20:55:19 Hilary Clinton Donald Trump     -252      219
# ... with 1,433 more rows
Note that we only have monney line prices for this event because outcome of the election is binary.
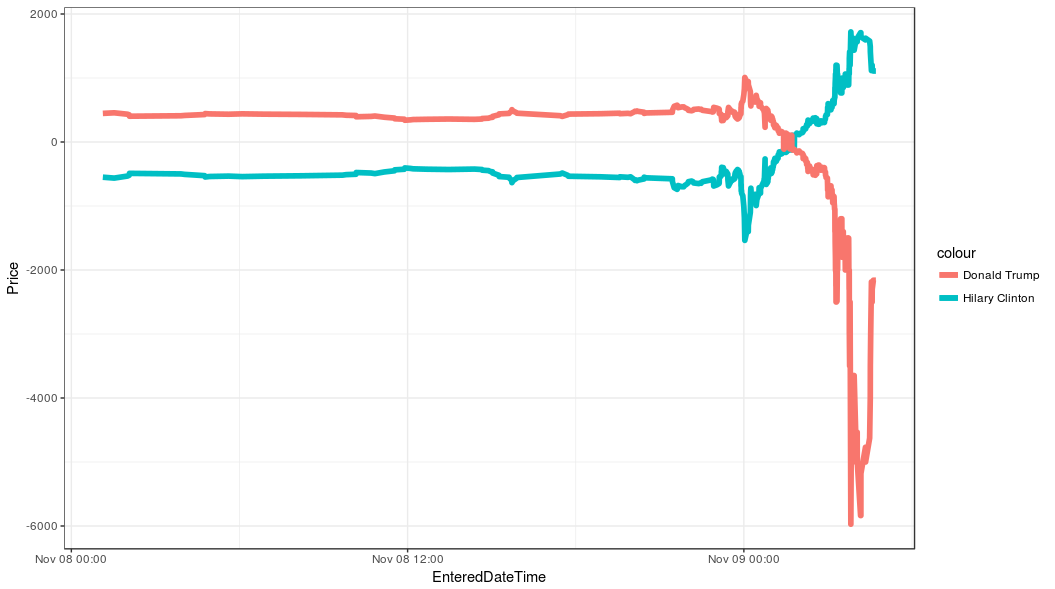
We can easily plot and track how the prices of Hilary Clinton and Donald Trump changed:
library(ggplot2)

ggplot(data = USA_Election_2016 %>% filter(EnteredDateTime >='2016-11-08')) +
  geom_line(alpha = 1,
            size = 2,
            aes(x= EnteredDateTime,
                y = MoneyUS1,
                color = "Hilary Clinton")) +
  geom_line(alpha = 1,
            size = 2,
            aes(x= EnteredDateTime,
                y = MoneyUS2,
                color = "Donald Trump")) +
  theme_bw() +
  ylab("Price")