Intersection between spline and line #349
Comments
|
This is a VERY interesting question... the intersect with line thing expects a polygonal mesh that's why it doesnt work.. one dirty trick is to extrude the polyline to become a mesh... E.g. i need to think if there is a more elegant way of achieving the same. |
|
..an example of the above: from vedo import *
line1 = Line(Circle().points()).lw(5).c('black')
line2 = Line((-2,-1.5),(2,2)).lw(5).c('green')
m1 = line1.extrude(1).shift(0,0,-0.5)
p = Points(m1.intersectWithLine(*line2.points()), r=20).c('red')
show(line1, line2, p, axes=1)
|

|
Thank you Marco! Your suggestion did work with converting the spline to a mesh. However, if I want to intersect two splines / lines in 3D, generated by the function |

|
uhm .. you may navigate along one (arbitrarily curved) 3d polyline and check for closest point.. not sure if this kind of brute force approach is ok for your needs: from vedo import *
circle = Line(Circle().points()).lw(5).c('black')
line2 = Line((-2,-1.5),(2,2), res=10).lw(5).c('green')
spline2 = Spline(line2, res=100) # oversample line2
hits = []
for p in spline2.points():
cpt = circle.closestPoint(p)
if mag2(p-cpt)<0.001:
hits.append(p)
# print(array(hits))
hits = Points(hits, r=20, c='r')
show(circle, line2, hits, axes=1)Another option: from vedo import *
circle = Line(Circle().points()).lw(5).c('black')
circlemesh = circle.extrude(1)
line2 = Line((-2,-1.5),(2,2), res=10).lw(5).c('green')
spline2 = Spline(line2, res=100) # Optionally oversample line2
hits = []
spl_pts = spline2.points()
for i in range(len(spl_pts)-1):
hits += circlemesh.intersectWithLine(spl_pts[i], spl_pts[i+1]).tolist()
hits = Points(hits, r=20, c='r')
show(circle, line2, hits, axes=1)or else you might extrude both and then find the intersection? |
|
Thank you for the two suggestions! It works :) I ended up organizing the points clockwise by using the from vedo import *
import math
import numpy as np
from scipy.spatial import cKDTree
from functools import partial
def clockwiseangle_and_distance(point, origin, refvec):
""" order a set of points in a clockwise direction
taken from: https://stackoverflow.com/questions/41855695/sorting-list-of-two-dimensional-coordinates-by-clockwise-angle-using-python
"""
# Vector between point and the origin: v = p - o
vector = [point[0]-origin[0], point[1]-origin[1]]
# Length of vector: ||v||
lenvector = math.hypot(vector[0], vector[1])
# If length is zero there is no angle
if lenvector == 0:
return -math.pi, 0
# Normalize vector: v/||v||
normalized = [vector[0]/lenvector, vector[1]/lenvector]
dotprod = normalized[0]*refvec[0] + normalized[1]*refvec[1] # x1*x2 + y1*y2
diffprod = refvec[1]*normalized[0] - refvec[0]*normalized[1] # x1*y2 - y1*x2
angle = math.atan2(diffprod, dotprod)
# Negative angles represent counter-clockwise angles so we need to subtract them
# from 2*pi (360 degrees)
if angle < 0:
return 2*math.pi+angle, lenvector
# I return first the angle because that's the primary sorting criterium
# but if two vectors have the same angle then the shorter distance should come first.
return angle, lenvector
#create two cylinders
cyl1 = Cylinder(pos=(0,0,0), r=2, height=3, axis=(1,0,0), c='teal3', alpha=1, cap=False, res=500)
cyl2 = Cylinder(pos=(0,0,2), r=1, height=2, axis=(0,0.3,1), c='teal3', alpha=1, cap=False, res=500)
cyl1.triangulate()
cyl2.triangulate()
intersect = cyl1.intersectWith(cyl2)
spline_unorganized = Spline(intersect.points())
intersect_2D =intersect.points()[:,0:2] # project the points to plane
#find the point intersection between the cyl2 axis and cyl1 surface
cyl2_axis = np.array([0,0.3,1])
p1 = cyl2_axis+cyl2.pos()
p2 = -cyl2_axis+cyl2.pos()
axis_intersect = cyl1.intersectWithLine(p1,p2)
refvec = [0,1]
intersect_clockwise = sorted(intersect_2D, key=partial(clockwiseangle_and_distance, origin = axis_intersect[0], refvec = refvec))
intersect_clockwise = np.asarray(intersect_clockwise)
spline_2d = Spline(intersect_clockwise)
#find the z coordinate in the intersect curve
d,idx = cKDTree(intersect_2D).query(intersect_clockwise, k=1)
t = idx[np.isclose(d,0)]
intersect_curve_clockwise = []
for i in range (0, len(t)):
intersect_curve_clockwise.append(intersect.points()[t[i]])
spline_3d = Spline(intersect_curve_clockwise)
show(spline_3d.c('b').lw(5), spline_unorganized.c('r'))Is there a way to do this with some of the functions in vedo? Or an easier/better way? |

|
Hi, very interesting issue! from vedo import *
def order_boundary(msh):
poly = msh.join().polydata(False)
poly.GetPoints().SetData(poly.GetCell(0).GetPoints().GetData())
return msh
#create two cylinders
cyl1 = Cylinder(pos=(0,0,0), r=2, height=3, axis=(1,0,0), alpha=.1, cap=0, res=50).triangulate()
cyl2 = Cylinder(pos=(0,0,2), r=1, height=2, axis=(0,0.3,1), alpha=.1, cap=0, res=50).triangulate()
intersect = order_boundary(cyl1.intersectWith(cyl2))
spline = Spline(intersect)
show(cyl1, cyl2, spline.c('b').lw(5), intersect.labels('id').c('r4'), axes=1)
|

|
Nice ! Thank you! This is a much better solution! Appriacete your dedication to this package :) I also find it very interesting to find out the point/points with maximum curvature in a spline, like the 4 points in the figure below(P1-P4). This spline is from your last comment. I looked into your Spline function source, and I see that you use these functions: |

|
You can compute the (signed) curvature of a 3d curve by fitting circles analytically (so it's superfast):
|

|
Sorry for the late reply! Been offline because of easter. Thanks for the suggested solution for computing the signed curvature of a line! I tried to compute the signed curvature of the spline by using the linked example. I find the point with the greatest curvature to be the point(P1 in the figure). However, I have a problem finding the other three local max/minimum of the spline. I also tried to split the spline into multiple lines and then computing the curvature. By looking at the curvature array, I see that the curvature in the points isn't the greatest/smallest. Is there a way to find a local maximum/minimum points? from vedo import *
import numpy as np
def order_boundary(msh):
poly = msh.join().polydata(False)
poly.GetPoints().SetData(poly.GetCell(0).GetPoints().GetData())
return msh
#create two cylinders
cyl1 = Cylinder(pos=(0,0,0), r=2, height=3, axis=(1,0,0), alpha=.1, cap=0, res=250).triangulate()
cyl2 = Cylinder(pos=(0,0,2), r=1, height=2, axis=(0,0.3,1), alpha=.1, cap=0, res=250).triangulate()
intersect = order_boundary(cyl1.intersectWith(cyl2))
spline = Spline(intersect).lw(3)
points = spline.points()
fitpts, circles, curvs = [], [], []
n = 3 # nr. of points to use for the fit
for i in range(spline.NPoints() - n):
pts = points[i:i+n]
center, R, normal = fitCircle(pts)
z = cross(pts[-1]-pts[0], center-pts[0])[2]
curvs.append(sqrt(1/R)*z/abs(z))
if R < 0.75:
circle = Circle(center, r=R).wireframe().orientation(normal)
circles.append(circle)
fitpts.append(center)
curvs += [curvs[-1]]*n # fill the missing last n points
#shape.lw(8).cmap('rainbow', curvs).addScalarBar3D(title='\pm1/\sqrtR')
#show(shape, circles, Points(fitpts), __doc__, axes=1)
sorted_curvs = np.sort(curvs)
max_curvature = points[np.where(curvs == sorted_curvs[-1])[0][0]]
min_curvature = points[np.where(curvs == sorted_curvs[0])[0][0]]
p_1 = Points([max_curvature], r=10).c('r')
p_min = Points([min_curvature], r=10).c('g')
show(p_1, p_min, spline, axes =1)
|

|
there seem to be various problems....
from vedo import *
from vedo.pyplot import plot
cyl1 = Cylinder(pos=(0,0,0), r=2, height=3, axis=(1,0,0), alpha=.1, cap=0, res=100).triangulate()
cyl2 = Cylinder(pos=(0,0,2), r=1, height=2, axis=(0,0.3,1), alpha=.1, cap=0, res=100).triangulate()
intersect = cyl1.intersectWith(cyl2).join(reset=True)
spline = Spline(intersect).lw(3)
points = spline.points()
print("spline points", spline.N())
fitpts, circles, curvs = [], [], []
n = 200 # nr. of points to use for the fit
for i in range(spline.NPoints() - n):
pts = points[i:i+n]
center, R, normal = fitCircle(pts)
curvs.append(sqrt(1/R))
curvs += [curvs[-1]]*n # fill the missing last n points (WRONG HERE!)
spline.lw(8).cmap('rainbow', curvs).addScalarBar3D(title='\pm1/\sqrtR')
intersect.shift(0,0,0.1).pointSize(2) # to make it visible
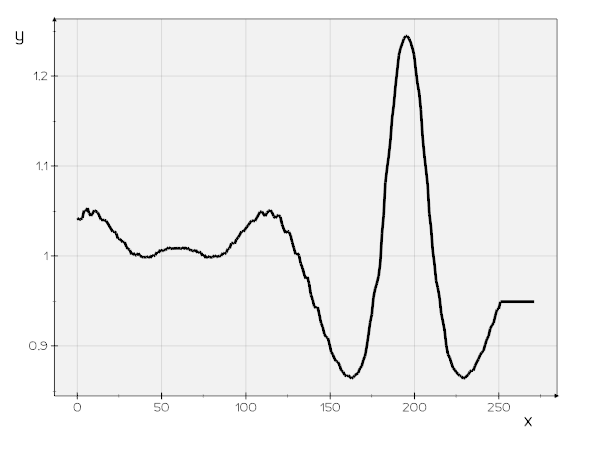
pcurv = plot(curvs, '-') # plot curvature values
show([[intersect, spline, Axes(spline)], # first renderer
pcurv, # second renderer
], N=2, sharecam=False)
from vedo import *
from vedo.pyplot import plot

cyl1  = Cylinder(pos=(0,0,0), r=2, height=3, axis=(1,0,0), alpha=.1, cap=0, res=100).triangulate()
cyl2  = Cylinder(pos=(0,0,2), r=1, height=2, axis=(0,0.3,1), alpha=.1, cap=0, res=100).triangulate()

intersect = cyl1.intersectWith(cyl2).join(reset=True)
spline = Spline(intersect).lw(3)
spline = intersect
points = spline.points()
print("spline points", spline.N())

fitpts, circles, curvs = [], [], []
n = 20                   # nr. of points to use for the fit
for i in range(spline.NPoints() - n):
    pts = points[i:i+n]
    center, R, normal = fitCircle(pts)
    curvs.append(sqrt(1/R))
curvs += [curvs[-1]]*n    # fill the missing last n points (WRONG HERE!)

spline.lw(8).cmap('rainbow', curvs).addScalarBar3D(title='\pm1/\sqrtR')

isc = intersect.clone().shift(0,0,0.1).pointSize(3).c('k') # to make it visible
pcurv = plot(curvs, '-')  # plot curvature values

show([[isc, spline, Axes(spline)], # first renderer
        pcurv,                            # second renderer
      ], N=2, sharecam=False)
PS: as a test, the fitCircle() seems to work as expected..: from vedo import *
spline = Line(Circle().scale([1,0.8,1]).rotateY(10))
points = spline.points()
fitpts, circles, curvs = [], [], []
n = 3 # nr. of points to use for the fit
for i in range(spline.NPoints() - n):
pts = points[i:i+n]
center, R, normal = fitCircle(pts)
curvs.append(sqrt(1/R))
curvs += [curvs[-1]]*n
spline.lw(8).cmap('rainbow', curvs)
pcurv = pyplot.plot(curvs)
show([[spline, Axes(spline)], pcurv], N=2, sharecam=False)
|


|
Looking into the mentioned problem 1. above, would this fix the looping problem? However, finding points P1-P4 (figure in my last comment) seems to not be so straightforward computing the signed curvature of a line. The line from vedo import *
from vedo.pyplot import plot
import numpy as np
cyl1 = Cylinder(pos=(0,0,0), r=2, height=3, axis=(1,0,0), alpha=.1, cap=0, res=100).triangulate()
cyl2 = Cylinder(pos=(0,0,2), r=1, height=2, axis=(0,0.3,1), alpha=.1, cap=0, res=100).triangulate()
intersect = cyl1.intersectWith(cyl2).join(reset=True)
spline = Spline(intersect).lw(3)
spline = intersect
points = spline.points()
print("spline points", spline.N())
fitpts, circles, curvs = [], [], []
n = 30 # nr. of points to use for the fit
points2 = np.append(points, points[0:n], axis=0) #append so the last points in the points2 are the first ones of points
for i in range(spline.NPoints()):
pts = points2[i:i+n]
center, R, normal = fitCircle(pts)
curvs.append(sqrt(1/R))
#curvs += [curvs[-1]]*n # This line is now unnecessary?
spline.lw(8).cmap('rainbow', curvs).addScalarBar3D(title='\pm1/\sqrtR')
isc = intersect.clone().shift(0,0,0.1).pointSize(3).c('k') # to make it visible
pcurv = plot(curvs, '-') # plot curvature values
show([[isc, spline, Axes(spline)], # first renderer
pcurv, # second renderer
], N=2, sharecam=False)
|

yep, that looks like a clever solution
Indeed it's not straightforward as there are 8 such points! you may take the 1d derivative of the plot and look for zero crossings. You may also try to reduce the extra points coming from the splining, as these may be the cause of the extra small "wiggles", by lowering the resolution e.g.
Correct. |
|
Thanks! I will look into that! Also, I'm very interested in fitting a cylinder to a scattered point cloud data to obtain the cylinder axis, a point on the axis, and the radius. Could the |
No, I would rather think of solving that analytically (if you need a fast algorithm) or use a |
Okey, I will look into those examples! |
uhm, i'm not sure .. it doesn't look an analytic solution though as it uses |
|
Hi again Marco! Another question related to the axes properties of the |

|
Hi @eivindtn from vedo import *
cu = Cube().alpha(0.2)
cu_ax = Axes(cu)
cu.rotateX(15).shift(0,1,2)
T = cu.getTransform()
writeTransform(T, 'trfrm.mat')
T = loadTransform('trfrm.mat')[0]
print([T])
cu_ax2 = Axes(Cube())
cu_ax2.applyTransform(T)
show(cu_ax, cu, cu_ax2, axes=2)
PS: please always open a new issue if a question is not related to the current title (it's easier for me to track) |

|
Thank you for the example! Sorry, I will from now open a new issue when it is not related to the current title! |

No, I'm afraid.
Yes, you can create any axes ranges by passing the arguments e.g. The other way you're doing looks also correct (the colored axes above). |
|
Thank you @marcomusy ! |
Hey @marcomusy
Thanks for this great package!
A simple question, is there a way to find the intersection points between a spline and line/spline in 2d/3d?
When I use the function
spline_2d.intersectWithLine(p1, p2), I get an empty array in return. Is this because the spline is not set as a mesh?In advance, thank you!
Regards,
Eivind
The text was updated successfully, but these errors were encountered: