Skip to content
New issue

Have a question about this project? Sign up for a free GitHub account to open an issue and contact its maintainers and the community.

By clicking “Sign up for GitHub”, you agree to our terms of service and privacy statement. We’ll occasionally send you account related emails.

Already on GitHub? Sign in to your account

Overlay a network over voronoi testellation #478

Closed
DeepaMahm opened this issue Oct 9, 2021 · 10 comments
Closed

Overlay a network over voronoi testellation #478

DeepaMahm opened this issue Oct 9, 2021 · 10 comments

Comments

@DeepaMahm
Copy link

Hi @marcomusy,

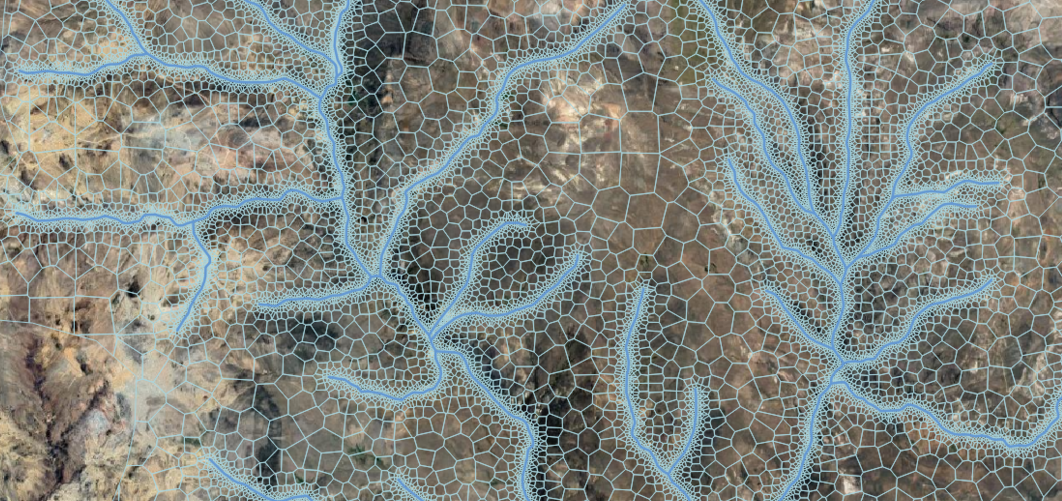
I would like to create a geometry like the following in vedo.

source
image

For this, I would like to use vedo

  1. create a network like this Labelling while plotting time-series data over a network #341
  2. overlay a Voronoi tessellation on the network in step 1. Delaunay triangulation from voronoi tessellation #475
  3. find the index of the Voronoi cells through which the network edge traverses

I am not sure how to do step 3. Could you please give some ideas and help me with this?

Thanks a lot for all your support

@marcomusy
Copy link
Owner

marcomusy commented Oct 9, 2021

Hi Deepa, the example on the web deosn't work me, anyway, try

#!/usr/bin/env python3
#
import geopandas as gpd, numpy as np
from scipy.spatial import Voronoi
from vedo import Points, Grid, delaunay2D, Mesh, show

shape = gpd.read_file('shps/rios.shp')

def vertexAsList(shape):
    vertexList = []
    for line in shape.iterrows():
        partialList = []
        if line[1].geometry.geom_type == 'Polygon':
            pointList = line[1].geometry.exterior.coords.xy
        elif line[1].geometry.geom_type == 'LineString':
            pointObject = line[1].geometry.coords.xy
            pointList = list(zip(pointObject[0],pointObject[1]))
            for index, point in enumerate(pointList):
                partialList.append(point)
        vertexList += partialList
    return np.array(vertexList)-[610000,8300000]

pts = Points(vertexAsList(shape))#.densify(.01)

grid = Grid([14500, 61700, 0], sx=24000, sy=26000, resx=30, resy=30).ps(1)
allpts = pts.points().tolist() + grid.points().tolist()
allpts = np.array(allpts)

deln = delaunay2D(allpts).lw(0.1)
#deln.smooth()

#vor = voronoi(allpts[:,(0,1)]) ## VTK IS TOO SLOW ON THIS!
vor = Voronoi(deln.points()[:,(0,1)])

regs = [] # filter out invalid indices
for r in vor.regions:
    flag=True
    for x in r:
        if x<0: flag=False
    if flag and len(r):
        regs.append(r)

msh = Mesh([vor.vertices, regs])
msh.lw(0.1).cmap('Set3', list(range(len(regs))), on='cells')

show([deln, [msh,Points(deln)]], N=2, axes=dict(digits=3))

Screenshot from 2021-10-09 20-33-40

@DeepaMahm
Copy link
Author

@marcomusy,
I am a little bit confused with this line

grid = Grid([14500, 61700, 0], sx=24000, sy=26000, resx=30, resy=30).ps(1)
I understand sx and sy are the size of x and y axes. Does size mean x and y limits? Or is this [14500, 61700, 0] the limits?

Could you please clarify?

@marcomusy
Copy link
Owner

@DeepaMahm
Copy link
Author

@marcomusy,

Thank you. What is still not clear to me is the following:
sy = 26000 which I understand is the total size of the y axis. In the plot I see y positions above 7.00 E+4. So I am not sure why the y values exceeds sy. I am sorry if I am missing something that's obvious. Could you please explain this?

Also could you please clarify if [14500, 61700, 0] corresponds to the position (/position of which attribute)?

@marcomusy
Copy link
Owner

pos indicates the position of the center of the Grid, so 61700+26000÷2=74700 seems correct to me.

from vedo import Grid
Grid().show(axes=8)

@DeepaMahm
Copy link
Author

Ahh, thanks a ton! this clarifies my doubts.

@DeepaMahm
Copy link
Author

Hi @marcomusy ,

I have an example in which a network is overlayed on voronoi cells
image


import matplotlib.pyplot as mplt
import networkx as nx
from vedo import loadStructuredPoints, geometry,\
    show, settings, Points, voronoi, Lines, Plotter
settings.interpolateScalarsBeforeMapping = False
from collections import OrderedDict

G = nx.OrderedGraph()
edges = [(0, 7), (0, 3), (1, 2), (1, 3), (2, 6), (3, 6), (4, 5), (4, 6), (5, 7)]
G.add_edges_from(edges)

pos = OrderedDict()
pos = {0:[64, 10], 1:[81, 78], 2:[17, 88], 3:[23, 33], 4:[40, 18], 5:[100, 63],  6:[12, 55], 7:[59, 50]}
nx.set_node_attributes(G, pos, 'pos')
nx.draw(G, with_labels=True)
mplt.show()
pts = [pos[pt] for pt in sorted(pos)]
lines = [(pos[t], pos[h]) for t, h in G.edges()]
edg = Lines(lines)

pts = Points(pts, c='k', alpha=0.5)
label = [str(node) for node in sorted(G.nodes)]
labs = pts.labels(label, font='VictorMono', c='k').addPos(0.05, 0, 0.5)
plt = Plotter(N=1, size=(100, 100))
strpts = loadStructuredPoints("plot1_000001.vtk")
msh = geometry(strpts).lw(0.1)
msh.print()

cids = msh.pointdata["cell.id"].astype(int)
uids = np.unique(cids)
coords = msh.points()
means = []
for u in uids:
    m = np.mean(coords[cids==u], axis=0)
    means.append(m)
cellpts = Points(means)

vor = voronoi(means, method='vtk').c('k').z(1).lw(0.1).wireframe()
show(pts, edg, labs, msh.lw(0), cellpts, vor, axes=1)

I would like to find the ids/index of voronoi cells through which the edge (1,2) and (1,3) passes.
I am not sure what's the best way to do this. I would like to try the following:

  1. find the coordinates of all points that form the line connecting edge (1,2)
  2. find the coordinates of all points that lie within each voronoi cell ( how to get this information in vedo?)
  3. map coordinates that lie on edge e.g. (1,2) to voronoi cell id through which the edge passes

I would like to know if this looks ok or if is there a better way to do this.

Many thanks

@marcomusy
Copy link
Owner

This is less easy :)

Ideas you can explore:

  • parse the pixels along the line to acquire the information of the voronoi cell id (as your say in point1, and for point2 I would use .closestPoint())
  • check out the intersections of a line to a mesh, and probe only those points locations (you can slightly "shrink" the voronoi mesh with vor.shrink(), also check out basic/lines_intersect.py, if that deosnt work you can extrude() the shrinked voronoi)

Good luck!

Screenshot from 2021-10-17 19-56-05
Screenshot from 2021-10-17 19-58-19

@marcomusy
Copy link
Owner

..oh, an idea could be that you make a Line(p1,p2, res=100) with a resolution , then for each of the 100 points you query the closest point of the voronoi centers with .closestPoint(returnPointId=True) and then retrieve the cell id from that.

@DeepaMahm
Copy link
Author

DeepaMahm commented Oct 18, 2021

Hi,

Thanks so much. Instead of .closestPoint(returnPointId=True) I tried returnCellId=True and the idea suggested by you works great :)

p1 = pos[1]
p2 = pos[2]
edg12 = Line(p1, p2, res=100)
edg12_pts = edg12.points()
for pt in edg12_pts:
    print('closestPoint', vor.closestPoint(pt, returnCellId=True))

Sign up for free to join this conversation on GitHub. Already have an account? Sign in to comment
Labels
None yet
Projects
None yet
Development

No branches or pull requests

2 participants