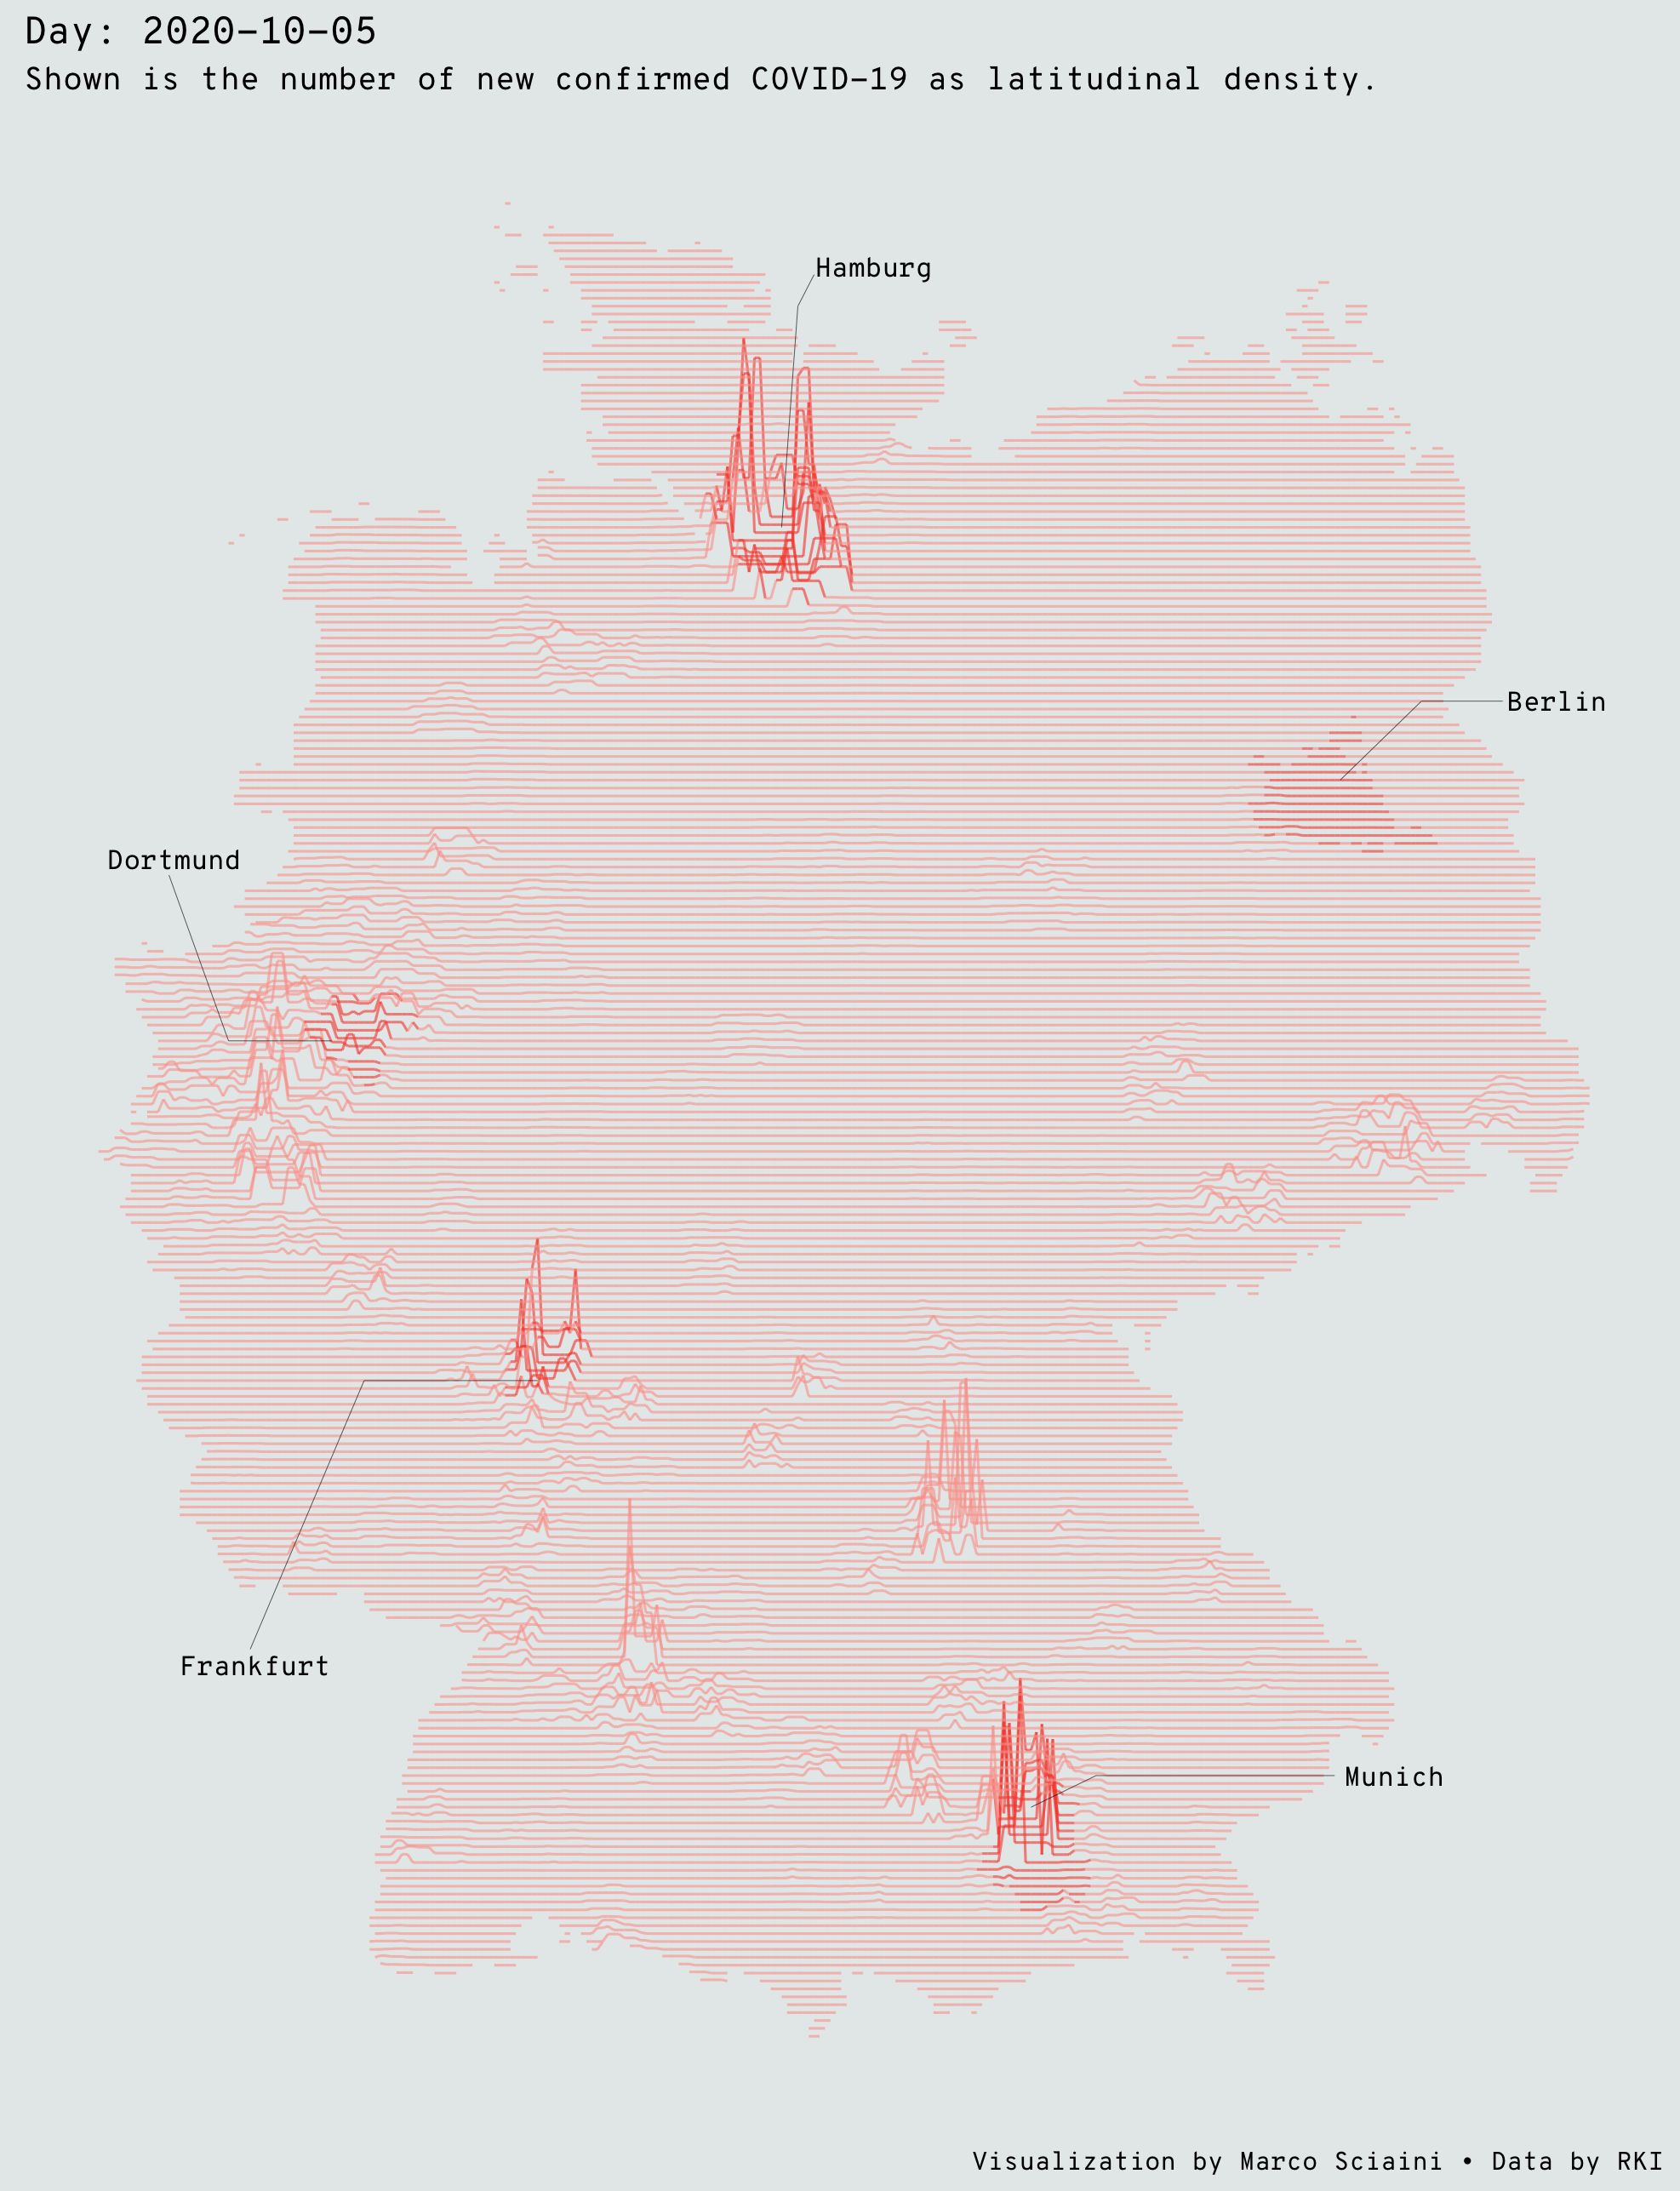
Inspired by James Cheshire's Population Lines Print, I wanted to track the spatial Pattern of the COVID-19 in Germany over time. This map shows the density of confirmed cases COVID-19 cases by latitude.
The data comes from the covid19germany package, which was developed in the context of the #WirvsVirus hackathon. The package loads the data from the Bundesamt für Kartographie und Geodäsie as well as the Robert Koch Institut.
With the code in this project, you can either visualize the COVID-19 density for a single day or animte a certain timespan via gganimate. Since the spatial nature of our data, this animation ... will take some time and computing resources.
