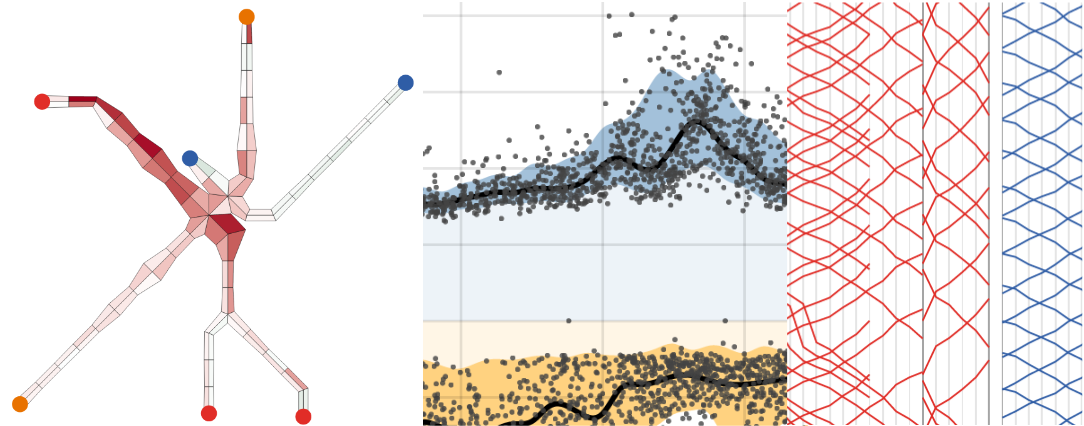
Visualizing MBTA Data is a web based interactive visualization that provides a glimpse into the performance and behavior of Boston's subway system.
Check it out: http://mbtaviz.github.io.
See our blog post describing this source code, and wiki pages with detailed explanations of the data format for each visualization. We have also given several talks on this project. Here are the handouts from each:
- MetroWest Data Visualization Meetup - June 12, 2014 goes into detail on visualization design and implementation details.
- Boston Data Visualization Meetup at MIT Media Lab - August 13, 2014 goes into more depth on design and implementation.
- Boston Data-Con - September 13, 2014 goes into even more depth on design and implementation details.
- NEASIST Data Visualization Workshop - January 15, 2015 serves as a reference sheet to all of the free and open source tools used in the making of this project. Slides from this talk are also available. See our blog post for more details and a video of the talk put together by the WGBH Forum Network.
-
Install node.js
-
Install
bowerto grab dependencies,lessto compile style sheets andhttp-serverto run the websitenpm install -g bower less http-server -
Install dependencies
bower install -
Compile less css files into a single stylesheet
lessc --clean-css styles/main.less > styles/main.css -
Serve up the website
http-server -
Browse to http://localhost:8080/ to see the visualization
data\                post-processed visualization data
scripts\             JavaScript files for the visualization and the website
styles\              less CSS stylesheets and main.css that they are compiled into
media\               Opengraph/Twitter Card images
bower.json           bower dependencies
favicon.ico          map glyph favicon with animation
handout.pdf          design and implementation notes
ie.png               website rendered to an image for browsers without svg support
index.html           landing page
README.md            README file that appears on the website's github page
The visualization loads main.css which is generated from all of the less
files in the styles/ directory. If you change any of the less stylesheets
use the less compile to regenerate main.css as described above:
lessc --clean-css styles/main.less > styles/main.css
For more information see http://lesscss.org.
The raw data is available from two sources. A compressed csv file with per-minute turnstile entry and exit counts from each station is made available with permission from the MBTA:
https://github.com/mbtaviz/mbtaviz.github.io/releases/download/data/turnstile_data.csv.gz
NOTE: some stations don't accurately measure turnstile exits, so entry counts will tend to be more accurate.
Also the realtime subway and alert JSON files collected for the month of February are available here:
https://github.com/mbtaviz/mbtaviz.github.io/releases/download/data/raw_subway_data.tar.gz
They are stored in hourly gzipped files in the following format:
subway-line/yyyy/mm/dd/hh/data.json.gz
where each line of the ungzipped file contains a JSON blob polled from the
MBTA's realtime feed described
here. All times use Eastern
Standard time zone.
Mike Barry
Brian Card
Copyright 2014 Michael Barry and Brian Card.
JavaScript source files and less stylesheets released under the MIT License.
All other files including this README, the main web page, and images made available under Github's terms of service