Principal Component Analysis is an extensively used linear feature extraction technique where a mixture of input features that encompasses all the available information is obtained from the input. PCA does this by preserving the crucial parts in the data that exhibit maximum variance. When we want to reduce the number of dimension or variables, but we aren’t able to identify variables to completely remove we can use PCA to extract the feature but only when the variables are independent of one another. And PCA often make the independent variables less interpretable. In other words, PCA is a statistical technique that enables the identification of internal linear combinations in a data set, so that it can be represented in terms of other substantially lower dimensional data set without much information loss. When performing this method, the final data set would be able to describe much of the variance of the original data set by making a variable reduction. The output of the PCA are called as principal components. The objective is to calculate the principal components to convert it into a data set of only one dimension with the minimal loss of information. The following list shows the steps that need to be performed in principal components analysis:
- Standardisation
- Calculate Covariance matrix
- Calculate eigenvector and eigenvalues
- Creating feature vector
- Extracting principal components
K-nearest neighbour algorithm (KNN) is a type of supervised learning algorithm which is used for both classification and regression problems. But it is predominantly used for predictive classification problems. KNN is a lazy learning algorithm, as it does not have a specialized training phase and uses all the data during classification for training and it is also a non-parametric learning algorithm, since the underlying data is not analysed.
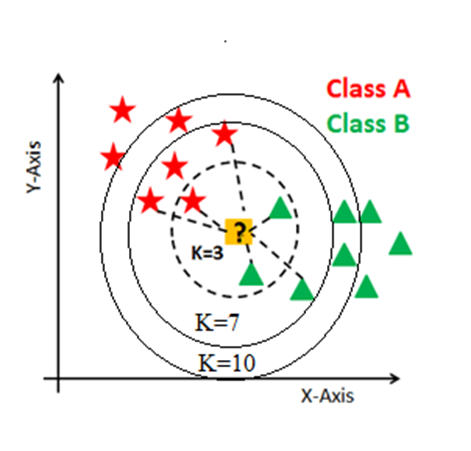
KNN has the following basic steps:
- Decide the number of neighbours
- Calculate distance from the test datapoint
- Find closest neighbours according to the K value
- Classify the test datapoint with the labels
The concept of Support Vector Machine is that a hyperplane is identified which are decision boundaries in the n-dimensional space, and which can differentiate the datapoints into N groups distinctly. There could be multiple possible hyperplanes to distinguish the datapoints.

The followings are important concepts in SVM
- Identifying Support Vectors – The datapoints that are found closer to the hyperplane is called as support vectors. Separating line or the hyperplane will be decided with the help of these support vectors.
- Hyperplane – It is a decision plane or line which is divides the set of objects into different classes in the n-dimensional plot.
- Margin − It is the space between two lines on the closet data points of different classes. It can be calculated as the perpendicular distance from the line to the support vectors. In SVM usually the margin is always large since it is good margin and small margin is considered as bad margin.
The main objective of SVM is to divide the datasets into classes to find a maximum marginal hyperplane (MMH) and it can be done in the following two steps
- Algorithm will create hyperplanes iteratively that separates the classes in best possible way.
- Then, it will choose the hyperplane that separates the classes correctly.
- AVIRIS sensor across the Indian Pines test site in north western Indiana and comprises of 145*145 pixels and 224 spectral reflectance wavelength bands
- 224-band AVIRIS sensor captured dataset over Salinas Valley, California
- University of Pavia, Italy Hyperspectral Dataset