Skip to content
New issue

Have a question about this project? Sign up for a free GitHub account to open an issue and contact its maintainers and the community.

By clicking “Sign up for GitHub”, you agree to our terms of service and privacy statement. We’ll occasionally send you account related emails.

Already on GitHub? Sign in to your account

Why are multiple debugging threads being started in integrated Python-debugging of VS Code? #349

Closed
AndreasLuckert opened this issue Jul 27, 2020 · 13 comments

Comments

@AndreasLuckert
Copy link

Environment data

  • VS Code version: 1.47.2
    17299e413d5590b14ab0340ea477cdd86ff13daf
    x64
  • Extension version (available under the Extensions sidebar): ms-python.python v2020.7.96456
  • OS and version: Operating System: Ubuntu 18.04.4 LTS
    Kernel: Linux 5.4.0-42-generic
    Architecture: x86-64
  • Python version (& distribution if applicable, e.g. Anaconda): Python 3.8.5 (default, Jul 22 2020, 18:54:26)
    [GCC 5.4.0 20160609] on linux (from linuxbrew using pip)
  • Type of virtual environment used (N/A | venv | virtualenv | conda | ...): pip, main/general environment
  • Relevant/affected Python packages and their versions: -
  • Relevant/affected Python-related VS Code extensions and their versions: -
  • Value of the python.languageServer setting: "Jedi"

Expected behaviour

Debugging with a single main thread.

Actual behaviour

Multiple threads occur and slow down the process for executing the same code several times simultaneously.

Steps to reproduce:

[NOTE: Self-contained, minimal reproducing code samples are extremely helpful and will expedite addressing your issue]

  1. Open a python-code (.py-file) in VS Code.
  2. Start debugging via F5.
  3. See how multiple threads are starting debugging the code simultaneously while slowing down the entire computer unnecessarily:
    Python_debugging_VS_Code_multiple_processes_in_parallel

For all the other details, please visit my question on StackOverflow.

I'm asking for help in this issue here as well since on StackOverflow there was no significant activity regarding the solving of this matter. I'd also asked this question on VS Code GitHub which was not answered there but forwarded to other places.

Logs

Output for Python in the Output panel (ViewOutput, change the drop-down the upper-right of the Output panel to Python)

XXX

@brettcannon brettcannon transferred this issue from microsoft/vscode-python Jul 27, 2020
@int19h
Copy link
Collaborator

int19h commented Jul 27, 2020

Debugger does spawn background threads - that's an unavoidable part of the implementation. However, you wouldn't see those threads in the Call Stack window. They are also not running your code, so "executing the same code several times simultaneously" does not apply. Same thing goes for subprocesses.

This behavior doesn't reproduce for me on any simple app, so we'll need some more information to repro. Most likely, this has more to do with the code being debugged, or with the libraries that it uses.

In addition, I'm curious as to what lead you to conclude that those threads execute the same code. Did you try pausing and inspecting the call stacks in other threads to see what code is running there? If not, doing that might shed some light on what's spawning the threads.

@AndreasLuckert
Copy link
Author

AndreasLuckert commented Jul 28, 2020

I deduced that it's executing the code several times simultaneously because of the console output, which indicates me exactly that.
For example:

...

*** File 4: AVAMET_station_c25m181e02_Oliva_poble_1-31-jan-2018.csv

Importing all meteo files:  29%|██▊       | 4/14 [00:04<00:08,  1.20it/s]

*** File 5: AVAMET_station_c25m181e02_Oliva_poble_1-apr-2-aug-2019.csv

Importing all meteo files:  29%|██▊       | 4/14 [00:04<00:08,  1.13it/s]

*** File 5: AVAMET_station_c25m181e02_Oliva_poble_1-apr-2-aug-2019.csv

Importing all meteo files:  29%|██▊       | 4/14 [00:04<00:08,  1.18it/s]

*** File 5: AVAMET_station_c25m181e02_Oliva_poble_1-apr-2-aug-2019.csv

Importing all meteo files:  29%|██▊       | 4/14 [00:04<00:09,  1.06it/s]

*** File 5: AVAMET_station_c25m181e02_Oliva_poble_1-apr-2-aug-2019.csv

...

As can be seen, in this extraction of my console output File 5 is being imported 4 times in a row, which matches exactly with the number of threads being displayed in the call stack window apart from the main thread.

Moreover, the yellow color of the transparent bar showing where the debugger stopped is less transparent and shows are way more intense yellow color since the debugger stopped 4 times at the same code line which causes an overlap of this indicator bar.
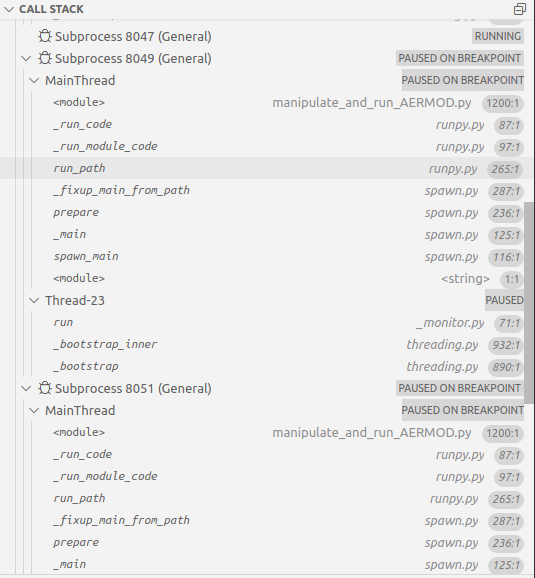
Next, when pressing F10 for Step Over, only one debugging thread reacts while the others remain at the same code line:

Python_debugging_VS_Code_multiple_processes_in_parallel_overlapping_debuggers

As for the call stack, I'm going to provide 3 screenshots of all juxtaposed threads and subprocesses being shown in the following (from top to bottom):

Part 1 (top):
Multiple_debuggers_callstack1
Part 2 (middle):
Multiple_debuggers_callstack2
Part 3 (bottom):
Multiple_debuggers_callstack3

Furthermore, it is true that when selecting a main thread from another sub-process (of the 4 available in the call stack), indeed I can Step Over via F10 with another of the yellow debugging indicator bars.
For showcasing reasons, I did it in a way that all 4 debugging instances are exposed in the following screenshot:
Change_subprocess_indeed_changes_the_debugger_selected

I hope this helps in interpreting where this undesired behavior comes from. They seem to debug the same code and I would like to understand the reason and prevent that from happening.

@fabioz
Copy link
Collaborator

fabioz commented Jul 28, 2020

@AndreasLuckert I believe this issue is on your own code or some library you're using to accelerate your code using multiple processes -- the debugger is just tracking them as it should.

For the threads, it seems they're started in a _monitor.py file (do you have such a file in your project? -- if you click them on the call stack it should show where that file is).

If you share the logs you have from running I may be able to give you more insight.

i.e.:

  • Open VS Code
  • Select the command Extensions: Open Extensions Folder
  • Locate the Python extension directory, typically of the form ms-python.python-2020..***
  • In that directory ensure you do not have any debug*.log files, if you do, please delete them
  • Go back into VS Code and modify your launch.json to add the setting "logToFile": true, see below:
"version": "0.2.0",
"configurations": [
    {
        "name": "Python: Current File (Integrated Terminal)",
        "type": "python",
        "request": "launch",
        "program": "${file}",
        "stopOnEntry": true,
        "console": "integratedTerminal",
        "logToFile": true
    },
  • Start debugging
  • When done, go back into the extension directory and upload the debug*.log files into this GitHub issue.

@AndreasLuckert
Copy link
Author

As far as I know, I don't have a file called _monitor.py in my project, but are my debugging logs from the last session when the multithread-issue happened again:
Multi_thread_python_debugging_LOGfiles.zip

I copied these files from my /home/andylu/.vscode/extensions/ms-python.python-2020.7.96456 - directory, which is hopefully the one you meant after activating the automatic logging via "logToFile": true in my launch.json - file.

Thanks in advance for analyzing these files.

@fabioz
Copy link
Collaborator

fabioz commented Jul 28, 2020

It seems you (or some library you have) is using the multiprocessing module.

i.e. the stack with full paths is:

  Stack: /home/andylu/Desktop/Python/Scripts/Master/Import_export/AERMOD/prepare_filtered_AERMOD_CSV_outputs_for_plotting.py, <module>, 368
  Stack: /home/linuxbrew/.linuxbrew/opt/python@3.8/lib/python3.8/runpy.py, _run_code, 87
  Stack: /home/linuxbrew/.linuxbrew/opt/python@3.8/lib/python3.8/runpy.py, _run_module_code, 97
  Stack: /home/linuxbrew/.linuxbrew/opt/python@3.8/lib/python3.8/runpy.py, run_path, 265
  Stack: /home/linuxbrew/.linuxbrew/opt/python@3.8/lib/python3.8/multiprocessing/spawn.py, _fixup_main_from_path, 287
  Stack: /home/linuxbrew/.linuxbrew/opt/python@3.8/lib/python3.8/multiprocessing/spawn.py, prepare, 236
  Stack: /home/linuxbrew/.linuxbrew/opt/python@3.8/lib/python3.8/multiprocessing/spawn.py, _main, 125
  Stack: /home/linuxbrew/.linuxbrew/opt/python@3.8/lib/python3.8/multiprocessing/spawn.py, spawn_main, 116
  Stack: <string>, <module>, 1

I also see many Exception occurred during evaluation., so, maybe it only gets to that code when you are manually evaluating something in the debugger (so, it's possible that for instance you'd hover over something or add some watch that asks the debugger to evaluate something that uses multiprocessing, which in turn starts those processes).

One trick to evaluate where threads are being created could be adding:

import traceback
traceback.print_stack()

in threading.Thread.start to see where those threads are being started (note that some internal threads from the debugger are expected, but they're not the issue here).

For the multiprocessing, I think you could do something analogous, but I'm not sure the proper place in this case -- maybe process.BaseProcess.start would be the place to look at.

Anyways, this doesn't seem to be an issue in the debugger, so, I'm closing this issue.

@fabioz fabioz closed this as completed Jul 28, 2020
@fabioz
Copy link
Collaborator

fabioz commented Jul 28, 2020

Also, something to double check in your code is if the main entry point is protected by the __name__=='__main__' check:

if __name__ == '__main__':
    main()

and depending on the structure, you could also need the multiprocessing.freeze_support() if you need to have multiprocessing support:

i.e.:

if __name__ == '__main__':
    multiprocessing.freeze_support()
    main()

(if you don't have that structure, it may explain why multiprocessing is executing your main entry point code multiple times).

@AndreasLuckert
Copy link
Author

I have neither the first nor the second option implemented and it could happen with any script I execute I've just realized.
It seems like old debugging sessions are not really terminated behind the scenes, because in one session there is no multi-threading and then, later, a multi-session is launched when debugging.
This has also happened when executing the code normally and it exited with errors, and THEN I went (again) into a debugging session.

Do you recommend me to put

if __name__ == '__main__':
    multiprocessing.freeze_support()
    main()

in the beginning of all my python-scripts which I execute as main-script, i.e. my entry-point or top-level script?

@AndreasLuckert
Copy link
Author

AndreasLuckert commented Aug 10, 2020

I'd be glad to learn if putting the above-mentioned code-lines into my main-scripts enable me to avoid the multi-threading during my debugging sessions.
Thanks in advance!

@int19h
Copy link
Collaborator

int19h commented Aug 10, 2020

It should generally be at the end of your script, and all top-level code that's not already in a function should be inside main(). The reason is that your script is going to be imported as a module in every subprocess that multiprocessing spawns, so any top-level code will run many times without the guard. But only the instance that's directly started as a script will have __name__ == "__main__".

@AndreasLuckert
Copy link
Author

Alright, I didn't know that even the top-level/main-script is going to be imported as a module possible several times during the debugging process involving multiprocessing.

I thought that I only needed to take care that sub-level scripts don't comprise code which are not within a function in order to prevent their multiple or generally undesired execution via e.g. import sublevel_script.py.
That even the main-script which I run in the first place will be imported more than once was new to me (if I understood that point correctly).

Moreover, as for the recommendation to put

if __name__ == '__main__':
    multiprocessing.freeze_support()
    main()

in the end of my main-script (and possibly all the other sub-level scripts as well, which comprise code outside of functions),
I've found the following docs for multiprocessing.freeze_support().

There, it states the following:

Calling freeze_support() has no effect when invoked on any operating system other than Windows. In addition, if the module is being run normally by the Python interpreter on Windows (the program has not been frozen), then freeze_support() has no effect.

This in turn means that I cannot apply this to my case since, as I'd mentioned in my initial question above, my OS is:

Ubuntu 18.04.4 LTS
Kernel: Linux 5.4.0-42-generic
Architecture: x86-64

Now I'm wondering if there is something equivalent for UNIX, i.e. Linux-systems.
I've run into this blog-post where it states among other things:

[...]
On Linux, when you start a child process, it is Forked. It means that the child process inherits the memory state of the parent process. On Windows (and by default on Mac), however, processes are Spawned. It means that a new interpreter starts and the code reruns.

It explains why, if we run the code on Windows, we get twice the line Before defining simple_func. As you may have noticed, this could have been much worse if we wouldn't include the if main at the end of the file [...]

@int19h
Copy link
Collaborator

int19h commented Aug 11, 2020

The important part is calling main() from under the guard - freeze_support() is just a part of the standard verbiage that's written to be as platform-independent as possible.

Linux does indeed fork by default, but it can also use spawn via set_start_method(). Your call stack above - the one with multiprocessing/spawn.py in it - indicates that to be the case.

@AndreasLuckert
Copy link
Author

Okay thanks, so I will implement in the end of my script the bespoke

if __name__ == '__main__':
    multiprocessing.freeze_support()
    main()

since the line multiprocessing.freeze_support() won't do harm on UNIX-systems and works on Windows.

By the way, the expression

from under the guard

stands for if __name__ == '__main__':?

@int19h
Copy link
Collaborator

int19h commented Aug 11, 2020

Yep! For more details, see this section in Python docs.

Sign up for free to join this conversation on GitHub. Already have an account? Sign in to comment
Labels
None yet
Projects
None yet
Development

No branches or pull requests

3 participants