| id | title |
|---|---|
trace-viewer |
Trace viewer |
import LiteYouTube from '@site/src/components/LiteYouTube';
Playwright Trace Viewer is a GUI tool that helps you explore recorded Playwright traces after the script has ran. Traces are a great way for debugging your tests when they fail on CI. You can open traces locally or in your browser on trace.playwright.dev.
- langs: js
In the Actions tab you can see what locator was used for every action and how long each one took to run. Hover over each action of your test and visually see the change in the DOM snapshot. Go back and forward in time and click an action to inspect and debug. Use the Before and After tabs to visually see what happened before and after the action.

Selecting each action reveals:
- action snapshots
- action log
- source code location
When tracing with the [option: screenshots] option turned on, each trace records a screencast and renders it as a film strip. You can hover over the film strip to see a magnified image of for each action and state which helps you easily find the action you want to inspect.
Double click on an action to see the time range for that action. You can use the slider in the timeline to increase the actions selected and these will be shown in the Actions tab and all console logs and network logs will be filtered to only show the logs for the actions selected.

When tracing with the [option: snapshots] option turned on (default), Playwright captures a set of complete DOM snapshots for each action. Depending on the type of the action, it will capture:
| Type | Description |
|---|---|
| Before | A snapshot at the time action is called. |
| Action | A snapshot at the moment of the performed input. This type of snapshot is especially useful when exploring where exactly Playwright clicked. |
| After | A snapshot after the action. |
Here is what the typical Action snapshot looks like:

Notice how it highlights both, the DOM Node as well as the exact click position.
As you hover over each action of your test the line of code for that action is highlighted in the source panel.

The call tab shows you information about the action such as the time it took, what locator was used, if in strict mode and what key was used.

See a full log of your test to better understand what Playwright is doing behind the scenes such as scrolling into view, waiting for element to be visible, enabled and stable and performing actions such as click, fill, press etc.

If your test fails you will see the error messages for each test in the Errors tab. The timeline will also show a red line highlighting where the error occurred. You can also click on the source tab to see on which line of the source code the error is.

See console logs from the browser as well as from your test. Different icons are displayed to show you if the console log came from the browser or from the test file.

The Network tab shows you all the network requests that were made during your test. You can sort by different types of requests, status code, method, request, content type, duration and size. Click on a request to see more information about it such as the request headers, response headers, request body and response body.

Next to the Actions tab you will find the Metadata tab which will show you more information on your test such as the Browser, viewport size, test duration and more.

- langs: js
The "Attachments" tab allows you to explore attachments. If you're doing visual regression testing, you'll be able to compare screenshots by examining the image diff, the actual image and the expected image. When you click on the expected image you can use the slider to slide one image over the other so you can easily see the differences in your screenshots.

- langs: js
To record a trace during development mode set the --trace flag to on when running your tests. You can also use UI Mode for a better developer experience.
npx playwright test --trace onYou can then open the HTML report and click on the trace icon to open the trace.
npx playwright show-report- langs: js
Traces should be run on continuous integration on the first retry of a failed test
by setting the trace: 'on-first-retry' option in the test configuration file. This will produce a trace.zip file for each test that was retried.
import { defineConfig } from '@playwright/test';
export default defineConfig({
  retries: 1,
  use: {
    trace: 'on-first-retry',
  },
});
const browser = await chromium.launch();
const context = await browser.newContext();
// Start tracing before creating / navigating a page.
await context.tracing.start({ screenshots: true, snapshots: true });
const page = await context.newPage();
await page.goto('https://playwright.dev');
// Stop tracing and export it into a zip archive.
await context.tracing.stop({ path: 'trace.zip' });Available options to record a trace:
'on-first-retry'- Record a trace only when retrying a test for the first time.'on-all-retries'- Record traces for all test retries.'off'- Do not record a trace.'on'- Record a trace for each test. (not recommended as it's performance heavy)'retain-on-failure'- Record a trace for each test, but remove it from successful test runs.
You can also use trace: 'retain-on-failure' if you do not enable retries but still want traces for failed tests.
If you are not using Playwright as a Test Runner, use the [property: BrowserContext.tracing] API instead.
- langs: python
Traces can be recorded by running your tests with the --tracing flag.
pytest --tracing onOptions for tracing are:
on: Record trace for each testoff: Do not record trace. (default)retain-on-failure: Record trace for each test, but remove all traces from successful test runs.
This will record the trace and place it into the file named trace.zip in your test-results directory.
If you are not using Pytest, click here to learn how to record traces.
browser = await chromium.launch()
context = await browser.new_context()

# Start tracing before creating / navigating a page.
await context.tracing.start(screenshots=True, snapshots=True, sources=True)

page = await context.new_page()
await page.goto("https://playwright.dev")

# Stop tracing and export it into a zip archive.
await context.tracing.stop(path = "trace.zip")
browser = chromium.launch()
context = browser.new_context()
# Start tracing before creating / navigating a page.
context.tracing.start(screenshots=True, snapshots=True, sources=True)
page = context.new_page()
page.goto("https://playwright.dev")
# Stop tracing and export it into a zip archive.
context.tracing.stop(path = "trace.zip")- langs: java
Traces can be recorded using the [property: BrowserContext.tracing] API as follows:
Browser browser = browserType.launch();
BrowserContext context = browser.newContext();

// Start tracing before creating / navigating a page.
context.tracing().start(new Tracing.StartOptions()
  .setScreenshots(true)
  .setSnapshots(true)
  .setSources(true));

Page page = context.newPage();
page.navigate("https://playwright.dev");

// Stop tracing and export it into a zip archive.
context.tracing().stop(new Tracing.StopOptions()
  .setPath(Paths.get("trace.zip")));
This will record the trace and place it into the file named trace.zip.
- langs: csharp
Traces can be recorded using the [property: BrowserContext.tracing] API as follows:
<Tabs groupId="test-runners" defaultValue="nunit" values={[ {label: 'NUnit', value: 'nunit'}, {label: 'MSTest', value: 'mstest'} ] }>
namespace PlaywrightTests;

[Parallelizable(ParallelScope.Self)]
[TestFixture]
public class Tests : PageTest
{
    [SetUp]
    public async Task Setup()
    {
        await Context.Tracing.StartAsync(new()
        {
            Title = TestContext.CurrentContext.Test.ClassName + "." + TestContext.CurrentContext.Test.Name,
            Screenshots = true,
            Snapshots = true,
            Sources = true
        });
    }

    [TearDown]
    public async Task TearDown()
    {
        // This will produce e.g.:
        // bin/Debug/net8.0/playwright-traces/PlaywrightTests.Tests.Test1.zip
        await Context.Tracing.StopAsync(new()
        {
            Path = Path.Combine(
                TestContext.CurrentContext.WorkDirectory,
                "playwright-traces",
                $"{TestContext.CurrentContext.Test.ClassName}.{TestContext.CurrentContext.Test.Name}.zip"
            )
        });
    }

    [Test]
    public async Task TestYourOnlineShop()
    {
        // ..
    }
}
using System.Text.RegularExpressions;
using Microsoft.Playwright;
using Microsoft.Playwright.MSTest;
namespace PlaywrightTestsMSTest;
[TestClass]
public class UnitTest1 : PageTest
{
[TestInitialize]
public async Task TestInitialize()
{
await Context.Tracing.StartAsync(new()
{
Title = TestContext.TestName,
Screenshots = true,
Snapshots = true,
Sources = true
});
}
[TestCleanup]
public async Task TestCleanup()
{
// This will produce e.g.:
// bin/Debug/net8.0/playwright-traces/PlaywrightTests.UnitTest1.zip
await Context.Tracing.StopAsync(new()
{
Path = Path.Combine(
Environment.CurrentDirectory,
"playwright-traces",
$"{TestContext.FullyQualifiedTestClassName}.zip"
)
});
}
[TestMethod]
public async Task TestYourOnlineShop()
{
// ...
}
}This will record the trace and place it into the bin/Debug/net8.0/playwright-traces/ directory.
You can open the saved trace using the Playwright CLI or in your browser on trace.playwright.dev. Make sure to add the full path to where your trace.zip file is located. This should include the full path to your trace.zip file.
npx playwright show-trace path/to/trace.zipmvn exec:java -e -D exec.mainClass=com.microsoft.playwright.CLI -D exec.args="show-trace trace.zip"playwright show-trace trace.zippwsh bin/Debug/netX/playwright.ps1 show-trace trace.zipUsing trace.playwright.dev
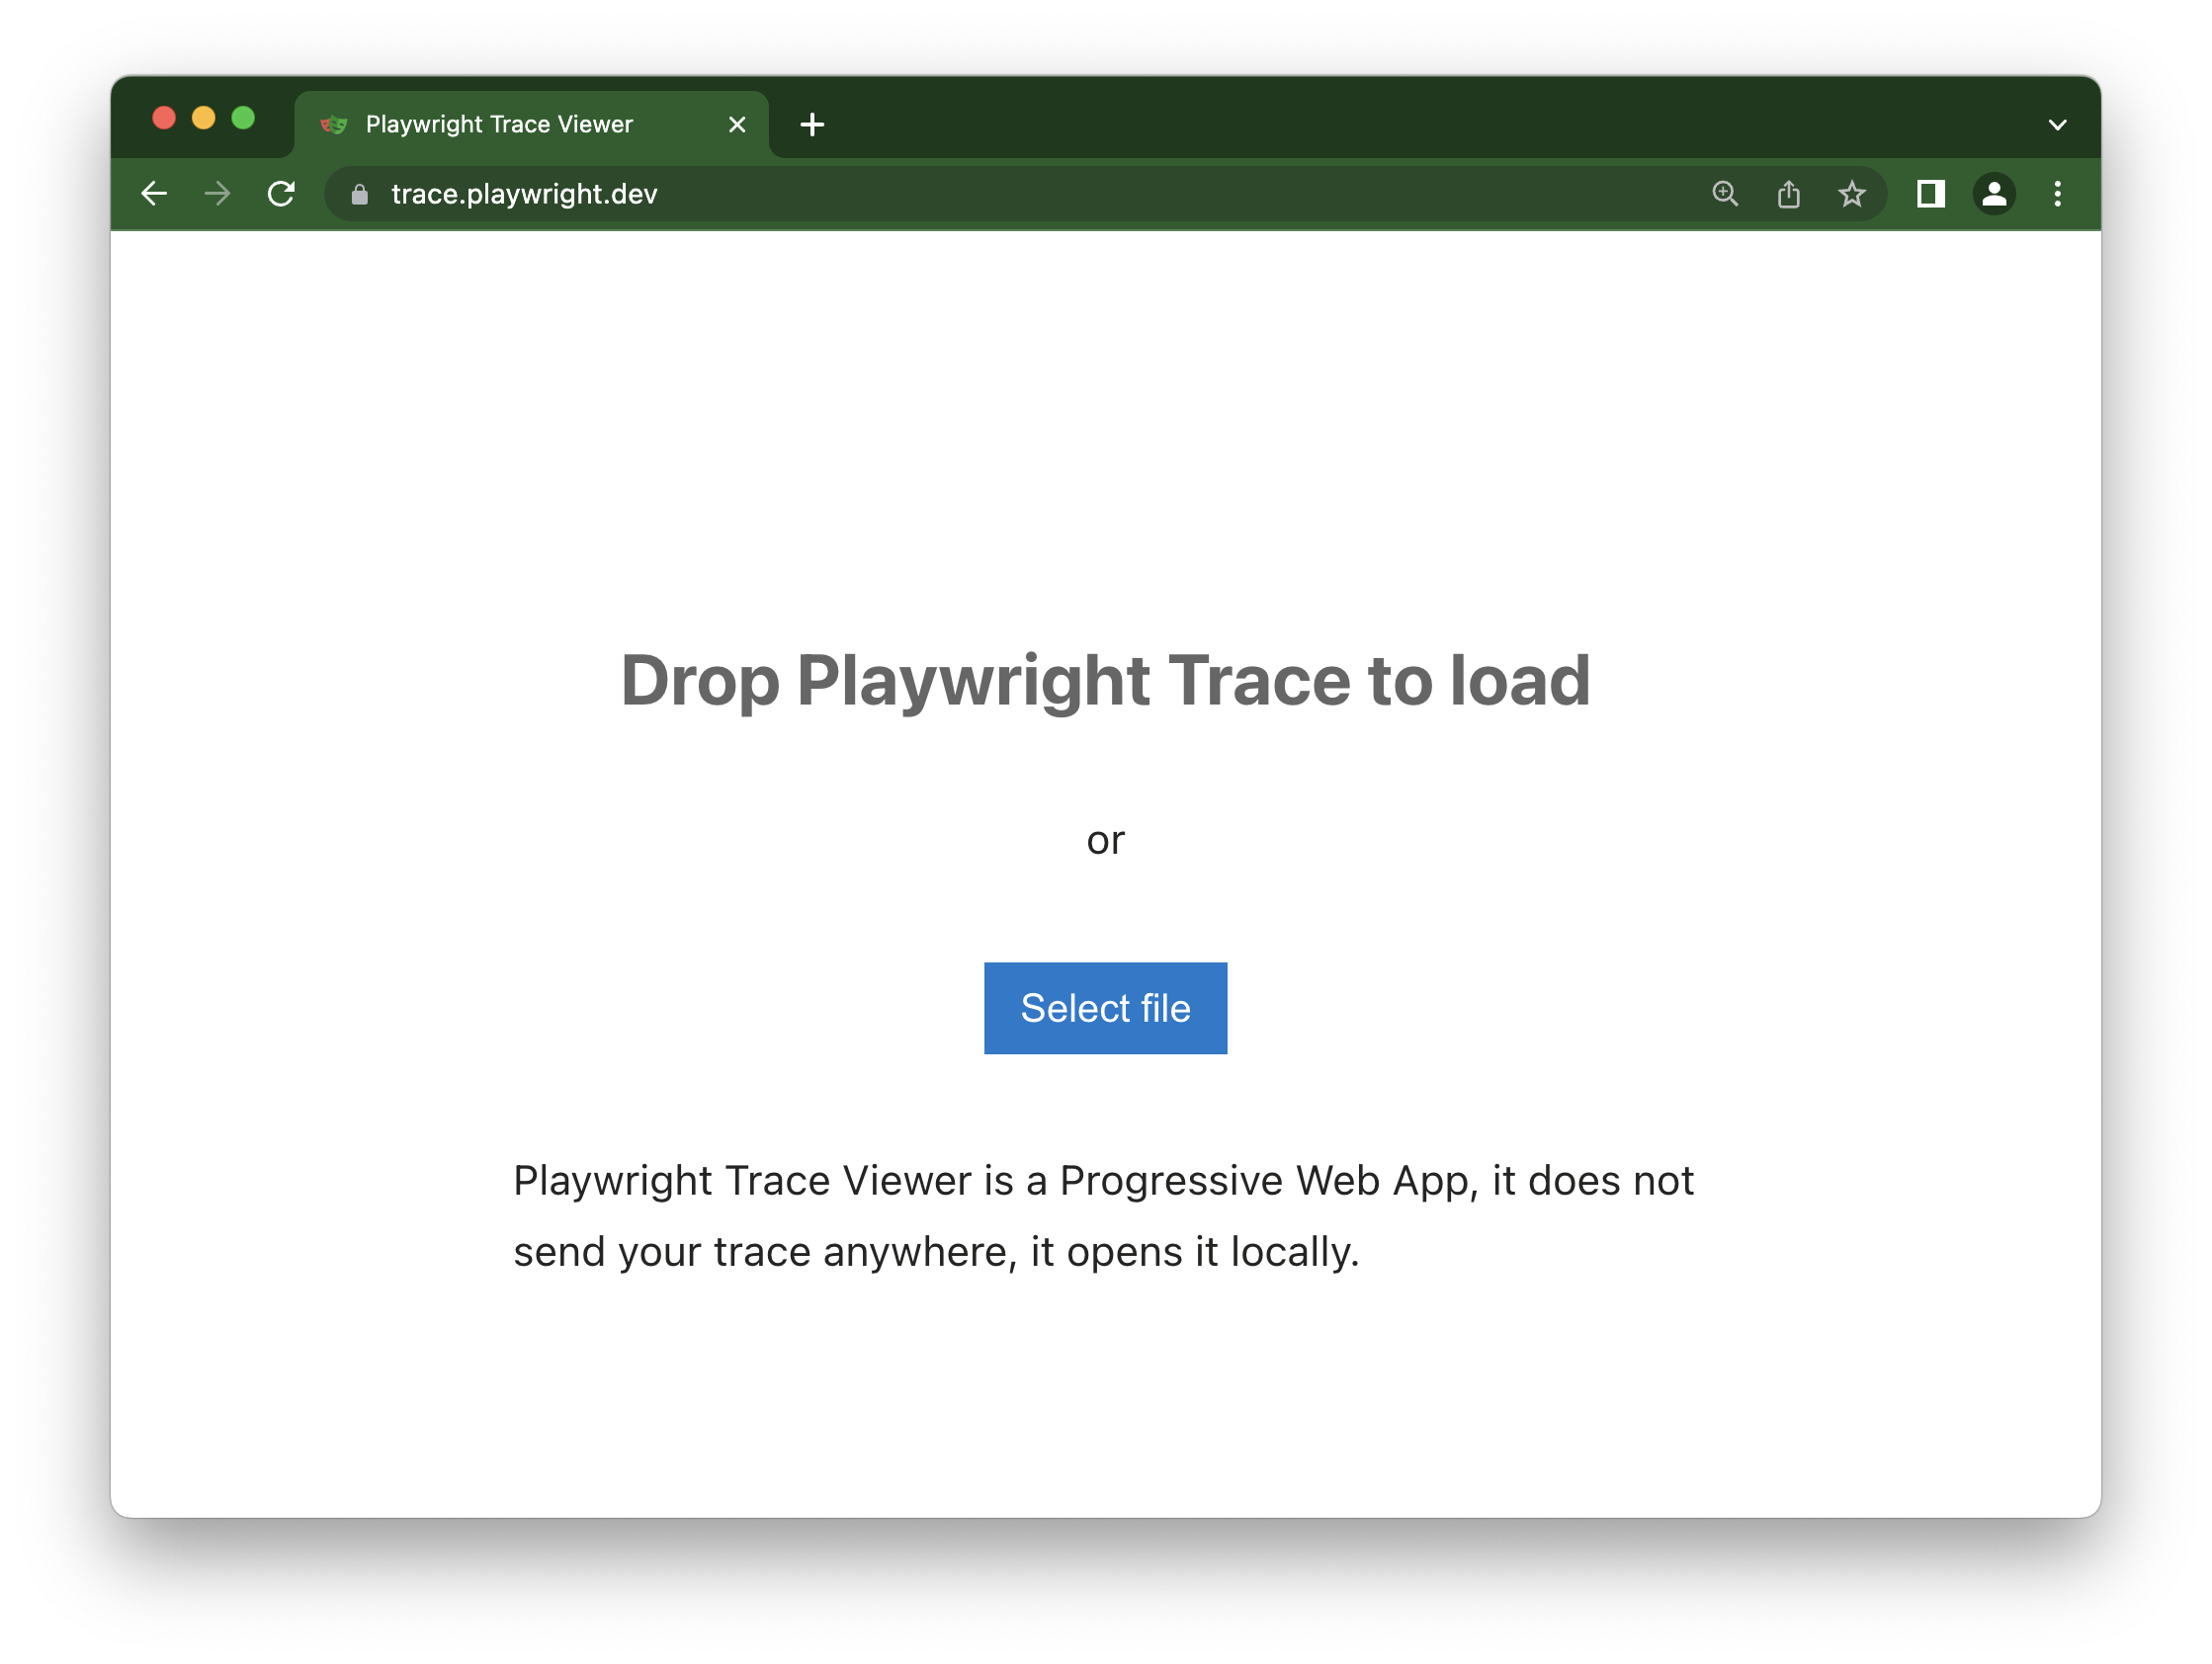
trace.playwright.dev is a statically hosted variant of the Trace Viewer. You can upload trace files using drag and drop.
You can open remote traces using it's URL. They could be generated on a CI run which makes it easy to view the remote trace without having to manually download the file.
npx playwright show-trace https://example.com/trace.zipmvn exec:java -e -D exec.mainClass=com.microsoft.playwright.CLI -D exec.args="show-trace https://example.com/trace.zip"playwright show-trace https://example.com/trace.zippwsh bin/Debug/netX/playwright.ps1 show-trace https://example.com/trace.zipYou can also pass the URL of your uploaded trace (e.g. inside your CI) from some accessible storage as a parameter. CORS (Cross-Origin Resource Sharing) rules might apply.
https://trace.playwright.dev/?trace=https://demo.playwright.dev/reports/todomvc/data/cb0fa77ebd9487a5c899f3ae65a7ffdbac681182.zip