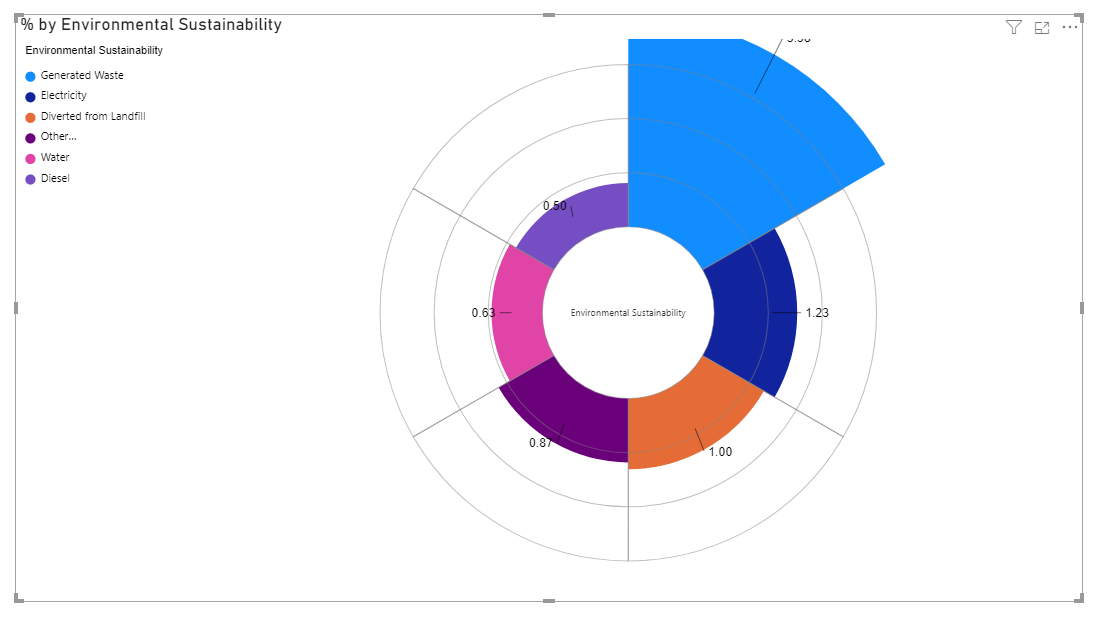
We read every piece of feedback, and take your input very seriously.
To see all available qualifiers, see our documentation.
Have a question about this project? Sign up for a free GitHub account to open an issue and contact its maintainers and the community.
By clicking “Sign up for GitHub”, you agree to our terms of service and privacy statement. We’ll occasionally send you account related emails.
Already on GitHub? Sign in to your account
The outer line is not being dictated by the maximum value in the chart and it also pushes the chart off the page.
The text was updated successfully, but these errors were encountered:
@EwanFrench Could you also provide a report reproducing this issue, please?
Sorry, something went wrong.
I also have the same issue and would like to use this visual.
Is this something that could be fixed?
Asterplot example.zip
Already added it to our backlog
ElenaKamaleeva
No branches or pull requests
The outer line is not being dictated by the maximum value in the chart and it also pushes the chart off the page.
The text was updated successfully, but these errors were encountered: