ERROR: Unable to start debugging. Unexpected GDB output from command "-exec-run". During startup program exited with code 0xc0000139. #10709
Comments
|
I tested it against other relevant questions, and here are the results |
|
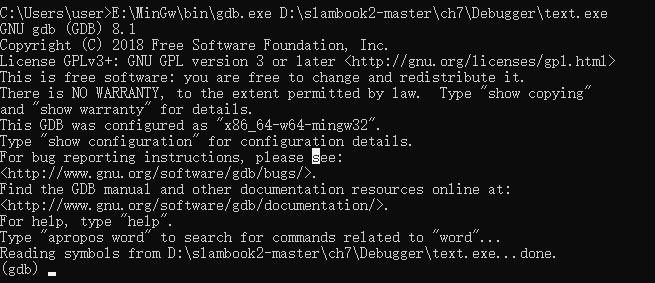
Do you have MinGW in your PATH? In the image you didnt start debugging. If you run |
Thank you for your reply immediately, ran into a problem that when I pressed the F5 key, it didn't seem to generate the task as configured in my task.jaso file, running the result shown in the figure below but, when I press "Run c/c++ File", it works. |


|
you can check your environment variable in msys2 ming64 terminal,using absolute path ,like export PATH=/D/msys64/mingw64/bin:$PATH |
Thank you for your reply. Could you tell me more details? I am a novice and do not know much about similar operations, but I have added the path to my environment variable, as shown in the figure: |

|
I have solved this problem, I installed the "C/C++ Compile Run" plugin and can use the F5 key when uninstalling it. |
|
ahh, i meet the same question, but only happen when i use std::thread. if i dont use std::thread, it works. |

Thank you for you reply, I solved this problem successfully! |
I also successfully solve this problem with your tips. Thanks a lot! |
Environment
Bug Summary and Steps to Reproduce
Bug Summary:
=thread-group-added,id="i1"
GNU gdb (GDB) 8.1
Copyright (C) 2018 Free Software Foundation, Inc.
License GPLv3+: GNU GPL version 3 or later http://gnu.org/licenses/gpl.html
This is free software: you are free to change and redistribute it.
There is NO WARRANTY, to the extent permitted by law. Type "show copying"
and "show warranty" for details.
This GDB was configured as "x86_64-w64-mingw32".
Type "show configuration" for configuration details.
For bug reporting instructions, please see:
http://www.gnu.org/software/gdb/bugs/.
Find the GDB manual and other documentation resources online at:
http://www.gnu.org/software/gdb/documentation/.
For help, type "help".
Type "apropos word" to search for commands related to "word".
Warning: Debuggee TargetArchitecture not detected, assuming x86_64.
=cmd-param-changed,param="pagination",value="off"
Debugger Configurations
task.json:
{
    "version": "2.0.0",
    "tasks": [
        {
            "type": "cppbuild",
            "label": "opencv3.5.2",
            "command": "g++",
            "args": [
                "-fdiagnostics-color=always",
                "-g",
                "${file}",
                "-I",
                "E:\\opencv\\build\\install\\include",
                "-L",
                "E:\\opencv\\build\\install\\x64\\mingw\\bin",
                "-l",
                "libopencv_world453",
                "-o",
                "${workspaceFolder}\\Debugger\\${fileBasenameNoExtension}.exe",
            ],
            "options": {
                "cwd": "${workspaceFolder}"
            },
            "problemMatcher": [
                "$gcc"
            ],
            "group": {
                "kind":"build",
                "isDefault": true
            },
            "detail": "调试器生成的任务。"
        },
    ]
}
launch.json:
{

    "version": "0.2.0",
    "configurations": [
        {
            "name": "opencv debuge",
            "type": "cppdbg",
            "request": "launch",
            "program": "${workspaceFolder}\\Debugger\\${fileBasenameNoExtension}.exe",
            "args": [],
            "stopAtEntry": false, //这里如果为 false,则说明调试直接运行。(反之则停止)
            "cwd": "${workspaceFolder}",
            "environment": [],
            "externalConsole": true,//是否调用外部cmd
            "MIMode": "gdb",
            "miDebuggerPath": "E:\\MinGw\\bin\\gdb.exe",
            "setupCommands": [
                {
                    "description": "Enable pretty-printing for gdb",
                    "text": "-enable-pretty-printing",
                    "ignoreFailures": false
                }
            ],
            "preLaunchTask": "opencv3.5.2"
        }
    ]
}
Debugger Logs
Other Extensions
No response
Additional Information
No response
The text was updated successfully, but these errors were encountered: