Skip to content
New issue

Have a question about this project? Sign up for a free GitHub account to open an issue and contact its maintainers and the community.

By clicking “Sign up for GitHub”, you agree to our terms of service and privacy statement. We’ll occasionally send you account related emails.

Already on GitHub? Sign in to your account

Add a "no SVG animations" mode when discovering and running tests #9216

Closed
rvanlaar opened this issue Dec 19, 2019 · 11 comments
Closed

Add a "no SVG animations" mode when discovering and running tests #9216

rvanlaar opened this issue Dec 19, 2019 · 11 comments
Labels
area-testing feature-request Request for new features or functionality

Comments

@rvanlaar
Copy link

rvanlaar commented Dec 19, 2019

Environment data

  • VS Code version: 1.41.0
  • Extension version (available under the Extensions sidebar): 2019.11.50794
  • OS and version: Ubuntu 19.10
  • Python version (& distribution if applicable, e.g. Anaconda): 3.6.9
  • Type of virtual environment used (N/A | venv | virtualenv | conda | ...): poetry
  • Relevant/affected Python packages and their versions: Django/Django RestFramework
  • Jedi or Language Server? (i.e. what is "python.jediEnabled" set to; more info How to update the language server to the latest stable version #3977): Jedi

Expected behaviour

See minimal slowdown when running unittests via VScode vs the commandline.

Actual behaviour

When running the unittests (pytest and Django) with an intel GPU (UHD Graphics 620) they take around 100 seconds.
With an nvidia GPU around 25 seconds.
On the commandline it's around 22 seconds.

Steps to reproduce:

  1. Have an intel GPU:
  2. Click on the Flask/test explorer
  3. Click on the green arrow, i.e. "Run all tests"
  4. check the Python Test Log output for the time
  5. Repeat steps with an NVIDIA GPU.

Or

  1. Have an intel GPU
  2. Click on the Flask/test explorer
  3. Click on the green arrow, i.e. "Run all tests"
  4. check the Python Test Log output for the time
  5. Repeat but minimize the window after clicking on 'Run all tests'.

and observe that it takes up so much CPU/GPU time that is slows the whole thing down.

It could be due to the spinner in the test explorer, because minimizing VSCode solves the problem.

Logs

Output for Python in the Output panel (ViewOutput, change the drop-down the upper-right of the Output panel to Python)

Console Log with sourcemap enabled for NVIDIA and Intel
https://gist.github.com/rvanlaar/603eae9dd4ccf7bf82f473f537acf1a3

@rvanlaar rvanlaar added triage-needed Needs assignment to the proper sub-team bug Issue identified by VS Code Team member as probable bug labels Dec 19, 2019
@ghost ghost removed the triage-needed Needs assignment to the proper sub-team label Dec 19, 2019
@kimadeline
Copy link

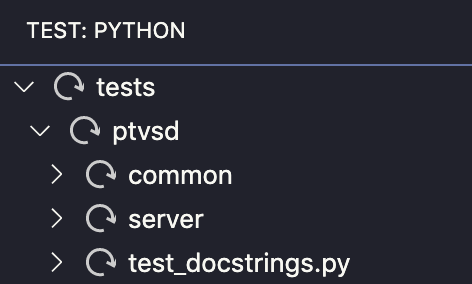
Hi @rvanlaar 👋 Thank you for reaching out.

Can you try collapsing the test explorer when you run the tests and see if it makes a difference?

Also, what is the output for the Python channel in the Output panel (ViewOutput, change the drop-down in the upper-right of the Output panel to Python)? Here you will find the actual command used by the extension to run all tests, so that you can use it when you run tests in the command line.

I can't reproduce your issue, so I could use your help with narrowing down the issue by modifying the extension code locally to decrease the refresh rate, building it on your machine and reporting your findings.

There are several spinners in the test explorer:

  • The spinning arrow next to each test:

image

Their refresh rate is 1ms, which you can modify here:

setTimeout(() => this._onDidStatusChange.fire({ workspace: this.workspaceFolder, status }), 1);

  • The progress spinner in the status bar:

image

Its refresh rate is 1s, which you can modify there:

this.progressTimeout = setInterval(() => this.updateProgressTicker(), 1000);

Thank you!

@kimadeline kimadeline added the info-needed Issue requires more information from poster label Dec 19, 2019
@rvanlaar
Copy link
Author

Could you point me to the documentation required to build and install from github?

@rvanlaar
Copy link
Author

The command is:

~/.cache/pypoetry/virtualenvs/eduworld-sNwkCRg1-py3.6/bin/python -m pytest --rootdir ~/EduWorld/back-end --junitxml=/tmp/tmp-16152BC0HwYwQJy2Y.xml edu_world

When running tests again I see the following happening:
All CPUs get a WA of a couple percent. This means they all have to wait for other tasks to finish.
Which of course slows down those other tasks as well.

Screenshot from 2019-12-20 10-25-55

@rvanlaar
Copy link
Author

rvanlaar commented Dec 20, 2019

Thanks for you help.

I changed both lines to 10000ms (10 seconds):

setTimeout(() => this._onDidStatusChange.fire({ workspace: this.workspaceFolder, status }), 1);

this.progressTimeout = setInterval(() => this.updateProgressTicker(), 1000);

The bottom test spinner was updating every 10 seconds.
The spinning error next to the tests was still spinning as fast as ever.

Both changes didn't change the result.
What made a huge impact on execution time was:

  • hiding the test explorer during tests
  • switching to python output instead of Python Test Log.

How can I disable the spinner, or make it rotate more slowly to check if that's the problem?

Regarding building the project:

Could the readme be updated with build info?

Nevert mind. I found the following: https://github.com/Microsoft/vscode-python/blob/master/CONTRIBUTING.md#setup

What I did was the following:
git clone https://github.com/microsoft/vscode-python.git cd vscode-python npm install npm run package
Run in my python workspace the VScode command:
Extensions: Install from VSIX...
And select the vsix file: ms-python-insiders.vsix

@rvanlaar
Copy link
Author

rvanlaar commented Dec 20, 2019

It's the SVG spinner that's causing the slowdowns.

I replaced the file ./resources/dark/discovering-tests.svg with ./resources/dark/start.svg
That made the test run come down to a good 26 seconds.

The GPU utilization was also in a more normal range, moving between 15 to 50 %

ps. Opening the discovering-tests.svg file in Chrome results in 100% GPU usage with 2 to 18% IO for every CPU.

@rvanlaar
Copy link
Author

For reference: I also created a chromium issue for it:
https://bugs.chromium.org/p/chromium/issues/detail?id=1036262

@kimadeline
Copy link

Hi @rvanlaar, thank you for your investigation! Sorry I didn't get back to you sooner (timezones and all that), seems like you got it figured out after all 👍

The spinning error next to the tests was still spinning as fast as ever.

My initial thought was that the test status refresh rate that was too high, but as you found out it seems like the SVG in itself is causing issues. The animation is built in discovering-tests.svg:

<style type="text/css"><![CDATA[
g {
transform-origin: 8px 8px;
animation: 1s linear infinite rotate;
}
@keyframes rotate {
from { transform: rotate(0); }
to { transform: rotate(1turn); }
}
]]></style>

Opening the discovering-tests.svg file in Chrome results in 100% GPU usage with 2 to 18% IO for every CPU.

I wonder if it happens with any SVG with built-in animation keyframes, or if there is something in discovering-tests.svg in particular 🤔 In any case, thank you for reporting it on chromium's bug tracker!

As for a solution, there's a workaround for now, and we can tweak this issue to be a feature request for a "no animations" mode (remember to 👍 your original comment to help us prioritize this fix).

Thank you again for your help!

@kimadeline kimadeline changed the title Massive slowdown on intel GPU Add a "no SVG animations" mode when discovering and running tests Dec 20, 2019
@kimadeline kimadeline added area-testing needs decision feature-request Request for new features or functionality and removed info-needed Issue requires more information from poster triage bug Issue identified by VS Code Team member as probable bug labels Dec 20, 2019
@kimadeline kimadeline removed their assignment Jan 14, 2020
@rvanlaar
Copy link
Author

A short update.I noticed the following today during a performance test.

The intel gpu doesn't slow down as much as it used to do.
It is now also using a 'blitter'.

The slowdown in VSCode is still there.

screenshot-blitter

@luabud
Copy link
Member

luabud commented Jan 29, 2020

We talked about it with the team and we have unfortunately decided we will not be moving forward with this idea. We think there isn't an enough widespread need for this to warrant the maintenance cost for the feature. FWIW, closing in favour of https://bugs.chromium.org/p/chromium/issues/detail?id=1036262.

@luabud luabud closed this as completed Jan 29, 2020
@ghost ghost removed the needs decision label Jan 29, 2020
@rvanlaar
Copy link
Author

Thank you for your kind and thoughtful response.

Personally I hope that you could look into not using moving SVG spinners by default.
Other plugins also have a 'wait' spinner that doesn't gobble up as much CPU and GPU cycles.

@rvanlaar
Copy link
Author

rvanlaar commented Feb 1, 2020

This issue can be closed.

After looking more into this issue and the performance problems.
This issue was due to having enabled fractional scaling in Xorg on ubuntu.

@lock lock bot locked as resolved and limited conversation to collaborators Feb 9, 2020
Sign up for free to subscribe to this conversation on GitHub. Already have an account? Sign in.
Labels
area-testing feature-request Request for new features or functionality
Projects
None yet
Development

No branches or pull requests

4 participants