Skip to content
New issue

Have a question about this project? Sign up for a free GitHub account to open an issue and contact its maintainers and the community.

By clicking “Sign up for GitHub”, you agree to our terms of service and privacy statement. We’ll occasionally send you account related emails.

Already on GitHub? Sign in to your account

Problem with the VS Code Stop Debugging API #140560

Closed
SuseeJeeva opened this issue Jan 12, 2022 · 6 comments
Closed

Problem with the VS Code Stop Debugging API #140560

SuseeJeeva opened this issue Jan 12, 2022 · 6 comments
Assignees
Labels
bug Issue identified by VS Code Team member as probable bug debug Debug viewlet, configurations, breakpoints, adapter issues insiders-released Patch has been released in VS Code Insiders verified Verification succeeded
Milestone

Comments

@SuseeJeeva
Copy link

SuseeJeeva commented Jan 12, 2022

Hi all,

My objective is to create a VS Code Extension which can ATTACH debugger to a running .NET Console Application

I have a .NET Console Application running parallelly (The Console Application was not attached to the Visual Studio Debugger)

And I have created a VS Code Extension. (Used the default "Hello World" Extension)

In the Extension, I had the below code:

// Attach the debugger --- This is working as per the expectation
vscode.debug.startDebugging(undefined, {
		name: ".NET Core Attach",
		type: "coreclr",
		request: "attach", // Please note that the request is ATTACH
		processId: "18876" // Manually configured the Console Application's process ID
}, undefined);


// This is a dummy timer which waits for 5 secs
setTimeout(() => {
	//This piece of code is stopping the debugger BUT ALSO TERMINATE MY CONSOLE APPLICATION which is not expected
	vscode.debug.stopDebugging();

	//I have tried the below code as well, but no luck
	//vscode.debug.stopDebugging(vscode.debug.activeDebugSession);

}, 5000)

I am not sure why the vscode.debug.stopDebugging() API terminates the Console Application (Since the Debug Configuration request is ATTACH (but not LAUNCH)

Please help me understand what I am doing wrong here.

Thanks in Advance,
Susee

@weinand weinand added the debug Debug viewlet, configurations, breakpoints, adapter issues label Jan 12, 2022
@weinand
Copy link
Contributor

weinand commented Jan 12, 2022

@SuseeJeeva the comment of debug.stopDebugging explains the behavior you are seeing:

Stop the given debug session or stop all debug sessions if session is omitted.

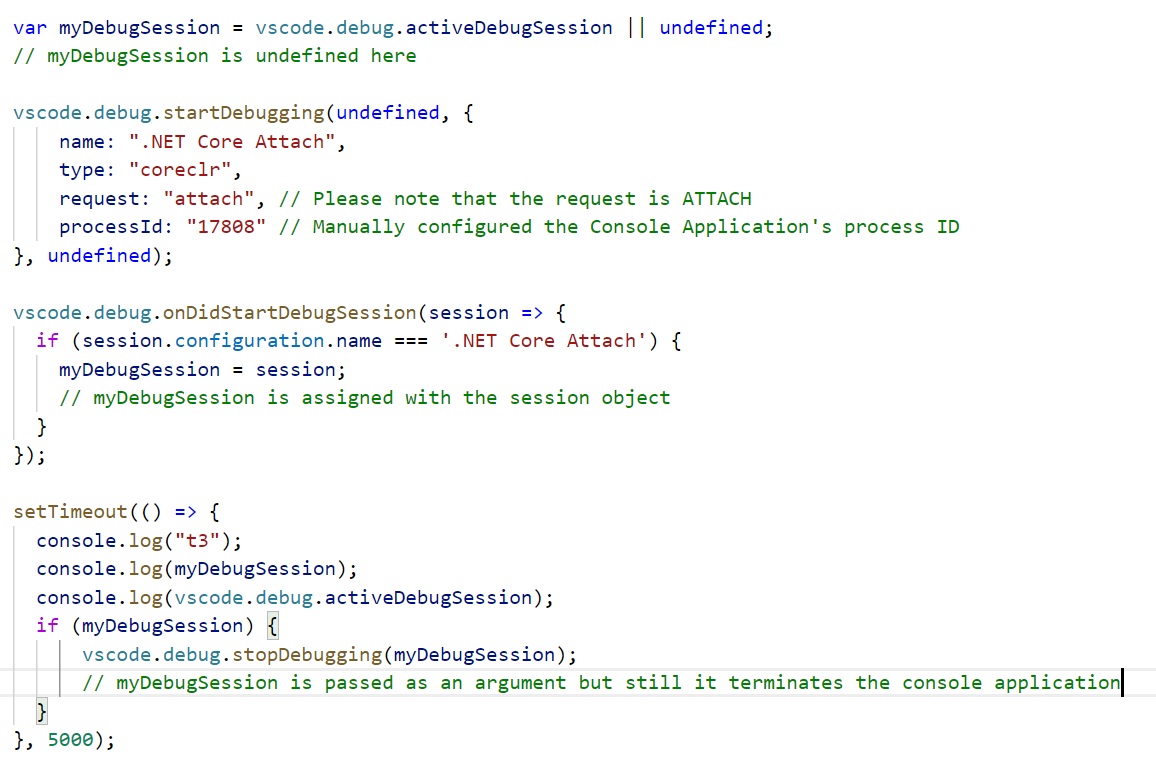
Since you are omitting a debug session argument, all debug sessions are terminated.

If you want to make sure that the correct session gets stopped, I suggest that you register an event handler onDidStartDebugSession and remember the session inside the handler after verifying it.

Blindly relying on debug.activeDebugSession is dangerous because you never know what debug session is active.

Here is some untested sample code:

var myDebugSession: vscode.DebugSession | undefined;

vscode.debug.onDidStartDebugSession(session => {
    if (session.configuration.name === '.NET Core Attach') {
       myDebugSession = session;
    }
});

setTimeout(() => {
   if (myDebugSession) {
      vscode.debug.stopDebugging(myDebugSession);
   }
}, 5000);

@weinand weinand closed this as completed Jan 12, 2022
@SuseeJeeva
Copy link
Author

SuseeJeeva commented Jan 12, 2022

@weinand , thank you for your comments.

I am still facing the same issue even if I follow the steps you suggested.

My requirement is, I wanted to achieve the below operation:

  • Attach the debugger to the existing .NET Console application (This I am able to achieve with the startDebugging API
  • Disconnect the debugger from the existing .NET Console application. (This is not working as expected because the stopDebugging API is Stopping (Terminating) the process. But my requirement is to just Disconnect it (Without impacting the actual process's state.

However, If I click on the "Disconnect" Icon manually in the "Extension Development Host", it is properly getting disconnected.

Attaching the image for your reference.

image

What I believe is, the stopDebugging API is essentially triggering the below operation: (Stop)
image

Here is my updated code and its result:

image

Terminating my console application:

image

Please let me know your thoughts.

Thanks in advance,
Susee

@weinand weinand reopened this Jan 12, 2022
@weinand weinand added the bug Issue identified by VS Code Team member as probable bug label Jan 12, 2022
@weinand
Copy link
Contributor

weinand commented Jan 12, 2022

@SuseeJeeva I've fixed the issue - please try tomorrow's Insiders.

@weinand weinand added this to the January 2022 milestone Jan 12, 2022
@SuseeJeeva
Copy link
Author

@weinand Thank you for the quick support. Sure, I shall try with the Insiders

@SuseeJeeva
Copy link
Author

@weinand , the issue is resolved in the Insiders version.

Thanks,
Susee

@weinand
Copy link
Contributor

weinand commented Jan 17, 2022

@weinand great, thanks for verifying my fix!

@weinand weinand added the verified Verification succeeded label Jan 17, 2022
@github-actions github-actions bot locked and limited conversation to collaborators Feb 26, 2022
Sign up for free to subscribe to this conversation on GitHub. Already have an account? Sign in.
Labels
bug Issue identified by VS Code Team member as probable bug debug Debug viewlet, configurations, breakpoints, adapter issues insiders-released Patch has been released in VS Code Insiders verified Verification succeeded
Projects
None yet
Development

No branches or pull requests

3 participants
@weinand @SuseeJeeva and others