Skip to content
New issue

Have a question about this project? Sign up for a free GitHub account to open an issue and contact its maintainers and the community.

By clicking “Sign up for GitHub”, you agree to our terms of service and privacy statement. We’ll occasionally send you account related emails.

Already on GitHub? Sign in to your account

Support conditional debug configuration providers based on workspace folder #43101

Closed
DanTup opened this issue Feb 7, 2018 · 15 comments
Closed
Assignees
Labels
debug Debug viewlet, configurations, breakpoints, adapter issues feature-request Request for new features or functionality under-discussion Issue is under discussion for relevance, priority, approach
Milestone

Comments

@DanTup
Copy link
Contributor

DanTup commented Feb 7, 2018

I currently support debugging two different types of projects; Dart and Flutter. If a user has a multi-root folder open that contains both a Dart project and a Flutter project I have to register debug providers for both:

context.subscriptions.push(vs.debug.registerDebugConfigurationProvider(DART_CLI_DEBUG_TYPE, new DebugConfigProvider(/*...*/)));
context.subscriptions.push(vs.debug.registerDebugConfigurationProvider(FLUTTER_DEBUG_TYPE, new DebugConfigProvider(/*...*/)));

However when the user hits F5 this means that they now see both of these options in the dropdown regardless of whether they're trying to launch the Dart or Flutter project:

Both debug options show up

In all cases, one of these is the wrong thing to select. Code already knows which project the debug configuration is going to be created for (since it already noticed there's no launch.json for that project which triggered the display of this).

I thought that provideDebugConfigurations would be called in order to populate this list, but that doesn't seem to be the case (brekapoints aren't hit, and returning null doesn't stop them showing up).

@weinand
Copy link
Contributor

weinand commented Feb 7, 2018

"DebugConfigurationProviders" are registered for a debugger type, not a project type (VS Code has no notion of a project type). You are basically asking for "promoting" the debug type to a project type (and for a mechanism to associate a debug type with a project folder).

This is not something we plan to introduce anytime soon ;-)

A "DebugConfigurationProvider" may contribute default launch configuration content for the case that no launch.json exists. In this case VS Code builds the "Select Environment" list from all contributed default launch configuration content. VS Code cannot filter this list based on "project type" because there is no such thing in VS Code. However, if we would open up this mechanism for extension, I could imagine a mechanism that finds all the debug types used in a folder and passes these to VS Code for filtering the "Select Environment" list.

On the other hand there is already a mechanism that could help you:
You can associate a set of "languages" with a specific debug type via the "debuggers.languages" contribution point. This association is used if the user has a file with one of the given languages open in the editor (e.g. a Dart file) and presses F5 (and has not yet a launch configuration). In this case VS Code passes the empty launch config to the DebugConfigurationProvider.resolveDebugConfiguration(...) method which could fill all the missing attributes based on the current open file or additional information of the enclosing folder. VS Code will then use this in-memory launch config to launch a debugger.

With this mechanism we wanted to support the flow that a user wrote a first program and wants to run it by pressing F5. And he should not be bothered with creating a launch.json first. You can try it in node-debug.

@isidorn please chime in for additional insights

@weinand weinand added debug Debug viewlet, configurations, breakpoints, adapter issues under-discussion Issue is under discussion for relevance, priority, approach labels Feb 7, 2018
@weinand weinand added the feature-request Request for new features or functionality label Feb 7, 2018
@weinand weinand added this to the Backlog milestone Feb 7, 2018
@DanTup
Copy link
Contributor Author

DanTup commented Feb 7, 2018

With this mechanism we wanted to support the flow that a user wrote a first program and wants to run it by pressing F5. And he should not be bothered with creating a launch.json first. You can try it in node-debug.

That's actually what I'm trying to get to now :)

We have two different debuggers for Dart and Flutter projects as they work very differently (flutter has an extra level of tooling sat in the middle). Flutter uses Dart as it's language so doesn't have it's own. I guess it's similar to having C# command line apps and C# ASP.NET apps (though I appreciate they've changed a little recently).

I wonder if this is something I can handle with a little shim in the debug adapter, such that we just have one debug type but we have some other property that indicates whether it's dart-cli or flutter and then fire up the correct debugger? Is there a way for us to conditionally provide a debugger in the entry point? Currently looks like this:

// dart_debug_entry.ts
DebugSession.run(DartDebugSession);

// flutter_debug_entry.ts
DebugSession.run(FlutterDebugSession);

It would be a pain if we have to create a whole new debug session type that forwards every request on to the correct one, but I don't know if we have any access to the debug config this early on (I guess not, since we don't get any info until initializeRequest?

@weinand
Copy link
Contributor

weinand commented Feb 7, 2018

Oh yes, that is possible and we are doing the same in node-debug. Here are the details:

  • We have two node debuggers: one for the old "legacy" protocol, one for the current "inspector" protocol. The user should not see these details so he should only deal with a launch configuration of type "node" and we do the switching based on some version probing or explicit launch config attributes.
  • the "legacy" debugger lives in the "node-debug" extension and has a debug type "node", and the "new" debugger lives in the "node-debug2" extension and has a debug type "node2".
  • "node-debug2" is an extension dependency of "node-debug" (but there is no need to keep the two DAs in two extensions. Any number of debug types and associated DAs can live in one extension)
  • the "entry point" is via the "node" debug type (the user should never see "node2").
  • in the "DebugConfigurationProvider.resolveDebugConfiguration(...)" method in "node-debug" we do the version detection and if we see that the new debugger is needed, we just switch the "type" attribute form "node" to "node2": https://github.com/Microsoft/vscode-node-debug/blob/11efc1d05452cc7ae79ae9fe320de0af93ecdc78/src/node/extension/configurationProvider.ts#L115-L123

@DanTup
Copy link
Contributor Author

DanTup commented Feb 7, 2018

@weinand Aha, cool - that sounds great, I'll give it a go.

I also raised microsoft/vscode-node-debug#170 since Node.JS always shows up in the "Select Environment" popup because it seems to activate always on pressing F5 if there's no launch.json. I'd be interested in your thoughts. It adds some confusion (ideally, I'd love that dialog to not even appear so the very first press of F5 just goes straight into debugging without any further user input).

@weinand
Copy link
Contributor

weinand commented Feb 7, 2018

Another approach (which does not involve a second debug type) is to use the newly introduced API for dynamically calculating the executable path of the DA. See the release notes for January:
https://github.com/Microsoft/vscode-docs/blob/vnext/release-notes/v1_20.md#debug-api
(DebugConfigurationProvider.debugAdapterExecutable).

@DanTup
Copy link
Contributor Author

DanTup commented Feb 7, 2018

@weinand That sounds like it might be even simpler, is there a working sample anywhere?

Also; if I do merge my two debug types (dart-cli and flutter) into one (dart), is there a good way to fix up users existing launch.json files? Can I do it via an API or would I have to do it manually?

@weinand
Copy link
Contributor

weinand commented Feb 7, 2018

You can find my example here: #33801 (comment)
It should work in Insiders (and the upcoming Jan stable).
If you use this dynamic approach, you can remove the corresponding static contributions from the package.json, e.g. "debuggers.program" and "debuggers.runtime".

No, there is no specific API to "fix up" existing launch.json. But your extension can upgrade the launch configs on the fly and even offer some UI to update in the launch.json. @isidorn can help you with that.

@DanTup
Copy link
Contributor Author

DanTup commented Feb 7, 2018

I'll have a go and see how I get on. Thanks!

@DanTup
Copy link
Contributor Author

DanTup commented Feb 8, 2018

@weinand

It should work in Insiders (and the upcoming Jan stable).

I can see DebugAdapterExecutable in the 1.20 tag (here), however when I npm install I get this:

Detected VS Code engine version: ^1.20.0
Found minimal version that qualifies engine range: 1.20.0
Fetching vscode.d.ts from: https://raw.githubusercontent.com/Microsoft/vscode/c63189deaa8e620f650cc28792b8f5f3363f2c5b/src/vs/vscode.d.ts
vscode.d.ts successfully installed!

And the version at that url does not include the DebugAdapterExecutable type. Is there something I need to do here?

@weinand
Copy link
Contributor

weinand commented Feb 8, 2018

Release notes say that it is proposed API:

In this milestone, we are proposing "real" API that replaces the untyped command based mechanism with a typed solution. At the same time we are deprecating the adapterExecutableCommand command (and we will remove support for it as soon it is no longer used).

So in this milestone it lives in "vscode.proposed.d.ts": https://github.com/Microsoft/vscode/blob/111f6702017f92f5bb6a6f36f0a878d2a12212b1/src/vs/vscode.proposed.d.ts#L388-L395

If you want to use the functionality in your shipping extension you will have to use the old mechanism in this milestone and upgrade in the next.

@DanTup
Copy link
Contributor Author

DanTup commented Feb 8, 2018

@weinand Ok, thanks for confirming. If I implement the old way, you won't remove it in the same version that you add the new one?

@weinand
Copy link
Contributor

weinand commented Feb 8, 2018

yes, correct. We can only remove it if it was available as official API before for at least one milestone.

The "proposed API" is basically a preview. Please provide feedback if you see that things are missing etc.

@DanTup
Copy link
Contributor Author

DanTup commented Feb 8, 2018

@weinand Perfect! I tried it out, and it all seems to work well - I've eliminated both steps that used to appear when a user hit F5 (environment selection, and then launch.json appearing). Thanks!

I think this original request is no longer required (by me, at least). Between the current implementation and the proposed API, I think I can do everything I need.

@weinand
Copy link
Contributor

weinand commented Feb 8, 2018

Good to hear!

@weinand weinand closed this as completed Feb 8, 2018
@DanTup
Copy link
Contributor Author

DanTup commented Feb 12, 2018

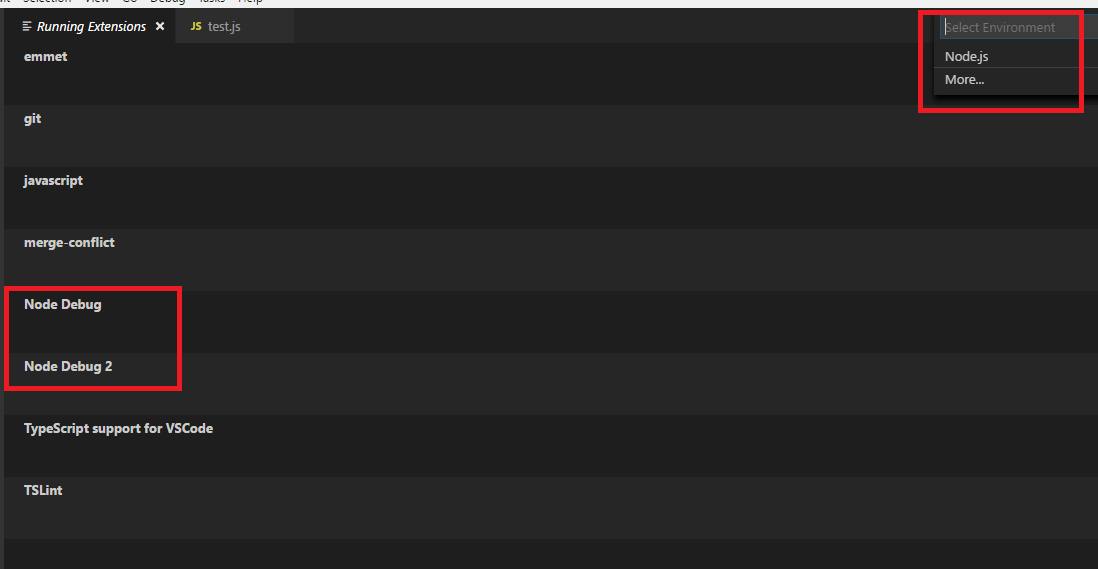
@weinand Another question! How are you stopping node2 from showing up in the "Select Environment" dialog? I can see that both extensions are activated, but I only see one option:

node2

However, mine show up in the list:

screen shot 2018-02-09 at 10 16 20

I have Langauge=Dart on just the new one (Dart & Flutter) and no languages on the other two; but I think this is because I'm hitting F5 with the active file not being the Dart language. Seems like node2 should appear for the same reason but does not (though I can't see any obvious reason why looking at the extension).

@vscodebot vscodebot bot locked and limited conversation to collaborators Mar 25, 2018
Sign up for free to subscribe to this conversation on GitHub. Already have an account? Sign in.
Labels
debug Debug viewlet, configurations, breakpoints, adapter issues feature-request Request for new features or functionality under-discussion Issue is under discussion for relevance, priority, approach
Projects
None yet
Development

No branches or pull requests

3 participants