Skip to content
New issue

Have a question about this project? Sign up for a free GitHub account to open an issue and contact its maintainers and the community.

By clicking “Sign up for GitHub”, you agree to our terms of service and privacy statement. We’ll occasionally send you account related emails.

Already on GitHub? Sign in to your account

Node debug config provider doesn't work? #47779

Closed
roblourens opened this issue Apr 12, 2018 · 12 comments
Closed

Node debug config provider doesn't work? #47779

roblourens opened this issue Apr 12, 2018 · 12 comments
Assignees
Labels
bug Issue identified by VS Code Team member as probable bug debug Debug viewlet, configurations, breakpoints, adapter issues verified Verification succeeded
Milestone

Comments

@roblourens
Copy link
Member

  • Start with --disable-extensions
  • Open the smoketest repo
  • "Select environment" popup appears, and is empty
  • Press esc
  • Opens settings for some reason

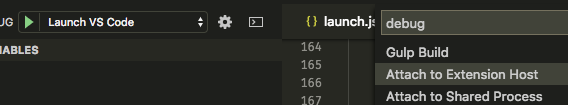
If I start with extensions enabled, I see other extensions but not node.

Also, if I click the "configure or open launch.json" button, it just opens the settings editor. Related issue or different?

@weinand
Copy link
Contributor

weinand commented Apr 12, 2018

@roblourens I cannot reproduce this with Stable or Insiders.

@weinand weinand added debug Debug viewlet, configurations, breakpoints, adapter issues info-needed Issue requires more information from poster labels Apr 12, 2018
@roblourens
Copy link
Member Author

I can repro in both, and on a Linux VM.

If I reload the window then trigger/esc multiple times, I sometimes see Node.js appear after a few iterations. I think it's showing the popup without wiating for the extension to finish activating.

@weinand weinand added this to the April 2018 milestone Apr 13, 2018
@weinand weinand removed the info-needed Issue requires more information from poster label Apr 13, 2018
@isidorn
Copy link
Contributor

isidorn commented Apr 19, 2018

@roblourens I cannot reproduce this on my mac, I nicely get offered Node and launch.json always nicely gets opened. If I understand corerctly you see this both on linux and on mac.

Can you still see it with latest vscode insiders?
If yes, put a bp here and check the candidates array https://github.com/Microsoft/vscode/blob/master/src/vs/workbench/parts/debug/electron-browser/debugConfigurationManager.ts#L516
Are you in some multi root repo? Can you repro if you use a differnt user-data-dir?

@isidorn isidorn added the info-needed Issue requires more information from poster label Apr 19, 2018
@roblourens
Copy link
Member Author

Still happens for me.

Latest insiders with extensions disabled:

  • Pressing F5 with no files open
    • Empty "Select Environment" popup appears.
    • I press esc
    • Settings editor appears
    • If I force the node debug extension to activate (Like by running the Toggle Auto Attach) command, it works
    • Debugging, I see that this.debuggers has the debuggers but hasConfigurationProvider is false so candidates stays empty
  • Pressing F5 with app.js open
    • Debugging, I see it pick node-debug from the language
    • Error popup "Cannot find a program to debug"
    • Settings editor opens

With fresh user-data-dir and extensions disabled:

  • Pressing F5 with no files open
    • Empty "Select Environment" popup appears.
    • I press esc
    • "Select Environment" appears a second time with Node.js
    • Debugging it, the second time node-debug does have hasConfigurationProvider: true
  • Pressing F5 with app.js open
    • Works fine

Seems that there's partly something wrong in my userDataDir but it's not perfect with a fresh one either.

I've had a default launch config in my user settings but I comment it out and reload before reproing this.

@roblourens
Copy link
Member Author

I think that the launch config in user settings is actually persisted as the current one even though it doesn't exist anymore. launch of "user settings" is passed to startDebugging. That's why it keeps opening the settings editor.

But I don't see how the extensions are supposed to be activated for onDebugInitialConfigurations before startDebugging gets to calling guessDebugger.

@isidorn
Copy link
Contributor

isidorn commented Apr 20, 2018

@roblourens extensions get activated for 'onDebugResolve:node' in this case.
Did you check in your case are the extensions active?
Does the problem go away if you add onDebug as an activation event in the node extension?

I believe these are two unrelated problems, the first one is about activation.
The second one is about having the user settings be the selected configuration. For that one can you put a brekapoint here on startup and figure out how it gets selected (since the names array should be empty for a deleted user launch configuration.

@roblourens
Copy link
Member Author

But onDebugResolve happens after the call to guessDebugger in my first scenario. If I force node-debug to activate, it does work, so I think that's the problem. Can we debug over a call?

@isidorn
Copy link
Contributor

isidorn commented Apr 23, 2018

@roblourens Yeah, let's debug over a call. How about tomorrow morning your time / evening my time?
Ping me on slack

@roblourens
Copy link
Member Author

Sure. I agree that there are two issues. The second one is also showing up in another way, I keep seeing the debug config dropdown showing configs from different vscode windows. @octref saw the same thing. But I can't repro it consistently and it goes away after a reload.

@roblourens
Copy link
Member Author

Another way I'm seeing it:

  • Run the "Launch VS Code"
  • Using the debug quickopen menu (debug ...), run the "Attach to Extension Host" config
  • The debug dropdown still shows "Launch VS Code", and if I press F5 later, it's actually running "Attach to Extension Host"
  • And if I open the quickopen again later, it shows the correct config selected initially.

image

Sorry if I'm mixing more unrelated issues in here but it seems relevant and these steps are simpler.

@isidorn
Copy link
Contributor

isidorn commented Apr 25, 2018

@roblourens your latest comment with steps is fixed in latest vscode insiders. I am investigating into the original issue...

@isidorn
Copy link
Contributor

isidorn commented Apr 25, 2018

The issue was with the activation events. In that paritcular code paths the node debug would not get activated due to my broken activation strategy.
If you still see some unrelated issues please file a new issue, thanks :)

To verify, check that the node debug gets activated (you get it in the quick open) in the following situations each right after a reload:

  1. Open debug config (no launch.json present)
  2. Start debugging (no launch.json present)
  3. Also with launch.json there

@isidorn isidorn added bug Issue identified by VS Code Team member as probable bug and removed info-needed Issue requires more information from poster labels Apr 25, 2018
@roblourens roblourens added the verified Verification succeeded label Apr 27, 2018
@vscodebot vscodebot bot locked and limited conversation to collaborators Jun 9, 2018
Sign up for free to subscribe to this conversation on GitHub. Already have an account? Sign in.
Labels
bug Issue identified by VS Code Team member as probable bug debug Debug viewlet, configurations, breakpoints, adapter issues verified Verification succeeded
Projects
None yet
Development

No branches or pull requests

3 participants