Rust: cargo build produces huge load on file watcher (Linux) #82427
Comments
|
@gophobic any chance you maybe have a cyclic symbolic link? |
|
I got the same problem with even worse performance... |
|
@gophobic @musikid any chance the folder you open is something that is shareable (open source) so that I could try to reproduce? |
|
I can reproduce it with all Rust repos but you can try with ripgrep-all |
|
@musikid link? |
|
@musikid does it reproduce if you open that folder as part of a multi-root setup? We use a different file watcher in that case, just File > Save Workspace As and add another folder. |
|
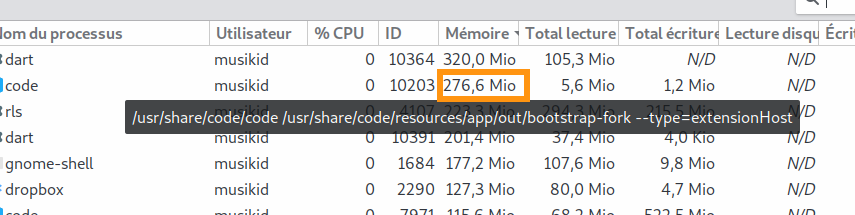
It consumes much less RAM so I think it's not reproducing this bug. |
|
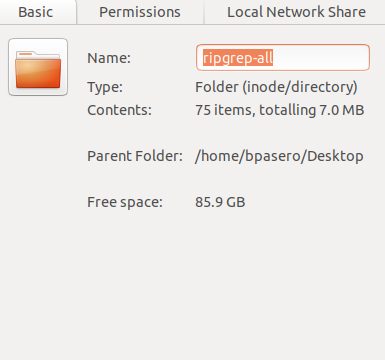
@musikid I cannot reproduce with that folder. It also does not contain a lot of files it seems, can you share how many files you see in that repository?
If you have a single large folder with lots of files, try setting the |
|
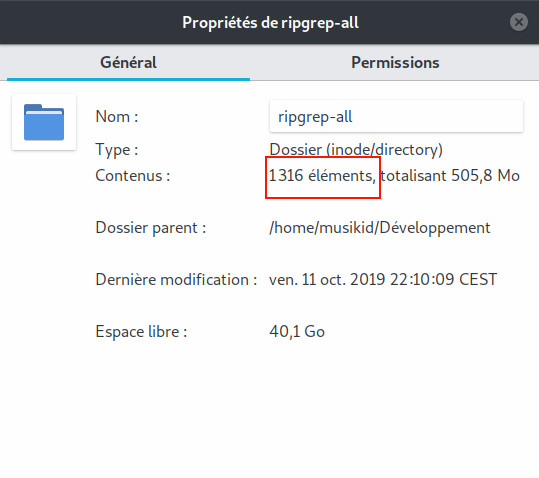
It's weird, I got much more files in my folder. |
|
@musikid did you maybe run some kind of installation tool in that repo that added lots of files into? If so, can you share it or find another sample? |
|
Nothing special, I just removed the target folder because RLS was building indefinitely. |
|
@musikid without a reproducible case (= a folder I can checkout locally), there is not much I can do, sorry. |
|
I uploaded my repo so you can take a look at this: https://send.firefox.com/download/b3e7d4f9973b2402/#vnfmN78g-TJlydhApd7i-g |
|
Thank you but I would prefer a GitHub OSS repository and not download something from elsewhere. |
|
I created a |
|
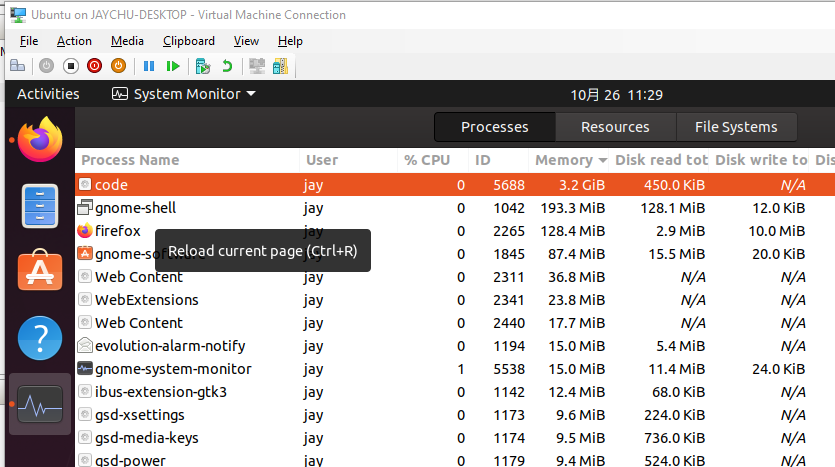
@musikid great thanks, however I do not see a spike on my Ubuntu VM:
Can you share your htop? |
|
Sure. |

|
I am also seeing this behavior, and I am also experiencing crashes (SIGABRT) of the affected process. It stops happening when I switch the project to multiple root directories as well. |
|
@musikid @elomatreb can we try an experiment to ensure no extension or setting is involved.
What is the result? |
|
Following the above steps, the process does not start to grow in memory by itself. When I start a I can provide one of these coredump files if there's nothing sensitive in them, but apparently they were too large and they are "truncated", so I don't know if they're still useful |
|
@elomatreb I assume |
|
Cargo puts lots of build artifacts into |
|
@musikid can you confirm you are doing the same? @elomatreb would you think it makes sense to ignore this folder by default? I am wondering if people would ever configure this or always assume "target" as folder. |
|
Ignoring the folder in Rust projects would probably make sense in 99.9% of cases, but since it's such a generic name I'm not sure. |
|
Yeah I am worried that it would cause issues for people using this folder for a different purpose. |
|
I reported this as paulmillr/chokidar#922 and we have to wait for an official fix. Until then, excluding this directory is the correct workaround. |
|
Hi, there. I think I just get caught by the same issue but this time it's under a
You can pull my repo on GitHub and give it a test. The repo contains only some # on latest Ubuntu
git clone https://github.com/escape0707/cplusplus-primer-exercises.git
cd cplusplus-primer-exercises
git checkout vscode-debug
code .
g++ -std=c++17 StrBlobPtr.h -o a.outThe Note that compiling some other files like And when I try to reproduce this on latest Manjaro distro which comes with a VSCode version 1.28.1, the problem will not show. I wish the info provided above could help to locate the issue clearer. |
|
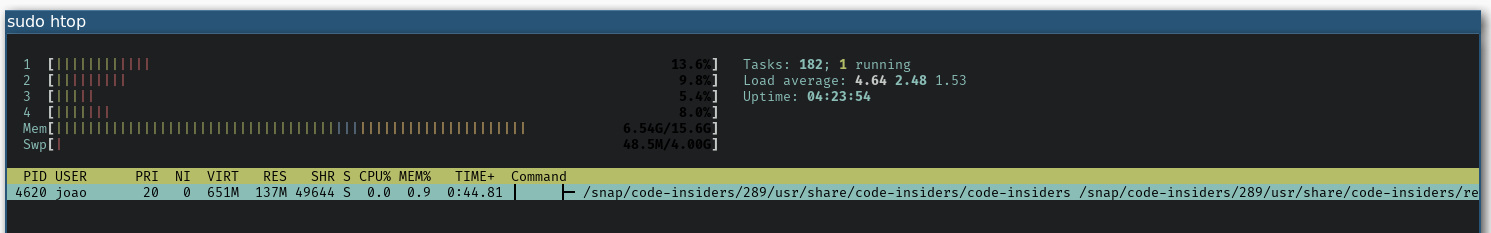
Verified by following the steps from paulmillr/chokidar#922 The file watcher stayed well under 700MB, despite consuming high CPU during the whole build.
|
|
Thanks! |
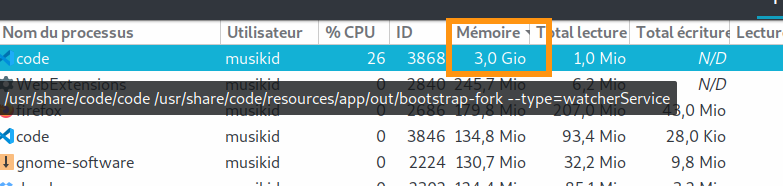
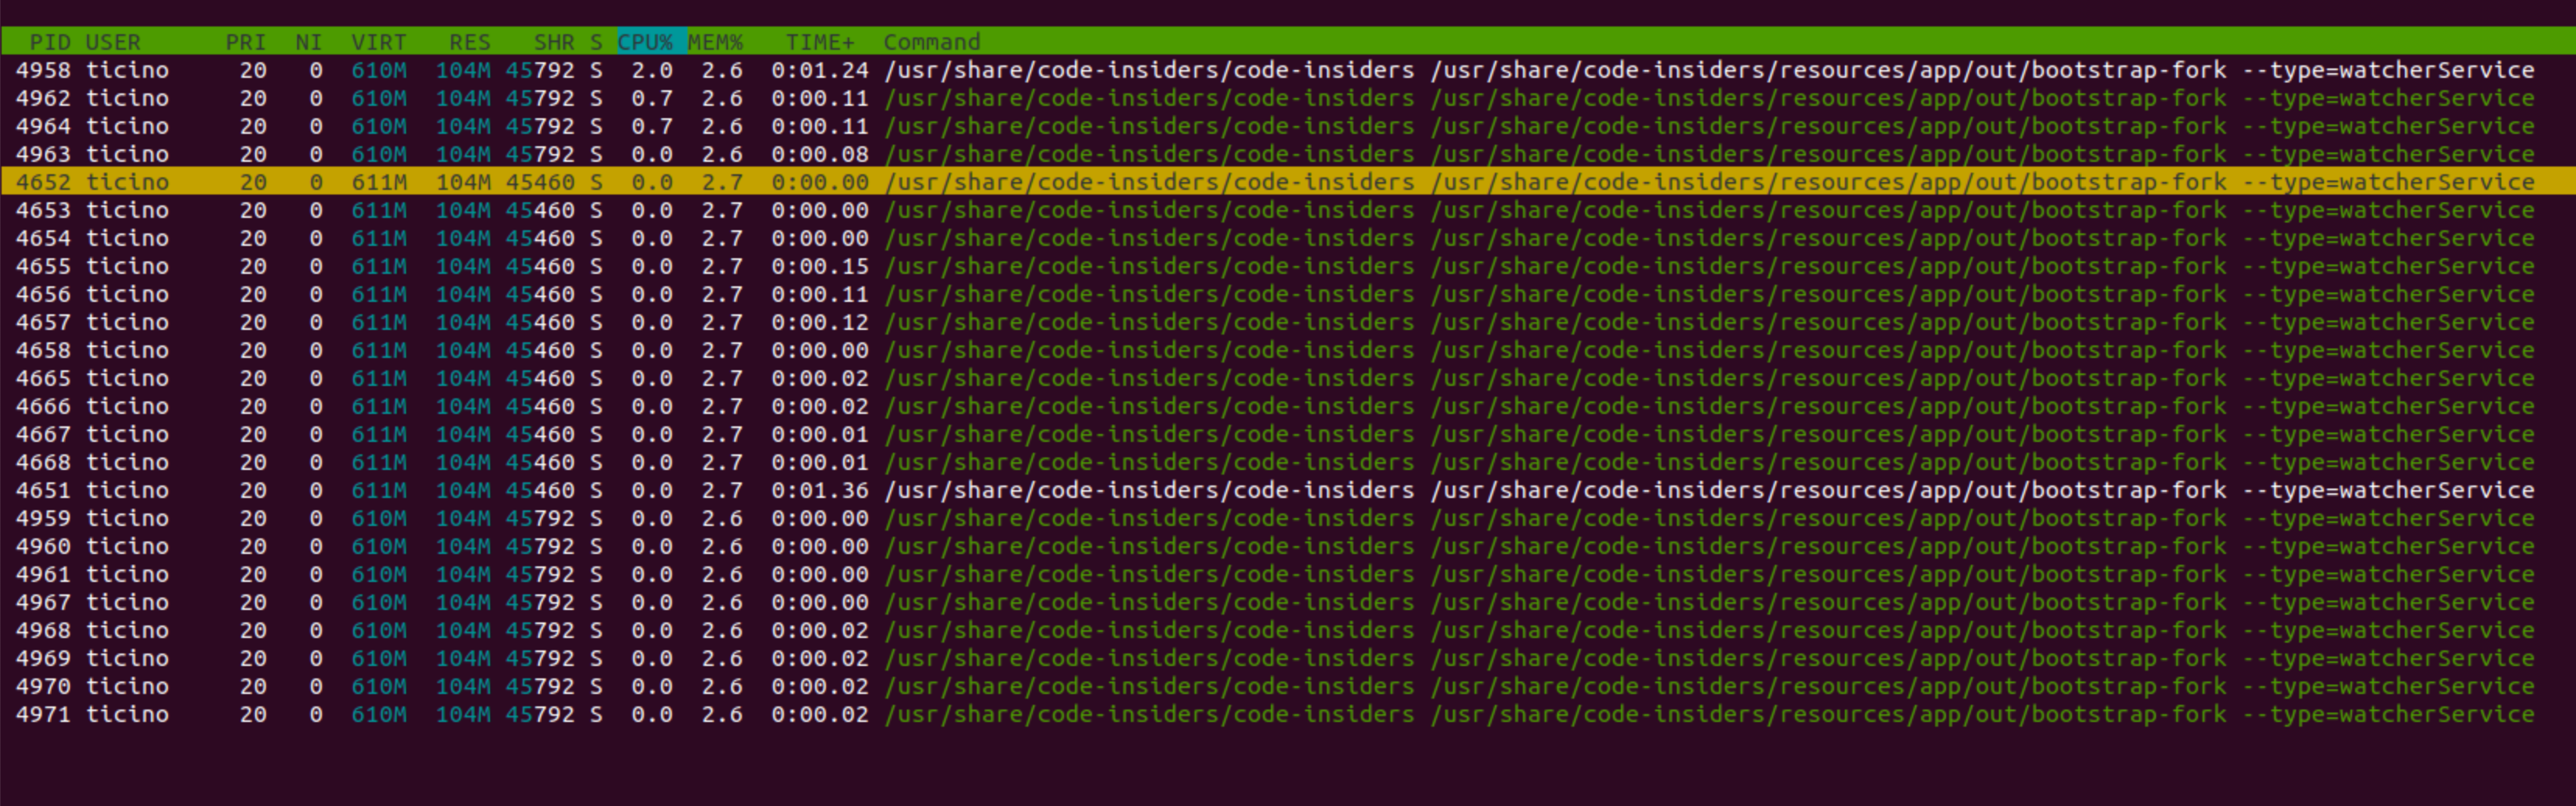
RLS on Linux is already very buggy and causes memory leak, but it stabilizes after eating around 1GB, but today after I updated VSCode to 1.39.1, now VSCode itself, namely
code /BIN_HOME/visual-studio-code/resources/app/out/bootstrap-fork --type=watcherServicecomponent eats more RAM on each file save until the system totally freezes. I am not sure whether something changed in this component in 1.39 release. Downgrading solves the problem, also note thatrls-vscodeextension hasn't been updated for a while so it's not the extension's problem.The text was updated successfully, but these errors were encountered: