Debug toolbar buttons disabled #58327
Comments
|
|
|
Seeing this when attempting to debug a Java program using 1.27.2 on Windows 10. Essentially, debugging Java doesn't work at all. Reverting to VSCode 1.26 works around the issue for me as well for the time being. |
|
@isidorn Any updates about this bug? |
|
@testforstephen I was on vacation, sorry for the slow response. |
|
Not sure if @testforstephen can repro with latest vscode insiders, but I just updated my vscode insiders install, and it does indeed still repro. |
|
@isidorn yes, this issue can be easily reproduced in 2018-09-17 windows insider version. |
|
Any idea why this problem only affects Java debugging? We have no other reports of this. |
|
@weinand In Java Debugger, we took asynchronous programming. One thread to handle the DA request, another thread to report event from JVM in real time. That means when the user is stepping, the possible DA sequence is |
|
Ok, I see. Could you try whether it makes a difference if you implement the step and continue requests like this: And you will have to make sure that all DAP communication is not affected by thread scheduling. So with the above implementation of continueRequest it should not be possible that the StoppedEvent is sent from your DA before the continueResponse. I assume that nothing has changed on your side, right? |
|
The same logic works previously in a long time, we didn't change that part code recently. But i'll do some experiment on your suggestion. |
|
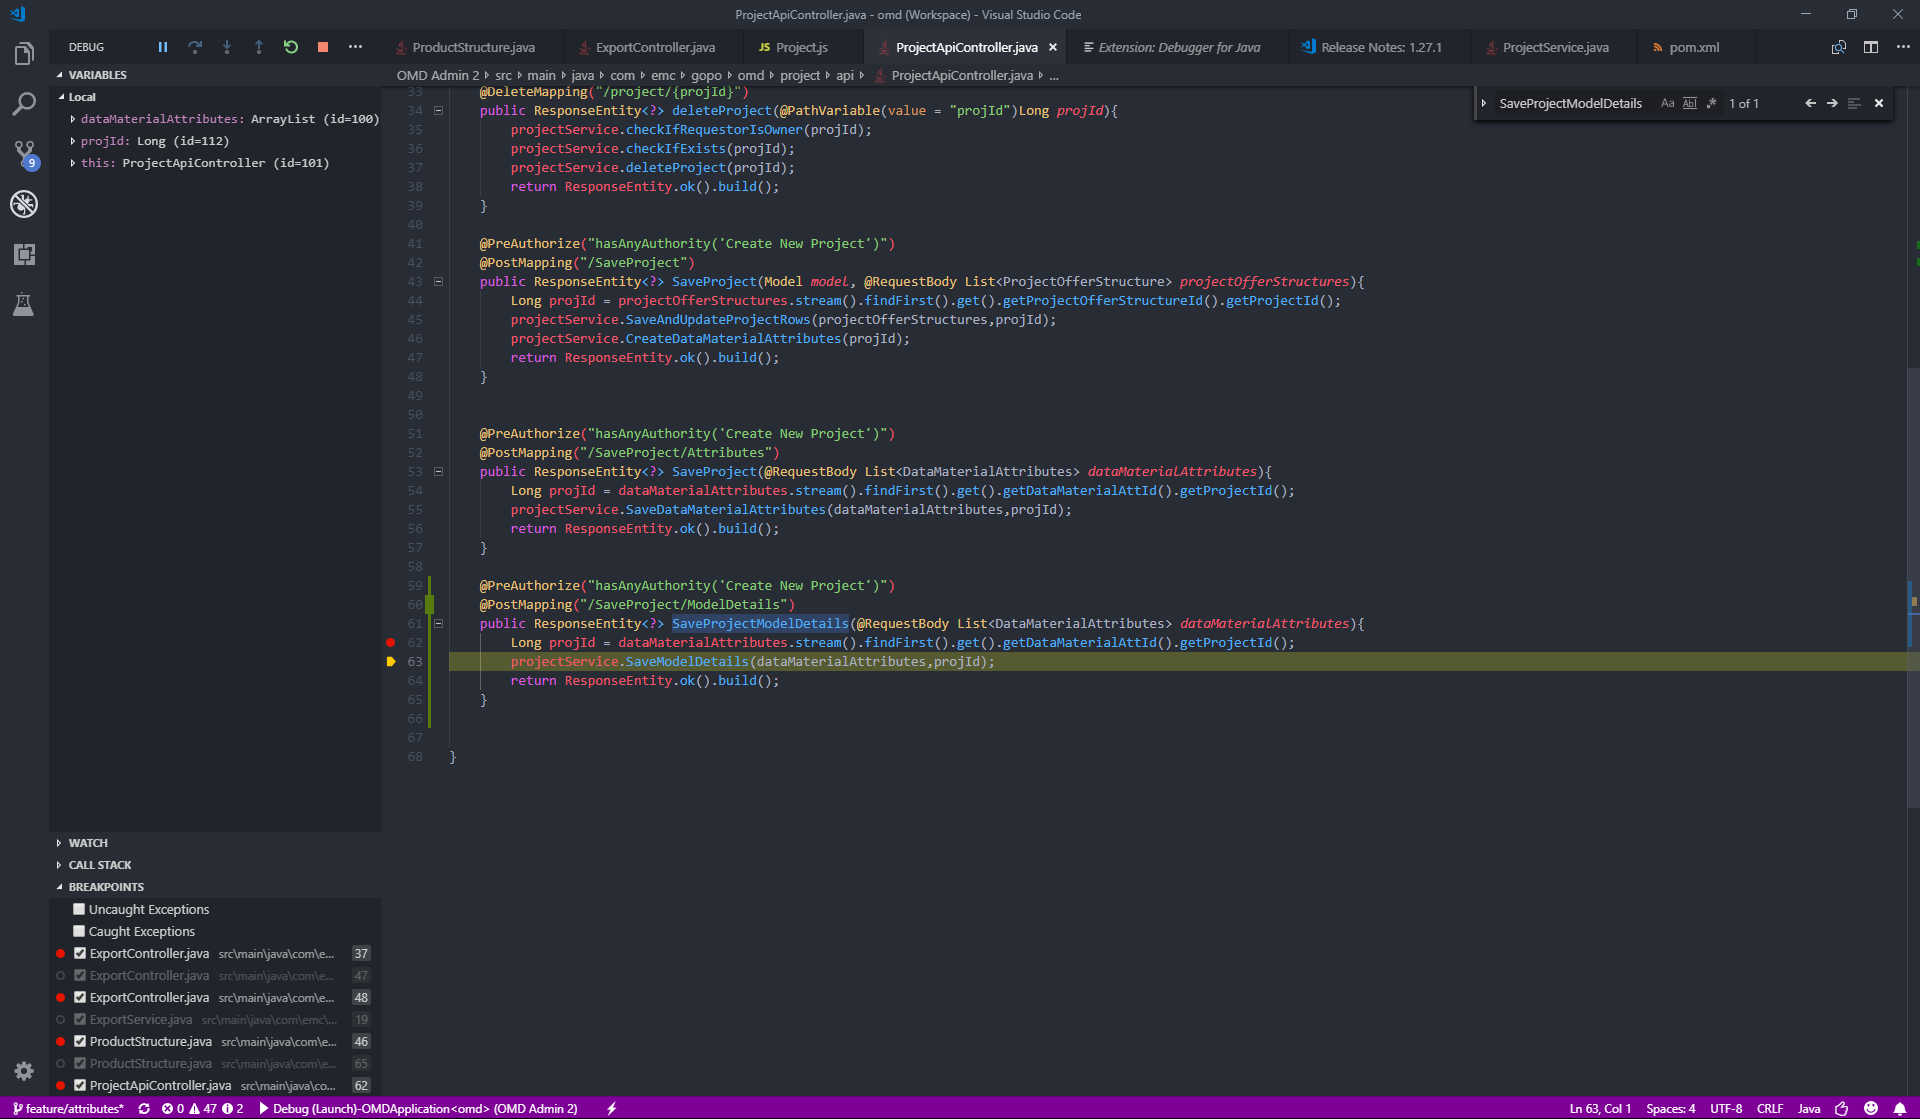
through the screenshot we pasted above, apprently vscode knows the thread is paused on step, because the CALL STACK view/variable/code pointer are rendered correctly, except that the debug buttons don't respect the same status. Besides, i did a quick test via keeping the stoppedEvent sent after StepResponse, it can mitigate the status issue for single thread. But the debug buttons still have the inconsistent status issue for multiple threads case. |
|
I can also repeat this problem:
I use:
|
|
I (and multiple colleagues) can also reproduce this issue. Same description: Debugger stops on breakpoints, I step over once and then the thread is paused on step but debug controls are deactivated. Let me know if I can try anything or send any info to help nail down the issue.
|
|
we submit a fix on java-debug side to fix the StoppedEvent sequence issue, now the debug buttons work well for the single thread scenario. But if it's multiple thread scenario, switching to other thread, VS Code probably lose the old thread's debug status. See the gif. |
|
@testforstephen I just saw the comment in another issue about the debugger fix. I've updated to version 0.13 of the Debugger for Java and it works again for me now. Thanks! |
|
@isidorn since this problem already occurred in 1.27 it is not related to my changes for 1.28 |
|
It works again. Thank you. |
|
Verified the multiple threads case, it works in the 2018-09-20 windows insider. |
|
@testforstephen thanks a lot for verifiing, adding verified label |
VSCode: Version 1.27.1 (1.27.1) 5944e81
Platform: macOS/ubuntu
When the user is stepping over his program, the CALL STACK view shows the program is PAUSED ON STEP, but the debug toolbar buttons are disabled. See the following screenshot.
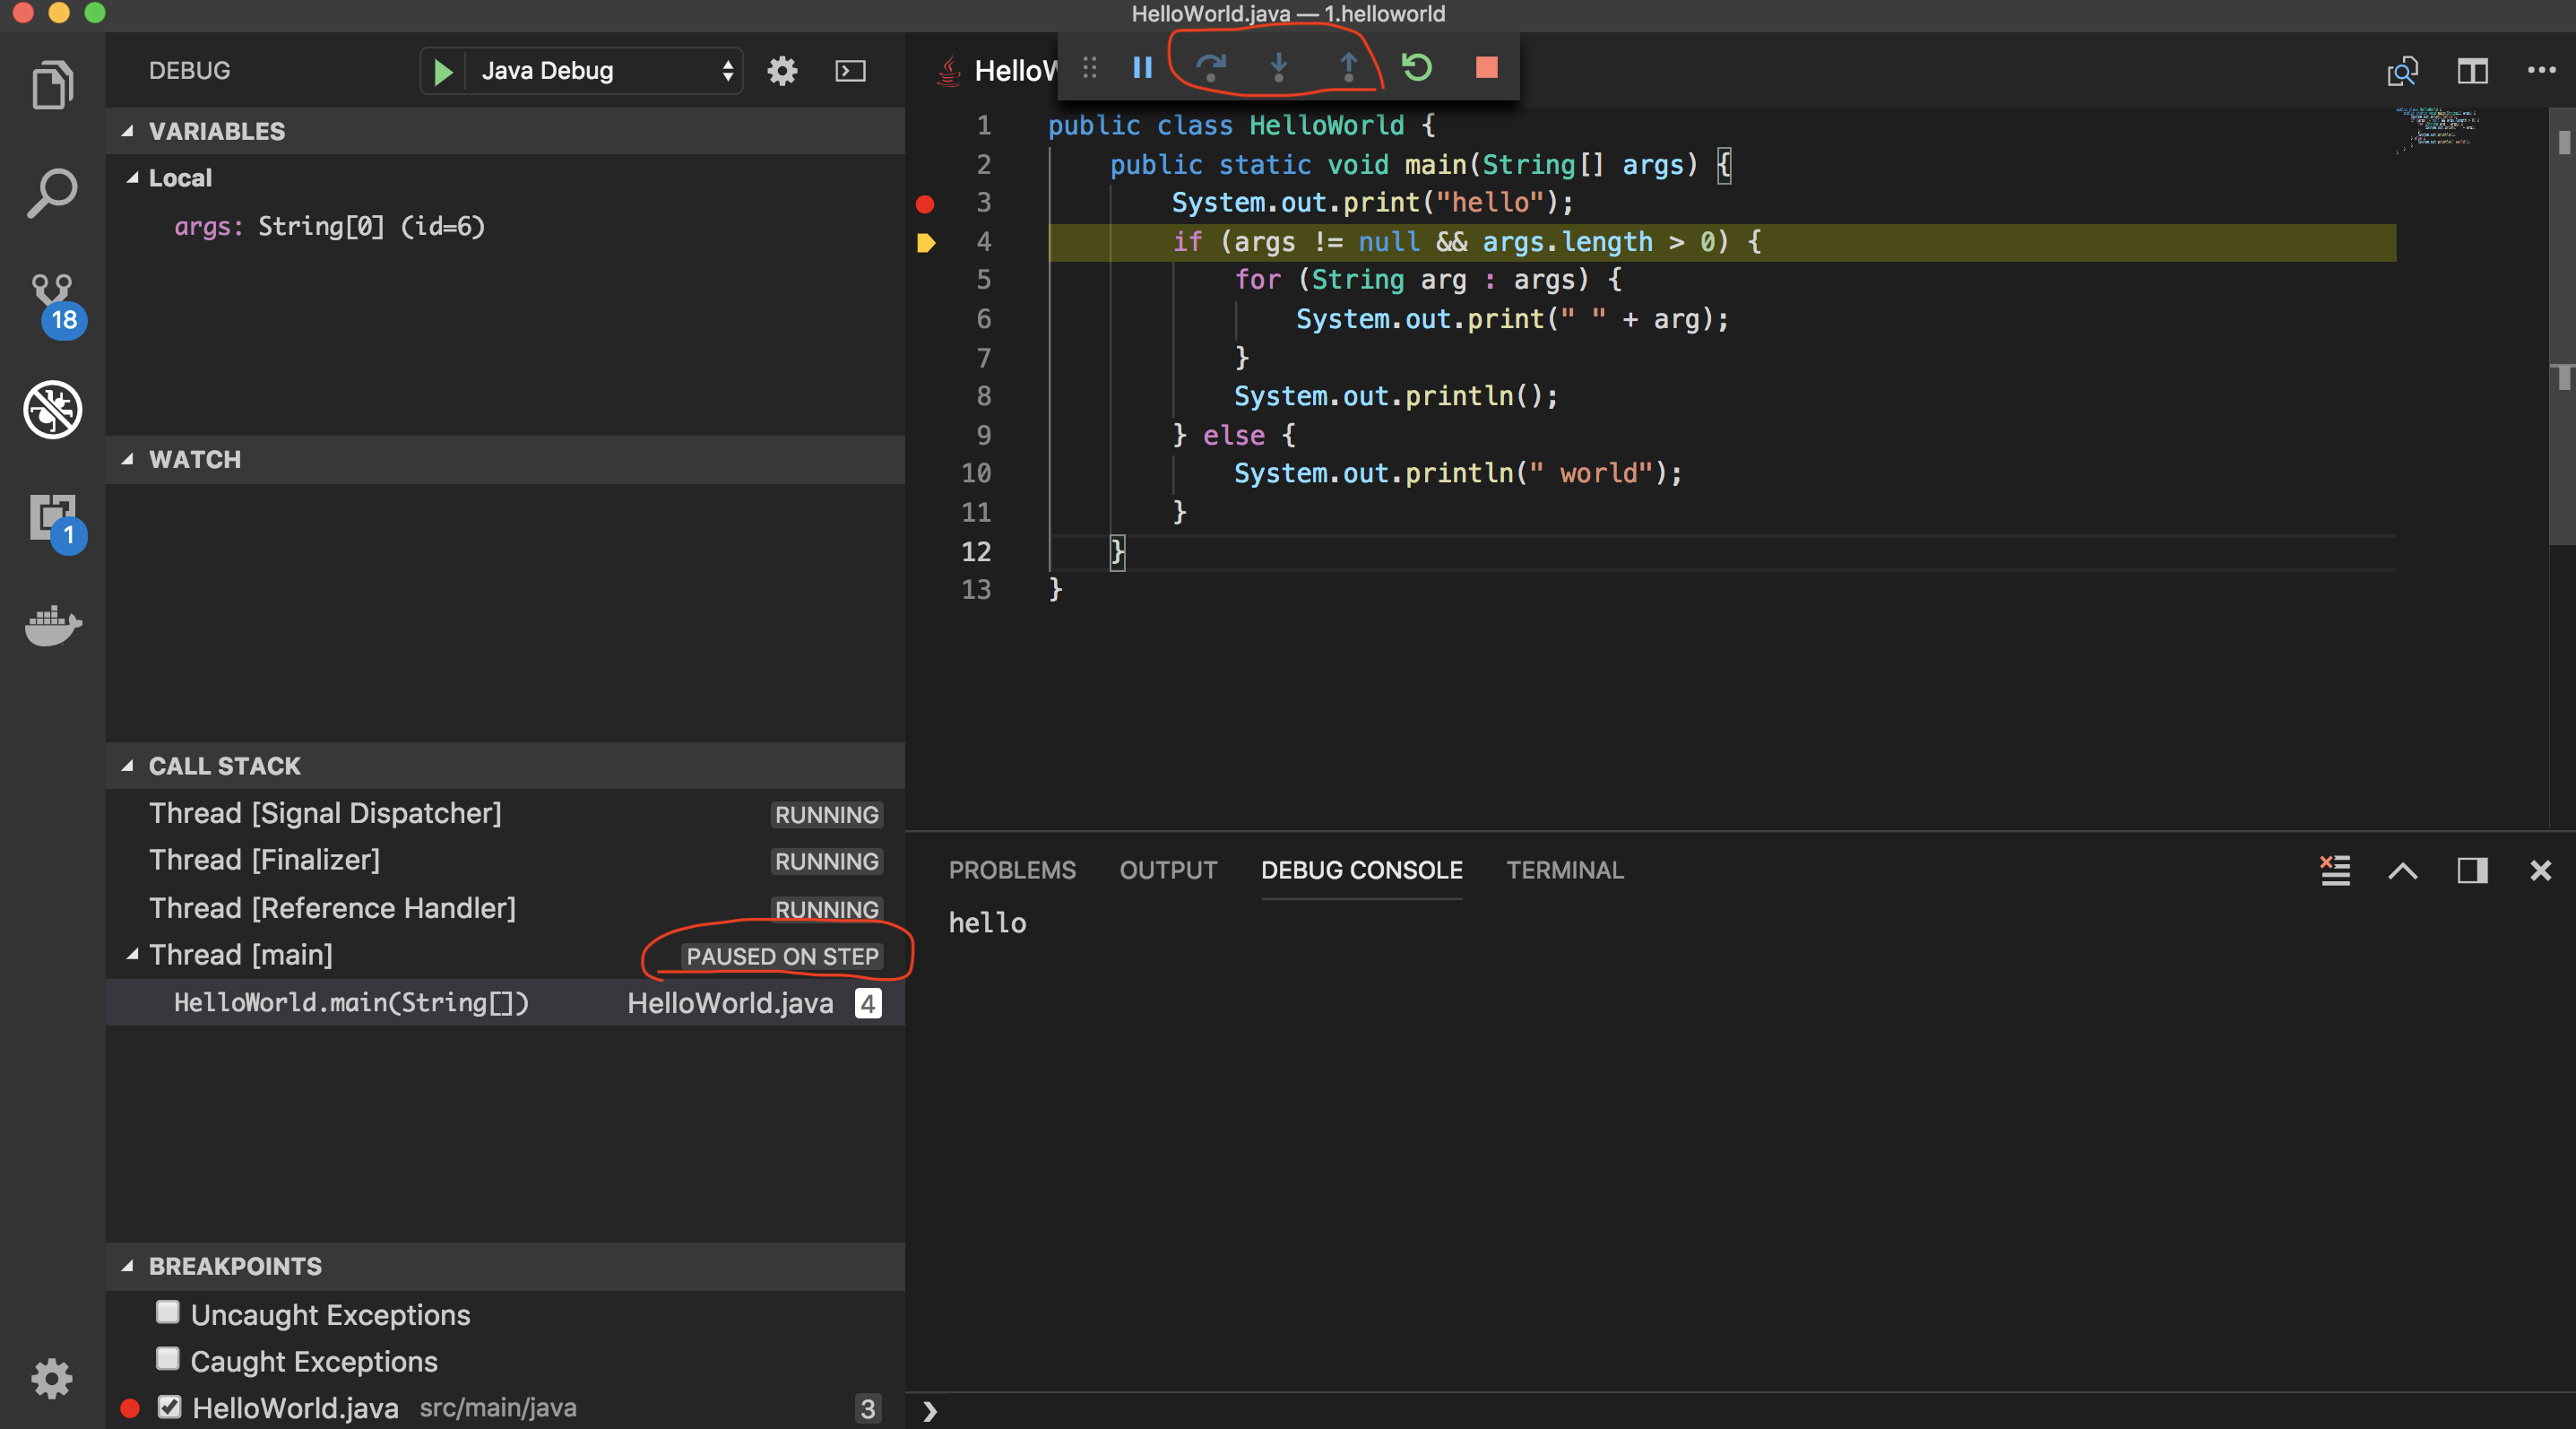
This issue is stably reproduced on macOS/ubuntu. Also there is some user reporting it occurs in Windows 10 sometimes, and downgrade to 1.26.0, the issue disappear.
The text was updated successfully, but these errors were encountered: