Last updated: 04-27-2021 for Round 5 Scenarios.
Round 4: Scenario Descriptions and Model Details
Previous Round Scenarios and Results: https://covid19scenariomodelinghub.org/viz.html
Even the best models of emerging infections struggle to give accurate forecasts at time scales greater than 3-4 weeks due to unpredictable drivers such as a changing policy environment, behavior change, the development of new control measures, and stochastic events. However, policy decisions around the course of emerging infections often require projections in the time frame of months. The goal of long-term projections is to compare outbreak trajectories under different scenarios, as opposed to offering a specific, unconditional estimate of what “will” happen. As such, long-term projections can guide longer-term decision-making while short-term forecasts are more useful for situational awareness and guiding immediate response. The need for long-term epidemic projections is particularly acute in a severe pandemic, such as COVID-19, that has a large impact on the economy; for instance, economic and budget projections require estimates of outbreak trajectories in the 3-6 month time scale.
From weather to infectious diseases, it has been shown that synergizing results from multiple models gives more reliable projections than any one model alone. In the COVID-19 pandemic this approach has been exemplified by the COVID-19 Forecast Hub, which combines the results of over 30 models (see a report on the first wave of the pandemic). Further, a comparison of the impact of interventions across 17 models has illustrated how any individual model can grossly underestimate uncertainty, while ensemble projections can offer robust projections of COVID-19 the course of the epidemic under different scenarios at a 6-month time scale.
The COVID-19 Forecasting Hub provides useful and accurate short-term forecasts, but there remains a lack of publicly available model projections at 3-6 month time scale. Some single models are available online (e.g., IHME, or Imperial College), but a decade of infectious disease forecasts has demonstrated that projections from a single model are particularly risky. Single model projections are particularly problematic for emerging infections where there is much uncertainty about basic epidemiological parameters (such as the waning of immunity), the transmission process, future policies, the impact of interventions, and how the population may react to the outbreak and associated interventions. There is a need for generating long-term COVID-19 projections combining insights from different models and making them available to decision-makers, public health experts, and the general public. We plan to fill this gap by building a public COVID-19 Scenario Hub to harmonize scenario projections in the United States.
We have specified a set of scenarios and target outcomes to allow alignment of model projections for collective insights. Scenarios have been designed in consultation with academic modeling teams and government agencies (e.g., CDC).
The COVID-19 Scenario Modeling Hub is be open to any team willing to provide projections at the right temporal and spatial scales, with minimal gatekeeping. We only require that participating teams share point estimates and uncertainty bounds, along with a short model description and answers to a list of key questions about design. A major output of the projection hub would be ensemble estimates of epidemic outcomes (e.g., cases, hospitalization and/or deaths), for different time points, intervention scenarios, and US jurisdictions.
Those interested to participate should register here. Registration does not commit participants to submitting model contributions.
Model projections should be submitted via pull request to the data-processed folder of this GitHub repository. Technical instructions for submission and required file formats can be found here.
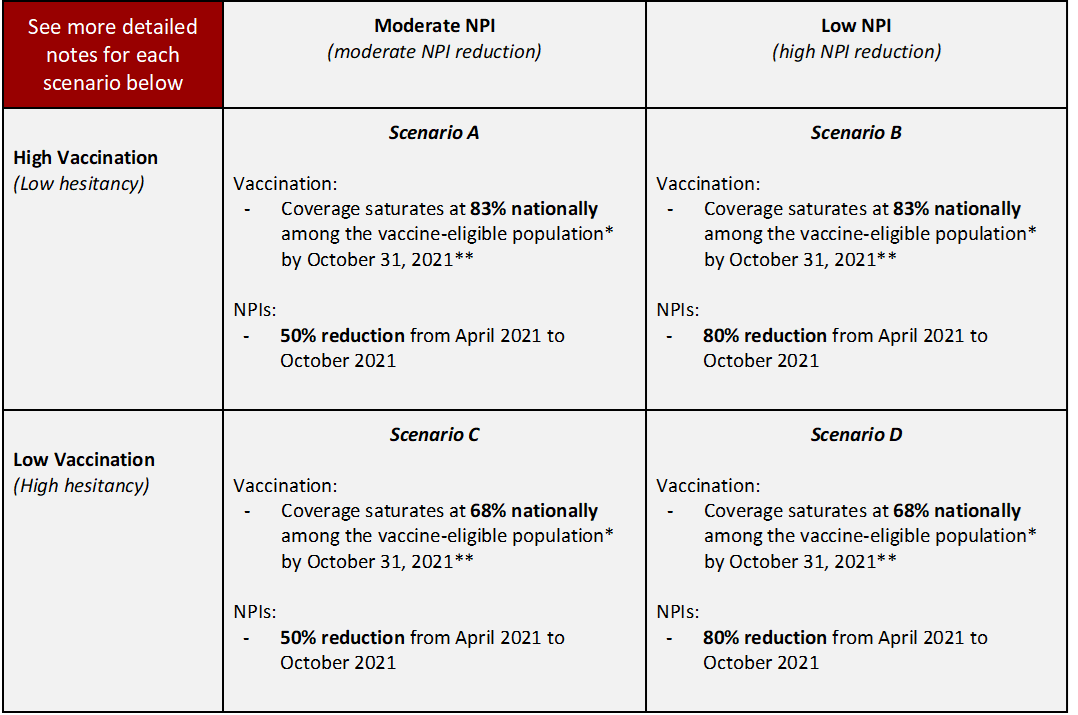
* Vaccine-eligible population. The eligible population for vaccination is presumed to be individuals aged 16 years or older until June 1, 2021. On June 1, the eligible population is presumed to extend to individuals aged 12 years and older.
* Vaccine hesitancy is expected to cause vaccination coverage to slow and eventually saturate at some level below 100%. The saturation levels provided in these scenarios are National reference points to guide defining hesitancy, though the speed of that saturation and heterogeneity between states (or other geospatial scales) and/or age groups are at the discretion of the modeling team. The high vaccination 83% saturation is defined using the current estimates from the Delphi group (link) from March 13, 2021 data. The low saturation estimate of 68% is the lowest county-level estimate from the U.S. Census Bureau’s Pulse Survey from March 15, 2021 data (link). Both of these saturation levels are assumed to be among the population eligible for vaccination, not the full population.
Vaccination
- Doses available:
- 50M Moderna/Pfizer 1st doses, 15M J&J doses available monthly
- Supply has likely eclipsed demand at this stage. Number of doses are for reference and as a reminder to account for different VE by manufacturer, but no longer indicate number of doses administered. Distribution of doses by manufacturer and associated vaccine efficacy should fit within these dose bounds.
- VE:
- 75% and 95% against symptoms (Moderna/Pfizer 1st and 2nd dose)
- 70% against symptoms (J&J)
- VE is defined here as vaccine effectiveness against symptomatic disease. Teams should make their own informed assumptions about effectiveness and impacts on other outcomes (e.g., infection, hospitalization, death). Data on VE studies of infection and symptomatic disease are included below.
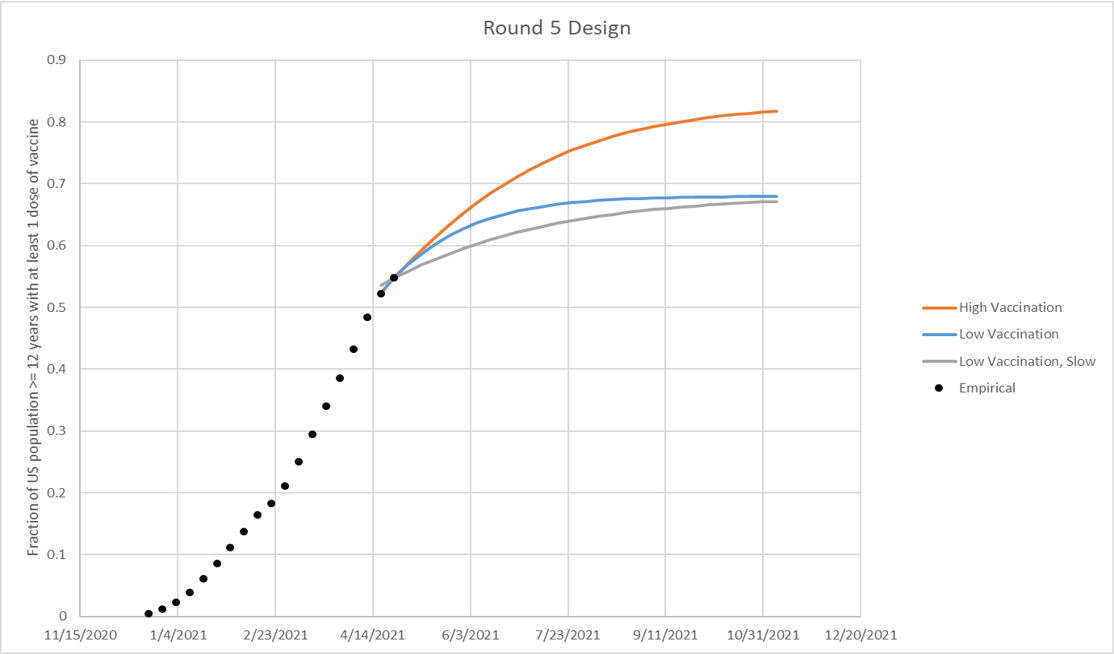
Vaccine hesitancy is expected to cause vaccination coverage to slow and eventually saturate at some level below 100%. The saturation levels provided in these scenarios are illustrative National reference points to guide defining hesitancy. The high vaccination scenario (low hesitancy) saturates at approximately 83% vaccination coverage nationally among the eligible population, as defined by current estimates from the Delphi group (link) from March 13, 2021 data (red line in figure). The low vaccination scenario (high hesitancy) saturates at approximately 68% vaccination coverage nationally among the eligible population, defined by the lowest county-level estimate from the U.S. Census Bureau’s Pulse Survey (link) from March 15, 2021 data. The speed of vaccination saturation should be defined by the modeling team, and can be defined as a logistic function (red and blue lines in figure below) or at different speeds (green line below). State or smaller geospatial unit and/or age group hesitancy limits should be defined by the modeling team using their best judgement. Overall national hesitancy should be similar to the illustrative levels defined in the scenarios, though is not expected to be exact. The eligible population for vaccination is presumed to be individuals aged 16 years or older until June 1, 2021. On June 1, the eligible population is presumed to extend to individuals aged 12 years and older.
| Scenario | Scenario name for submission file | Scenario ID for submission file |
|---|---|---|
| Scenario A. High Vaccination, Moderate NPI | highVac_modNPI | A-2021-05-02 |
| Scenario B. High Vaccination, Low NPI | highVac_lowNPI | B-2021-05-02 |
| Scenario C. Low Vaccination, Moderate NPI | lowVac_modNPI | C-2021-05-02 |
| Scenario D. Low Vaccination & Low NPI | lowVac_lowNPI | D-2021-05-02 |
- Submission date: May 4, 2021
- End date for fitting data: May 1, 2021 - no fitting should be done to data from after this date
- Start date for fifth-round scenarios: May 2, 2021 (week ending May 8) - first date of simulated outcomes
- Simulation end date: October 30, 2021 (26-week horizon)
-
Social Distancing Measures:
- Includes combined effectiveness/impact of all non-pharmaceutical interventions and behavior change.
- Declines over a period of 6 months starting at the start of May 2021 and ending in October 2021 at designated level of control effectiveness observed for April 2021.
- Decline can be implemented at teams’ discretion (e.g., daily or monthly stepdowns).
- Decline can be gradual or sudden, and can differ in speed between states.
- The effectiveness of control in April 2021 should be based on the last two weeks of the month.
- Reduction should be implemented based on each team’s best judgment, but should be done in such a way that a 100% reduction (0% of April 2021 effectiveness) would approximate an epidemic without NPIs (e.g., no masks, no social distancing) in place, but still including immunity, vaccination, etc. We recognize there is uncertainty about what transmission would be without NPIs; this uncertainty should be incorporated into the scenario projections.
-
Testing-Trace-Isolate: constant at baseline levels
-
Masking: Included as part of “Social Distancing Measures” above.
-
Vaccination:
- Pfizer / Moderna
- Vaccine efficacy (2-dose vaccines):
- First dose: 75% against symptoms, 14 days after 1st dose
- Second dose: 95% against symptoms, 14 days after 2nd dose
- Effectiveness and impact on infection and other outcomes (hospitalizations, deaths) is at team’s discretion and should be clearly documented in team’s metadata.
- Doses 3.5 weeks apart
- Vaccine availability:
- December-April: based on data on administered doses
- May-October: 50 million available first doses/month, with the intention of protocols being followed (100M doses/mo)
- Vaccine efficacy (2-dose vaccines):
- Johnson & Johnson
- Vaccine efficacy (1-dose vaccine):
- Single dose: 70% against symptoms, 14 days after dose
- Effectiveness and impact on infection and other outcomes (hospitalizations, deaths) is at team’s discretion and should be clearly documented in team’s metadata.
- Vaccine availability:
- March-April: based on data on administered doses, with continuing at rate current on date of projection for remainder of month.
- April-September: 15M doses/month available May-October 2021
- Vaccine efficacy (1-dose vaccine):
- Pfizer / Moderna
-
Vaccine Hesitancy: Vaccine hesitancy expected to cause vaccination coverage to slow and saturate below 100%. National vaccination saturation levels designated for each scenario serve as illustrative reference points to guide defining hesitancy, though the speed of that saturation and heterogeneity between states (or other geospatial scale) and/or age groups are at the discretion of the team.
-
B.1.1.7 Variant strain: Teams should model the B.1.1.7 variant as appropriate to their model. Any assumptions (e.g., differences in severity/mortality, VE, or natural immunity) should be clearly defined in the metadata. The default assumptions are that the variant is 1.5x more transmissible than current strains and reaches 50% dominance by March 15 and 100% dominance by May 1 (see MMWR report); here a 1.5x increase in transmissibility is defined as the increase in the expected number of infections by a single infected individual over their entire course of infection when there are no interventions or immunity in the population (e.g., a 1.5x increase in R0 in a classic epidemic model). No differences between B.1.1.7 and current strains in severity, mortality, or VE are assumed in default.
-
Transmission assumptions: models fit to US state-specific dynamic up until "End date for fitting data" specified above – no proscribed R0, interventions, etc.
-
Pathogenicity assumptions: no exogenous fluctuations in pathogenicity/transmissibility beyond seasonality effects
-
Vaccine effectiveness: level of effectiveness and available doses are specified for each scenario; assumptions regarding time required to develop immunity, age-related variation in effectiveness, duration of immunity, and additional effects of the vaccine on transmission are left to the discretion of each team
-
Vaccine allocation: between-state allocation is based on population per the CDC/NAS guidelines (proportional allocation); within-state allocation and the impact of vaccine hesitancy are left to the discretion of each team
-
Vaccine immunity delay: There is approximately a 14 day delay according to the Pfizer data; because we suspect the post first dose and post second dose delays may be of similar length, we do not believe there is any need to explicitly model a delay, instead groups can delay vaccine receipt by 14 days to account for it
-
Vaccine uptake: See specific details.
-
Vaccine rollout: rollout to follow ACIP recommendations unless known to be contradicted by state recommendations
- Phase 1a: health care workers, long-term care facilities
- Phase 1b: frontline essential workers, adults 75+
- Phase 1c: other essential workers, adults with high-risk conditions, adults 65-74
-
NPI assumptions: phased reductions of NPIs in 2021 that align with patterns observed at different times in the course of the epidemic in 2020-21 (see scenario-specific guidance); teams have some liberty on how to implement these reductions within the guidelines
-
Database tracking of NPIs: teams may use their own data if desired, otherwise we recommend the following sources as a common starting point:
-
Geographic scope: state-level and national projections
-
Results: some subset of the following
- Weekly incident deaths
- Weekly cumulative deaths since start of pandemic (use JHU CSSE for baseline)
- Weekly incident reported cases
- Weekly cumulative reported cases since start of pandemic (use JHU CSSE for baseline)
- Weekly incident hospitalizations
- Weekly cumulative hospitalizations since simulation start
- Weeks will follow epi-weeks (Sun-Sat) dated by the last day of the week
-
“Ground Truth”: The same data sources as the forecast hub will be used to represent “true” cases, deaths and hospitalizations. Specifically, JHU CSSE data for cases and deaths and HHS data for hospitalization.
-
Metadata: We will require a brief meta-data form, TBD, from all teams.
-
Uncertainty: aligned with the Forecasting Hub we ask for 0.01, 0.025, 0.05, every 5% to 0.95, 0.975, and 0.99 quantiles
-
Ensemble Inclusion: at present time, in order to be included in the ensemble models need to provide a full set of quantiles
- Round 2 Scenarios
- Round 3 Scenarios
- Round 4 Scenarios
Groups interested in participating can submit model projections for each scenario in a CSV file formatted according to our specifications, and a metadata file with a description of model information. See here for technical submission requirements. Groups can submit their contributions as often as they want; the date of when a model projection was made (projection date) is recorded in the model submission file.
Model projections will have an associated model_projection_date that corresponds to the day the projection was made.
For week-ahead model projections with model_projection_date of Sunday or Monday of EW12, a 1 week ahead projection corresponds to EW12 and should have target_end_date of the Saturday of EW12. For week-ahead projections with model_projection_date of Tuesday through Saturday of EW12, a 1 week ahead projection corresponds to EW13 and should have target_end_date of the Saturday of EW13. A week-ahead projection should represent the total number of incident deaths or hospitalizations within a given epiweek (from Sunday through Saturday, inclusive) or the cumulative number of deaths reported on the Saturday of a given epiweek. We have created a csv file describing projection collection dates and dates to which projections refer to can be found. Model projection dates in the COVID-19 Scenario Modeling Hub are equivelent to the forecast dates in the COVID-19 Forecast Hub.
We will use the daily reports containing COVID-19 cases and deaths data from the JHU CSSE group as the gold standard reference data for cases and deaths in the US. We will use the distribution of the JHU data as provided by the COVIDcast Epidata API maintained by the Delphi Research Group at Carnegie Mellon University.
For COVID-19 hospitalizations, we will use the same truth data as the COVID-19 Forecast Hub, i.e., the HealthData.gov COVID-19 Reported Patient Impact and Hospital Capacity by StateTimeseries. These data are released weekly although, sometimes, are updated more frequently.
A supplemental data source with daily counts that should be updated more frequently (typically daily) but does not include the full time-series is HealthData.gov COVID-19 Reported Patient Impact and Hospital Capacity by State.
Work is in progress to distribute these hospitalization data through the Covidcast Epidata API. For more information about hospitalization data, see the data section on the COVID-19 Forecast Hub.
Model projections may be submitted for any state in the US and the US at the national level.
Model projections will be represented using quantiles of predictive distributions. Similar to the COVID-19 Forecast hub, we encourage all groups to make available the following 23 quantiles for each distribution: c(0.01, 0.025, seq(0.05, 0.95, by = 0.05), 0.975, 0.99). One goal of this effort is to create probabilistic ensemble scenarios, and having high-resolution component distributions will provide data to create better ensembles.
We aim to combine model projections into an ensemble. Methods and further information will be shared when the first round of model projections have been received.
We are grateful to the teams who have generated these scenarios. The groups have made their public data available under different terms and licenses. You will find the licenses (when provided) within the model-specific folders in the data-processed directory. Please consult these licenses before using these data to ensure that you follow the terms under which these data were released.
All source code that is specific to the overall project is available under an open-source MIT license. We note that this license does NOT cover model code from the various teams or model scenario data (available under specified licenses as described above).
Those teams interested in accessing additional computational power should contact Katriona Shea at k-shea@psu.edu.
- Johns Hopkins ID Dynamics COVID-19 Working Group — COVID Scenario Pipeline
- Joseph C. Lemaitre (EPFL), Juan Dent Hulse (Johns Hopkins Infectious Disease Dynamics), Kyra H. Grantz (Johns Hopkins Infectious Disease Dynamics), Joshua Kaminsky (Johns Hopkins Infectious Disease Dynamics), Stephen A. Lauer (Johns Hopkins Infectious Disease Dynamics), Elizabeth C. Lee (Johns Hopkins Infectious Disease Dynamics), Justin Lessler (Johns Hopkins Infectious Disease Dynamics), Hannah R. Meredith (Johns Hopkins Infectious Disease Dynamics), Javier Perez-Saez (Johns Hopkins Infectious Disease Dynamics), Claire P. Smith (Johns Hopkins Infectious Disease Dynamics), Shaun A. Truelove (Johns Hopkins Infectious Disease Dynamics), Lindsay T. Keegan (University of Utah), Kathryn Kaminsky, Sam Shah, Josh Wills, Pierre-Yves Aquilanti (Amazon Web Service), Karthik Raman (Amazon Web Services), Arun Subramaniyan (Amazon Web Services), Greg Thursam (Amazon Web Services), Anh Tran (Amazon Web Services)
- Johns Hopkins University Applied Physics Lab — Bucky
- Matt Kinsey (JHU/APL), Kate Tallaksen (JHU/APL), R.F. Obrecht, Laura Asher (JHU/APL), Cash Costello (JHU/APL), Michael Kelbaugh (JHU/APL), Shelby Wilson (JHU/APL)
- Karlen Working Group — pypm
- Dean Karlen (University of Victoria and TRIUMF)
- Northeastern University MOBS Lab — GLEAM COVID
- Matteo Chinazzi (Laboratory for the Modeling of Biological and Socio-technical Systems, Northeastern University, Boston, MA), Jessica T. Davis (Laboratory for the Modeling of Biological and Socio-technical Systems, Northeastern University, Boston, MA), Kunpeng Mu (Laboratory for the Modeling of Biological and Socio-technical Systems, Northeastern University, Boston, MA)„ Xinyue Xiong (Laboratory for the Modeling of Biological and Socio-technical Systems, Northeastern University, Boston, MA), Ana Pastore y Piontti (Laboratory for the Modeling of Biological and Socio-technical Systems, Northeastern University, Boston, MA), Alessandro Vespignani (Laboratory for the Modeling of Biological and Socio-technical Systems, Northeastern University, Boston, MA)
- USC Data Science Lab — SI kJalpha
- Ajitesh Srivastava, University of Southern California
- University of Virginia — adaptive
- Przemyslaw Porebski (UVA), Srini Venkatramanan (UVA), Anniruddha Adiga (UVA), Bryan Lewis (UVA), Brian Klahn (UVA), Joseph Outten (UVA), James Schlitt (UVA), Patric Corbett (UVA), Pyrros Alexander Telionis (UVA), Lijing Wang (UVA), Akhil Sai Peddireddy (UVA), Benjamin Hurt (UVA), Jiangzhou Chen (UVA), Anil Vullikanti (UVA), Madhav Marathe (UVA)
- Justin Lessler, Johns Hopkins University
- Katriona Shea, Penn State University
- Cécile Viboud, NIH Fogarty
- Shaun Truelove, Johns Hopkins University
- Rebecca Borchering, Penn State University
- Claire Smith, Johns Hopkins University
- Emily Howerton, Penn State University
- Nick Reich, University of Massachussetts at Amherst
- Wilbert Van Panhuis, University of Pittsburgh
- Michael Runge, USGS
- Lucie Contamin, University of Pittsburgh
- John Levander, University of Pittsburgh
- Jessica Salerno, University of Pittsburgh