Examples:


![]()
Visualizes your BenchmarkDotNet benchmarks to Colorful images, Feature-rich HTML, and customizable markdown files (and maybe powerful charts in the future!)
In Simple Words: You can create something like this 👇
- A Real World Demo (.NET Collections Benchmark 🚀)
- Getting Started
- Using BenchmarkAutoRunner to Run your benchmarks
- Using JoinReports method to Join and Pivot your reports
- Todo and Contribution
A Comprehensive Performance Comparison Benchmark Between Different .NET Collections.
https://github.com/mjebrahimi/DotNet-Collections-Benchmark/
PM> Install-Package BenchmarkDotNetVisualizerMethods:
- SaveAsImageAsync()
- SaveAsHtmlAsync()
- SaveAsHtmlAndImageAsync()
Example:
var summary = BenchmarkRunner.Run<JsonSerializersBenchmark>();
//[ProjectDirectory]\Reports\JsonSerializers\Benchmark.html
var htmlFileName = DirectoryHelper.GetPathRelativeToProjectDirectory(@"Reports\JsonSerializers\Benchmark.html");
//[ProjectDirectory]\Reports\JsonSerializers\Benchmark.png
var imageFileName = DirectoryHelper.GetPathRelativeToProjectDirectory(@"Reports\JsonSerializers\Benchmark.png");
await summary.SaveAsHtmlAndImageAsync(
htmlPath: htmlFileName,
imagePath: imageFileName,
options: new ReportHtmlOptions
{
Title = "Json Serializers Benchmark",
GroupByColumns = ["Method"], // Groups by 'Method' column and highlights groups
SpectrumColumns = ["Mean", "Allocated"], // Colorizes 'Mean' and 'Allocated' columns as Spectrum
DividerMode = RenderTableDividerMode.EmptyDividerRow, // Separates tables by Empty Divider Row
HtmlWrapMode = HtmlDocumentWrapMode.Simple // Uses simple HTML table
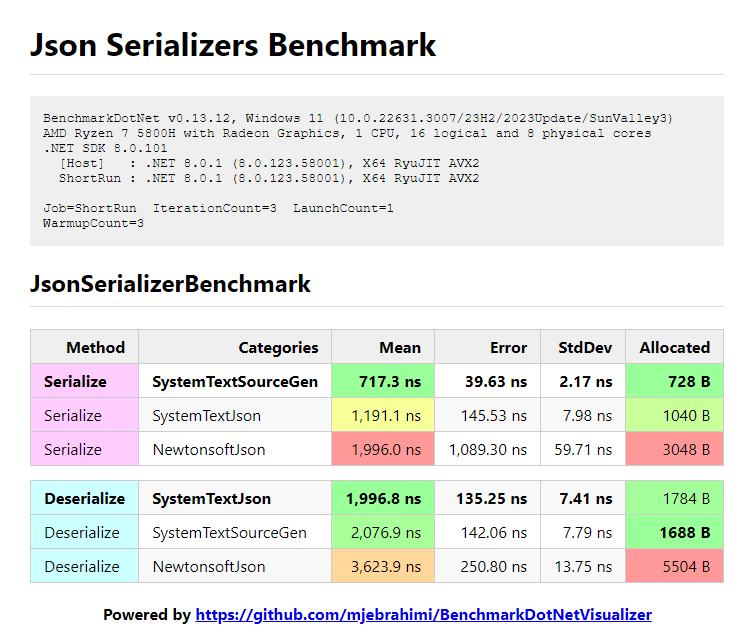
});Output HTML:
Visit this HTML page at samples/Reports/JsonSerializers/Benchmark.html
Output Image:
Exporters:
- [RichImageExporter]
- [RichHtmlExporter]
Example:
BenchmarkRunner.Run<JsonSerializersBenchmark>();

//Exports colorful image
[RichImageExporter(
    title: "Json Serializers Benchmark",
    groupByColumns: ["Method"],             // Groups by 'Method' column and highlights groups
    spectrumColumns: ["Mean", "Allocated"], // Colorizes 'Mean' and 'Allocated' columns as Spectrum and Sorts the result by them
    //format: ImageFormat.Webp or Jpeg      // You can set image format (Default is ImageFormat.Png)
)]

//Exports feature-rich HTML
[RichHtmlExporter(
    title: "Json Serializers Benchmark",
    groupByColumns: ["Method"],             // Groups by 'Method' column and highlights groups
    spectrumColumns: ["Mean", "Allocated"]  // Colorizes 'Mean' and 'Allocated' columns as Spectrum and Sorts the result by them
    //sortByColumns: ["Mean", "Allocated"]  // You can also sort by other columns as you wish
)]

[MemoryDiagnoser(displayGenColumns: false)] // Displays Allocated column (without GC per Generation columns (Gen 0, Gen 1, Gen 2) due to false option)
public class JsonSerializersBenchmark { ... }
Output:
To see the results, navigate to the following path:
[ProjectDirectory]\bin\[Debug|Release]\[.NET-version]\BenchmarkDotNet.Artifacts\results\Benchmark-report-rich.html|png
For Example:
MyBenchmark\bin\Release\net8.0\BenchmarkDotNet.Artifacts\results\Benchmark-report-rich.pngMyBenchmark\bin\Release\net8.0\BenchmarkDotNet.Artifacts\results\Benchmark-report-rich.html
It's Recommend to use BenchmarkAutoRunner.Run() instead of BenchmarkRunner.Run() to run your benchmarks.
BenchmarkAutoRunner is similar to BenchmarkRunner, but uses Job.Dry with InProcessEmitToolchain is case of DEBUG Mode (due to ease of debugging), and your specified job in case of RELEASE Mode.
It also Warns you if you are running project incorrectly. (for example running with Attached Debugger while RELEASE Mode is enabled)
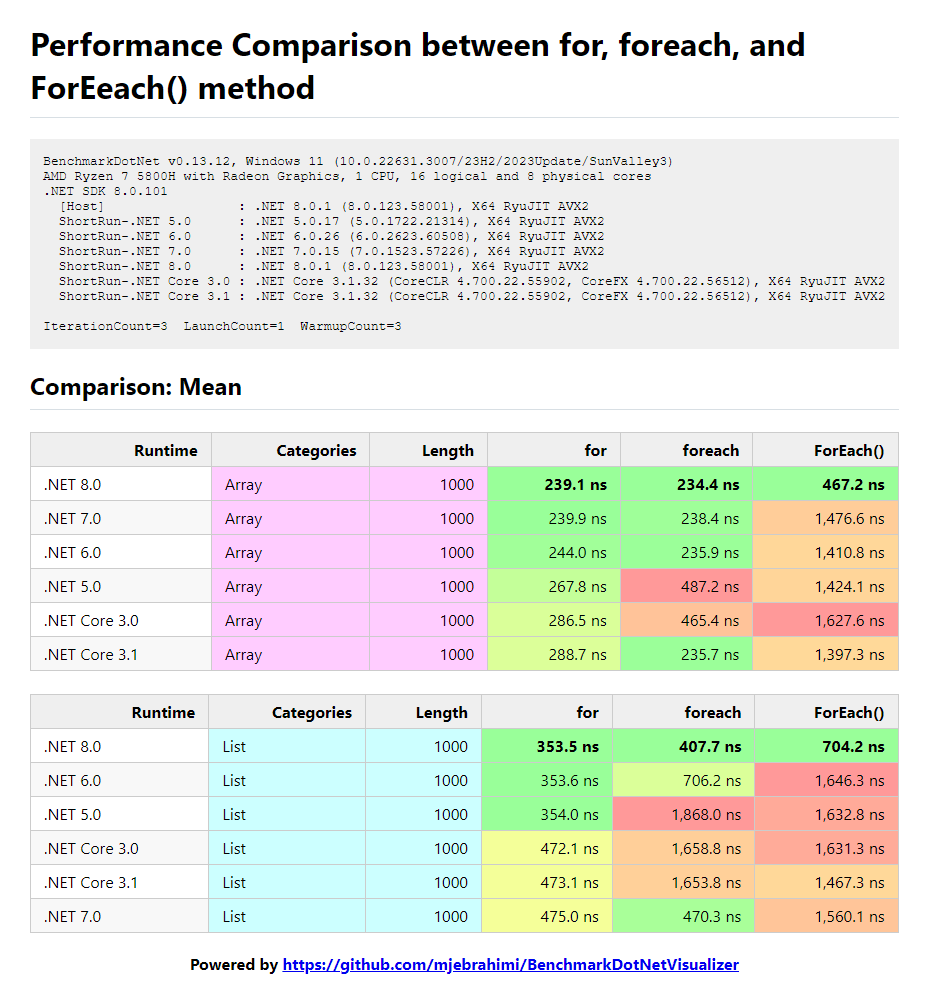
var summary = BenchmarkAutoRunner.Run<IteratorsBenchmark>();Example:
Performance benchmark between for, foreach, and ForEach() in different versions of .NET
//Recommend to use BenchmarkAutoRunner instead of BenchmarkRunner
var summary = BenchmarkAutoRunner.Run<IteratorsBenchmark>();
//[ProjectDirectory]\Reports\Iterators\JoinedBenchmark-PivotBy-Runtime.html
var htmlFileName = DirectoryHelper.GetPathRelativeToProjectDirectory(@"Reports\Iterators\JoinedBenchmark-PivotBy-Runtime.html");
//[ProjectDirectory]\Reports\Iterators\JoinedBenchmark-PivotBy-Runtime.png
var imageFileName = DirectoryHelper.GetPathRelativeToProjectDirectory(@"Reports\Iterators\JoinedBenchmark-PivotBy-Runtime.png");
await summary.JoinReportsAndSaveAsHtmlAndImageAsync(
htmlPath: htmlFileName,
imagePath: imageFileName,
options: new JoinReportHtmlOptions
{
Title = "Performance Comparison between for, foreach, and ForEach() method",
MainColumn = "Method",
GroupByColumns = ["Categories", "Length"], // Groups by column 'Categories' and 'Length'
PivotProperty = "Runtime",
StatisticColumns = ["Mean"],
ColumnsOrder = [".NET Core 3.0", ".NET Core 3.1", ".NET 5.0", ".NET 6.0", ".NET 7.0", ".NET 8.0"], // Order of columns
DividerMode = RenderTableDividerMode.SeparateTables, //Separates tables by Grouping by 'GroupByColumns'
HtmlWrapMode = HtmlDocumentWrapMode.RichDataTables, //Uses feature-rich https://datatables.net plugin
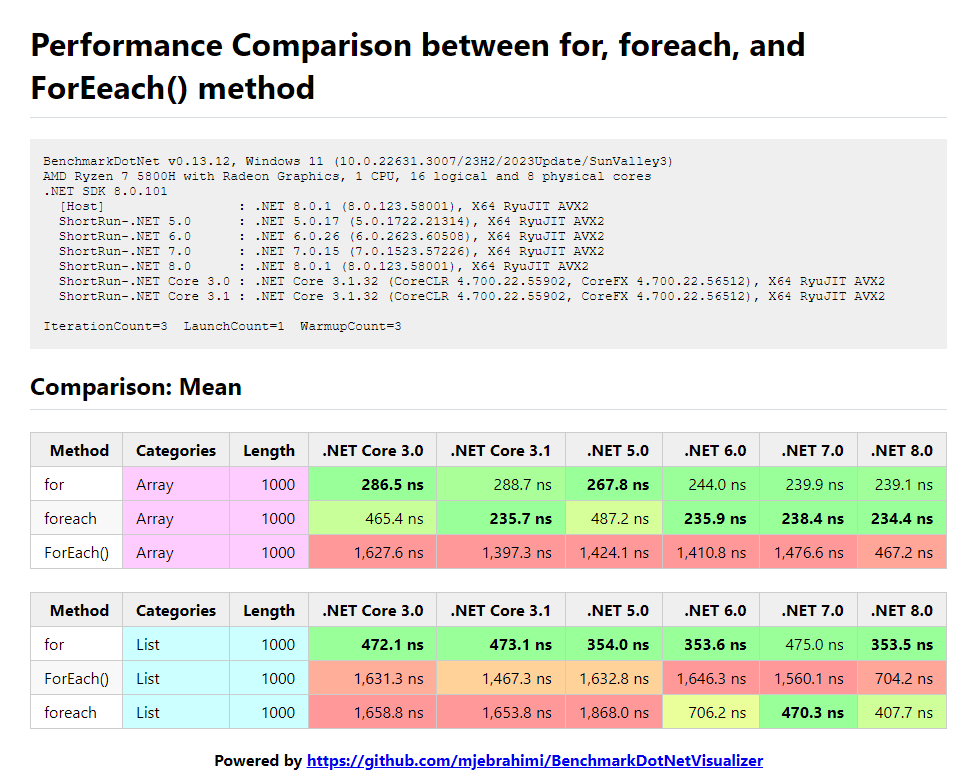
});Output HTML:
Visit this HTML page at samples/Reports/Iterators/JoinedBenchmark-PivotBy-Runtime.html
Output Image:
//Recommend to use BenchmarkAutoRunner instead of BenchmarkRunner
var summary = BenchmarkAutoRunner.Run<IteratorsBenchmark>();
//[ProjectDirectory]\Reports\Iterators\JoinedBenchmark-PivotBy-Method.html
var htmlFileName = DirectoryHelper.GetPathRelativeToProjectDirectory(@"Reports\Iterators\JoinedBenchmark-PivotBy-Method.html");
//[ProjectDirectory]\Reports\Iterators\JoinedBenchmark-PivotBy-Method.png
var imageFileName = DirectoryHelper.GetPathRelativeToProjectDirectory(@"Reports\Iterators\JoinedBenchmark-PivotBy-Method.png");
await summary2.JoinReportsAndSaveAsHtmlAndImageAsync(
htmlPath: htmlFileName,
imagePath: imageFileName,
options: new JoinReportHtmlOptions
{
Title = "Performance Comparison between for, foreach, and ForEach() method",
MainColumn = "Runtime",
GroupByColumns = ["Categories", "Length"], // Groups by column 'Categories' and 'Length'
PivotProperty = "Method",
StatisticColumns = ["Mean"],
ColumnsOrder = ["for", "foreach", "ForEach()"], // Order of columns
DividerMode = RenderTableDividerMode.SeparateTables, // Separates tables by Grouping by 'GroupByColumns'
HtmlWrapMode = HtmlDocumentWrapMode.RichDataTables, // Uses feature-rich https://datatables.net plugin
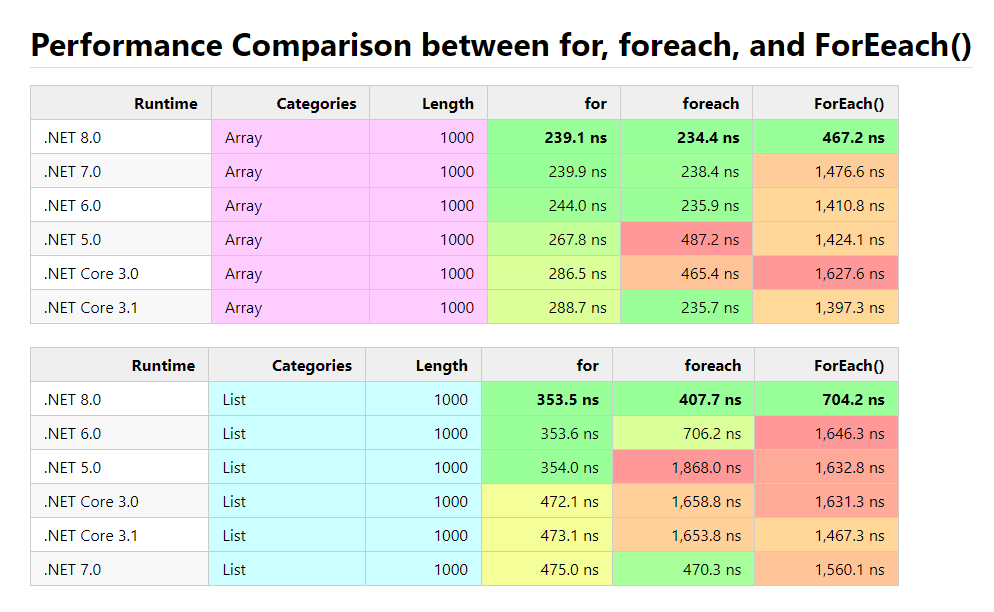
});Output HTML:
Visit this HTML page at samples/Reports/Iterators/JoinedBenchmark-PivotBy-Method.html
Output Image:
- Dark Theme (Need some help for this, wanna help? Please design a beautiful style for dark theme and send a PR)
- Chart Visualization
Create an issue if you find a BUG or have a Suggestion or Question.
If you want to develop this project :
- Fork it!
- Create your feature branch:
git checkout -b my-new-feature - Commit your changes:
git commit -am 'Add some feature' - Push to the branch:
git push origin my-new-feature - Submit a pull request
If you find this repository useful and like it, why not give it a star? if not, never mind! :)
Copyright © 2024 Mohammad Javad Ebrahimi under the MIT License.