-
The call stack is primarily used for function invocation (call).
-
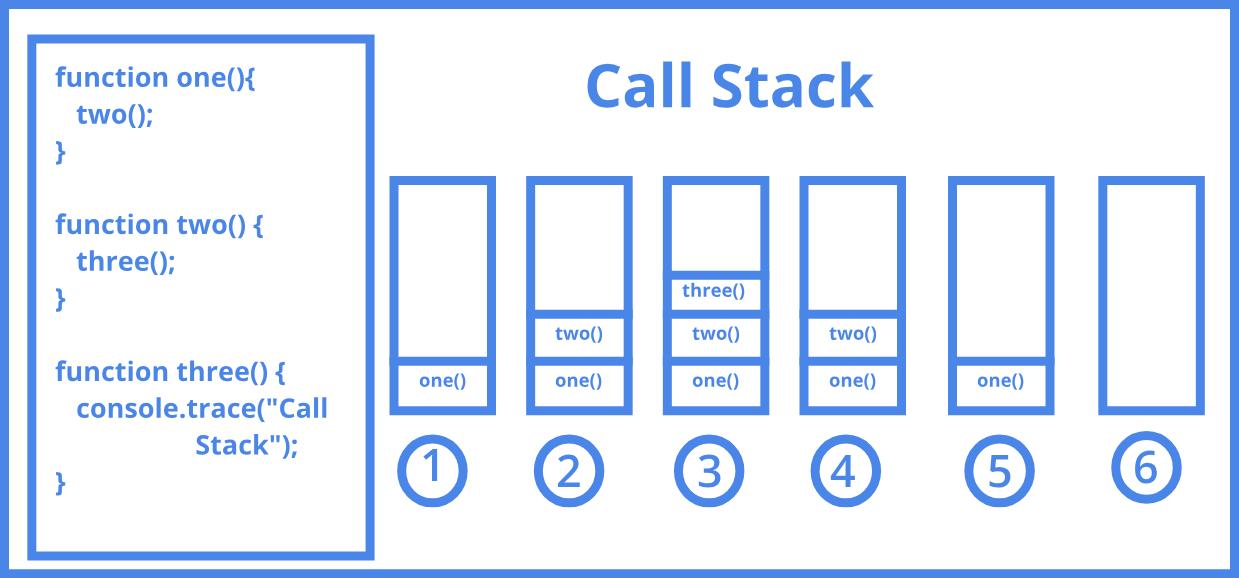
Since the call stack is single, function(s) execution, is done, one at a time, from top to bottom. It means the call stack is synchronous.
-
LIFO: operates by the data structure principle of Last In, First Out, it means that the last function that gets pushed into the stack is the first to be pop out, when the function returns.
-
Draw an example of a call stack and the functions that would need to be invoked to generate that call stack.
-
A stack overflow occurs when there is a recursive function (a function that calls itself) without an exit point. The browser (hosting environment) has a maximum stack call that it can accomodate before throwing a stack error.
-
- This is as simple as when you try to use a variable that is not yet declared you get this type os errors.
- ex : console.log(foo) // Uncaught ReferenceError: foo is not defined
- This is also a common thing when using const and let, they are hoisted like var and function but there is a time between the hoisting and being declared so when you try to access them a reference error occurs, the fact that this happens to let and const is called Temporal Dead Zone (TDZ).
-
- this occurs when you have something that cannot be parsed in terms of syntax.
- ex: when you try to parse an invalid object using JSON.parse. JSON.parse( {'foo': 'bar'} ) // Uncaught SyntaxError: Unexpected token o in JSON at position 1
-
- Try to manipulate an object with some kind of length and give it an invalid length and this kind of errors will show up.
- ex : var foo= [] foo.length = foo.length -1 // Uncaught RangeError: Invalid array length
-
- this types of errors show up when the types (number, string and so on) you are trying to use or access are incompatible, like accessing a property in an undefined type of variable.
- ex : var foo = {} foo.bar // undefined foo.bar.baz // Uncaught TypeError: Cannot read property 'baz' of undefined
-
- The breakpoint can also be achieved by putting a debugger statement in your code in the line you want to break.
- You can also add conditional breakpoints by right-clicking a previous set breakpoint, which will make your program stop at that point only if a condition is met, this is awesome for when you want to debug huge cycles for specific values. In this example the breakpoint will point stop when the index reaches 40.
-
- it show the “history” before reaching that breakpoint. In this case it’s not a long call stack but you can start to see why it is useful, you know the function add was executed in debugger line, with what parameters (which you an see in the scope below the call stack) and you can evaluate whatever will well you at that point in the console.