Skip to content
New issue

Have a question about this project? Sign up for a free GitHub account to open an issue and contact its maintainers and the community.

By clicking “Sign up for GitHub”, you agree to our terms of service and privacy statement. We’ll occasionally send you account related emails.

Already on GitHub? Sign in to your account

v0.6 nuboard can't display anything #150

Closed
CrisCloseTheDoor opened this issue Oct 9, 2022 · 9 comments
Closed

v0.6 nuboard can't display anything #150

CrisCloseTheDoor opened this issue Oct 9, 2022 · 9 comments
Assignees

Comments

@CrisCloseTheDoor
Copy link

CrisCloseTheDoor commented Oct 9, 2022

Ex. What is a lane connector? or How many wheels do your vehicles have?
Hi developer:
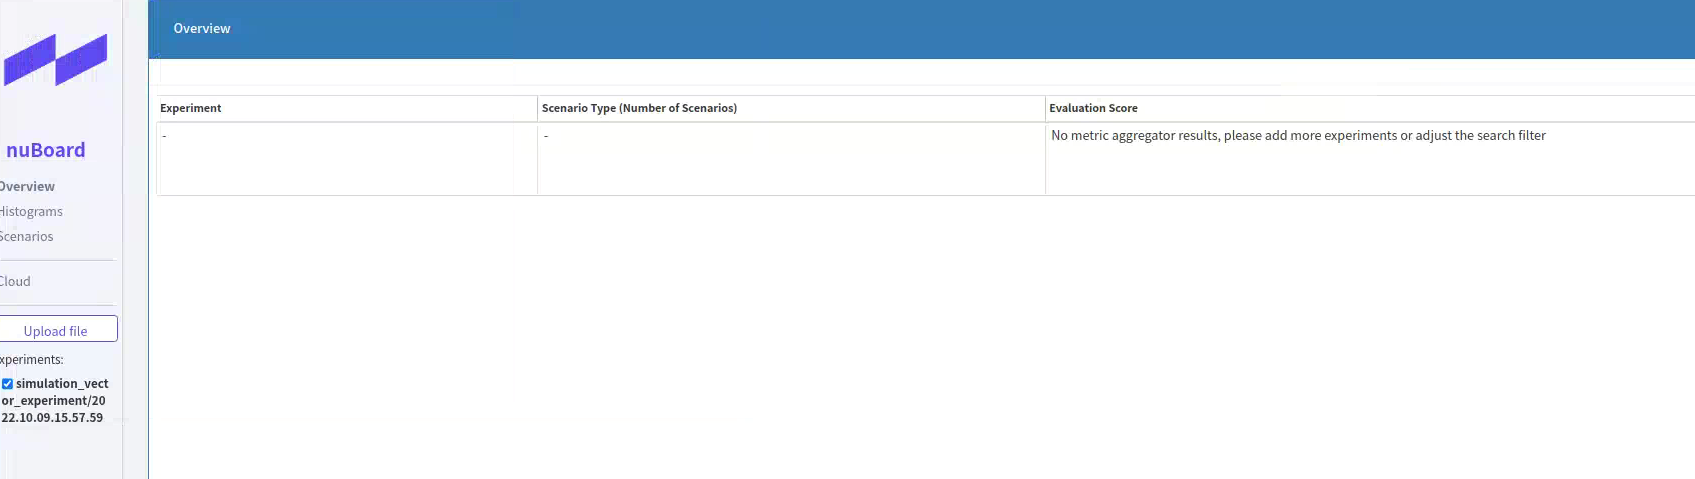
I use the v0.6 devkit and successfully finished training and simulation. But Nuboard cannot display the simulation result, including overview score, histogram and scenarios visualization.
sim_err

However, the v0.6 nuboard can display v0.3 simulation result(only score, no scenario visualization either)

here's my config:

  • training
experiment_name=vector_experiment
py_func=train
+training=training_vector_model
worker=ray_distributed
scenario_builder=nuplan_mini
scenario_builder.data_root=***
lightning.trainer.params.max_epochs=60
data_loader.params.batch_size=3
data_loader.params.num_workers=8
data_loader.params.pin_memory=True
scenario_filter.limit_total_scenarios=10
+lightning.distributed_training.scale_lr=1e-4
optimizer=adamw
lightning.trainer.params.gradient_clip_val=0.3
cache.use_cache_without_dataset=True
cache.cache_path=***
lightning.trainer.checkpoint.resume_training=False
  • simulation
+simulation=closed_loop_nonreactive_agents
experiment_name='simulation_vector_experiment'
scenario_builder.data_root=***
scenario_builder=nuplan_mini
scenario_filter=all_scenarios
scenario_filter.expand_scenarios=False
scenario_filter.num_scenarios_per_type=1
planner=ml_planner
model=vector_model
worker=ray_distributed
planner.ml_planner.model_config=${model}
planner.ml_planner.checkpoint_path=***/nuplan/exp/exp/vector_experiment/2022.10.09.15.25.35/best_model/epoch_13-step_349.ckpt
  • nuboard
simulation_path="[***/nuplan/exp/exp/simulation_vector_experiment/2022.10.09.15.57.59]"
scenario_builder.data_root=***
@patk-motional
Copy link
Collaborator

Hi @CrisCloseTheDoor,

Can you try running nuboard without any parameters and navigating to the file manually through the GUI?

python nuplan/planning/script/run_nuboard.py

@CrisCloseTheDoor
Copy link
Author

Hi @CrisCloseTheDoor,

Can you try running nuboard without any parameters and navigating to the file manually through the GUI?

python nuplan/planning/script/run_nuboard.py

I tried navigating the file in the GUI, but it didn't work, either
sim_err2

@JingyuQian
Copy link

Hi @CrisCloseTheDoor,
From my experience, check 2 things:

  1. v0.6 doesn't do metric aggregation if you use the default setting. Check your simulation log, can you find sth like "No metrics found for aggregation!" at the end of simulations? If so, add ~metric_aggregator.challenge_name in your launch config. (They fixed this in v1.0) Then you'll see aggregated metrics for each scenario type in nuboard.
  2. To select scenario for visualization, go to "scenarios" tab, then click the cogwheel button on the top right corner.
    Hope this solves your problem.

@CrisCloseTheDoor
Copy link
Author

Hi @CrisCloseTheDoor, From my experience, check 2 things:

1. v0.6 doesn't do metric aggregation if you use the default setting. Check your simulation log, can you find sth like "No metrics found for aggregation!" at the end of simulations? If so, add `~metric_aggregator.challenge_name` in your launch config. (They fixed this in v1.0) Then you'll see aggregated metrics for each scenario type in nuboard.

2. To select scenario for visualization, go to "scenarios" tab, then click the cogwheel button on the top right corner.
   Hope this solves your problem.

Thanks for your suggestions, both are helpful after my checking, I will have a try of it.

@hunterkeith2017
Copy link

I met the same situation, have you already solved it? bro @CrisCloseTheDoor

@CrisCloseTheDoor
Copy link
Author

I met the same situation, have you already solved it? bro @CrisCloseTheDoor

Yes, I solved this problem by adding metric_aggregator=default_weighted_average in launch config. The strange thing is that only this aggregator works. v1.0 may fix this problem.

@mh0797
Copy link

mh0797 commented Oct 18, 2022

The problem still persists in devkit-v1.0.
When can we expect a fix for this? Without this is a crucial component, it's not possible to properly evaluate planners.

@gianmarco-motional
Copy link
Contributor

@mh0797 I'm sorry about the inconvenience, we are aware of the issue and have a fix which will land hopefully soon. You should still be able to visualize with nuBoard with one of the following two cases:

  1. Do not alter experiment name when running the simulation
  2. Prepend the challenge you are running to the experiment name (i.e. experiment_name=open_loop_boxes_my_nice_experiment)

@mh0797
Copy link

mh0797 commented Oct 18, 2022

Here are two more solutions i just came across:
3. by setting challenge_name=null for the metric aggregator you want to use, the metric filtering and therefore the metric aggregation here will work. For instance, if you want to evaluate an open loop experiment, add metric_aggregator.open_loop_boxes_weighted_average.challenge_name=null
4. remove the if condition from this line. WARNING: I am not sure what side effects this may have

You can use these approaches also to aggregate metrics for an experiment you already ran.

Sign up for free to join this conversation on GitHub. Already have an account? Sign in to comment
Labels
None yet
Development

No branches or pull requests

6 participants