Test libraries for interactive visualizations #35
Comments
|
@anitagraser from all tasks this seems to be the one that requires the least formal knowledge of both the theory and the code base. If you were to test this where would you start? First time I come across altair. Seems quite useful tho. |
|
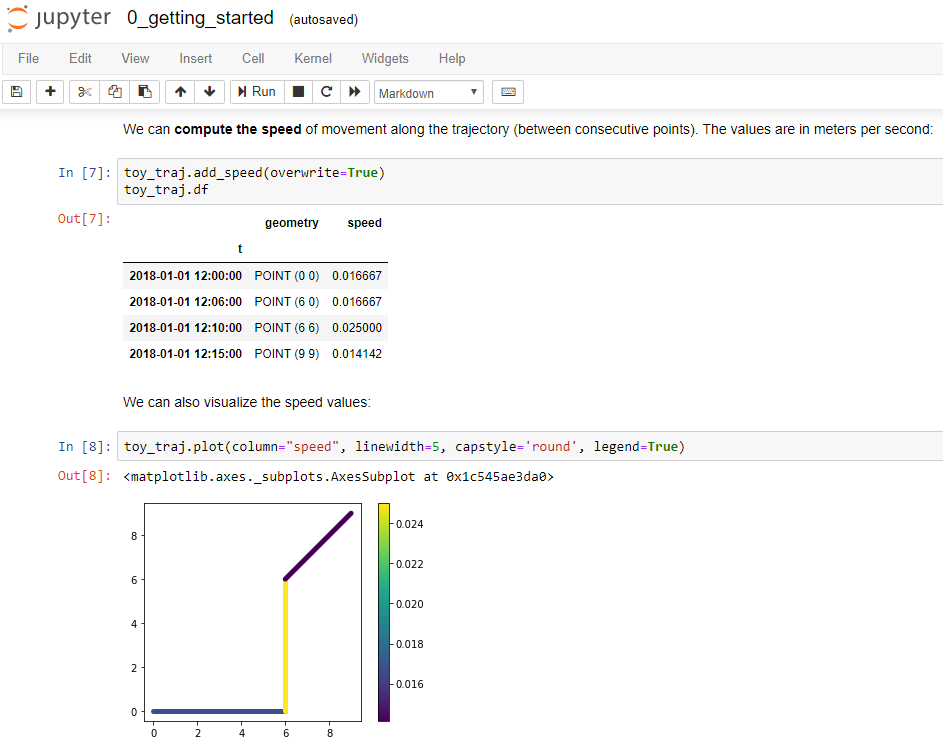
Thank you for your interest in taking over this task @slothkong ! The main advantage I'm hoping for is to have interactive plots. For example, the current Trajectory.plot() function can show speed along the trajectory using different colors and we can add a legend to explain the colors but with Altair, I would hope that the user can hover over a line segment and see the actual speed value.
|
|
ok. I can l play a bit with 0_getting_started.ipynb and see if I can plot the same data with the new lib. |
|
Plotly would be a great addition as well and it would most likely be a more sensible first step. I'll open a separate ticket for plotly. Altair get's really powerful when used to create linked charts but I might be getting ahead of myself. |
|
@slothkong looking forward to seeing what you come up with |
|
I've started an ipynb comparing folium and hvplot:
https://github.com/anitagraser/movingpandas/blob/master/tutorials/3_interactive_maps.ipynb |

|
Going forward with hvplot 1df39ce |
Spatial support is now implemented vega/altair#1664
The text was updated successfully, but these errors were encountered: