-
Notifications
You must be signed in to change notification settings - Fork 0
/
Code.qmd
588 lines (467 loc) · 23 KB
/
Code.qmd
1
2
3
4
5
6
7
8
9
10
11
12
13
14
15
16
17
18
19
20
21
22
23
24
25
26
27
28
29
30
31
32
33
34
35
36
37
38
39
40
41
42
43
44
45
46
47
48
49
50
51
52
53
54
55
56
57
58
59
60
61
62
63
64
65
66
67
68
69
70
71
72
73
74
75
76
77
78
79
80
81
82
83
84
85
86
87
88
89
90
91
92
93
94
95
96
97
98
99
100
101
102
103
104
105
106
107
108
109
110
111
112
113
114
115
116
117
118
119
120
121
122
123
124
125
126
127
128
129
130
131
132
133
134
135
136
137
138
139
140
141
142
143
144
145
146
147
148
149
150
151
152
153
154
155
156
157
158
159
160
161
162
163
164
165
166
167
168
169
170
171
172
173
174
175
176
177
178
179
180
181
182
183
184
185
186
187
188
189
190
191
192
193
194
195
196
197
198
199
200
201
202
203
204
205
206
207
208
209
210
211
212
213
214
215
216
217
218
219
220
221
222
223
224
225
226
227
228
229
230
231
232
233
234
235
236
237
238
239
240
241
242
243
244
245
246
247
248
249
250
251
252
253
254
255
256
257
258
259
260
261
262
263
264
265
266
267
268
269
270
271
272
273
274
275
276
277
278
279
280
281
282
283
284
285
286
287
288
289
290
291
292
293
294
295
296
297
298
299
300
301
302
303
304
305
306
307
308
309
310
311
312
313
314
315
316
317
318
319
320
321
322
323
324
325
326
327
328
329
330
331
332
333
334
335
336
337
338
339
340
341
342
343
344
345
346
347
348
349
350
351
352
353
354
355
356
357
358
359
360
361
362
363
364
365
366
367
368
369
370
371
372
373
374
375
376
377
378
379
380
381
382
383
384
385
386
387
388
389
390
391
392
393
394
395
396
397
398
399
400
401
402
403
404
405
406
407
408
409
410
411
412
413
414
415
416
417
418
419
420
421
422
423
424
425
426
427
428
429
430
431
432
433
434
435
436
437
438
439
440
441
442
443
444
445
446
447
448
449
450
451
452
453
454
455
456
457
458
459
460
461
462
463
464
465
466
467
468
469
470
471
472
473
474
475
476
477
478
479
480
481
482
483
484
485
486
487
488
489
490
491
492
493
494
495
496
497
498
499
500
501
502
503
504
505
506
507
508
509
510
511
512
513
514
515
516
517
518
519
520
521
522
523
524
525
526
527
528
529
530
531
532
533
534
535
536
537
538
539
540
541
542
543
544
545
546
547
548
549
550
551
552
553
554
555
556
557
558
559
560
561
562
563
564
565
566
567
568
569
570
571
572
573
574
575
576
577
578
579
580
581
582
583
584
585
586
587
588
---
format:
revealjs:
theme: ["theme/ppt-theme.scss"]
transition: slide
transition-speed: fast
slide-number: c/t
logo: ""
code-copy: true
center-title-slide: false
chalkboard:
buttons: true
code-fold: true
code-overflow: scroll
code-link: true
highlight-style: a11y
touch: true
controls: true
hash-type: number
hash-one-based-index: true
slide-tone: false
linestretch: 1.5
width: 1024
height: 768
execute:
eval: true
echo: true
editor:
markdown:
wrap: 72
---
<br> <br>
<h1>단일대상 메타분석을 위한 종단분석: R 활용</h1>
<h4>신미경</h4>
<h4>West Texas A&M University 교육학과(특수교육) 조교수</h4>
<br>
<h3>Longitudinal Analysis for Single-Case Experimental Design
Meta-Analyses: Using R</h3>
<h4>Mikyung Shin (Assistant Professor, Dept. of Education)</h4>
<h4>`r fontawesome::fa("github", "#233150")`
[github.com/mshin77/2022ksse](https://github.com/mshin77/2022ksse)
`r fontawesome::fa("home", "#233150")`
[mshin77.net](https://mshin77.net)</h4>
::: footer
2022 한국특수교육학회 동계학술대회 발표 <br> 2022. 12.3. 국립특수교육원
:::
------------------------------------------------------------------------
## `목차`
::: columns
::: {.column width="70%"}
- 단일대상 실험설계 연구의 특성 <br>
- 왜 종단 자료인가? <br>
- 다층 종단 자료 구조 및 코딩 <br>
- 대상자간 중다기초선 설계 그래프 <br>
- 3수준 및 2수준 다층 모형 <br>
- 논의 및 추후 연구에 대한 시사점
:::
::: {.column width="30%"}
{height="250"}
:::
:::
------------------------------------------------------------------------
## `단일대상 문헌분석 연구 동향`
```{r}
suppressPackageStartupMessages({
library(readr)
library(kableExtra)
library(plotly)
library(ggplot2)
library(dplyr)
library(tidyr)
library(nlme)
library(scdhlm)
library(sjPlot)
})
wos <- read_csv("https://raw.githubusercontent.com/mshin77/2022ksse/main/data/wos.csv", show_col_types = FALSE)
year_doc <- wos %>%
group_by(PY) %>%
dplyr::summarize(publication_number = n())
year_TC <- wos %>%
group_by(PY) %>%
dplyr::summarize(total_citation = sum(TC))
year_doc_counts_all <- left_join(year_doc, year_TC, by = "PY")
year_citation_plot <- year_doc_counts_all %>%
ggplot() +
geom_col(aes(PY, publication_number*20), fill = "#B3B3B3") +
geom_line(aes(PY, total_citation), size = 0.5, color="#4C4E52") +
geom_point(aes(PY, total_citation), size = 1.5, color = "#4C4E52") +
scale_y_continuous(sec.axis = sec_axis(~./20, name = "논문 수")) +
labs(x = "", y = "논문 인용 횟수", fill = "") +
theme_classic(base_size = 13) +
theme(
axis.line = element_line(color = "#404040", size = 0.2),
axis.title = element_text(size = 15, color = "#404040"),
axis.text.y.left = element_text(margin = margin(l = 9)),
axis.text.y.right = element_text(margin = margin(r = 15))
)
year_citation_plot
```
## [데이터베이스: Web of Science, 1970-2022, 총 4,679편 ("single case" OR "single subject" OR "N of 1" OR "small N" OR "multiple baseline" OR "multiple probe" OR "alternating treatment" OR "reversal design" OR "withdrawal design" OR "changing criterion" ) AND ("meta-analysis" OR "synthesis" OR "review")]{style="font-size: 0.65em"}
## `단일대상 실험설계 연구의 특성`
- 개별 학생(*N*=1) 또는 소집단을 대상으로 중재를 제공
- 행동의 예측, 검증, 재현 과정을 통하여 내적 타당도를 확인
- 그래프 데이터가 수집되어야 하며, 시각적인 분석이 이루어짐
- 연구설계에 따라서 기초선, 중재, 유지, 일반화 구간 등 설정
```{r}
AB <- read_csv("https://raw.githubusercontent.com/mshin77/2022ksse/main/data/ABAB.csv", show_col_types = FALSE)
AB$Case <- paste0("학생 ", AB$Case, sep = "")
AB.plot <- AB %>%
ggplot(aes(Session, Outcome)) +
geom_line(data = subset(AB, AB$Phase == "Baseline1"), aes(linetype='1'), linewidth = 0.5) +
geom_line(data = subset(AB, AB$Phase == "Baseline1.Predict"), aes(linetype='2'), linewidth = 0.5) +
geom_line(data = subset(AB, AB$Phase == "Intervention1"), aes(linetype='1'), linewidth = 0.5) +
geom_line(data = subset(AB, AB$Phase == "Intervention1.Predict"), aes(linetype='2'), linewidth = 0.5) +
geom_line(data = subset(AB, AB$Phase == "Baseline2"), aes(linetype='1'), linewidth = 0.5) +
geom_line(data = subset(AB, AB$Phase == "Intervention2"), aes(linetype='1'), linewidth = 0.5) +
geom_point(size = 2.5) +
theme_minimal(base_size = 13) +
theme(
plot.title = element_text(face = "bold", size = 15),
legend.position ="top",
panel.grid.major = element_line(colour = "grey95", linewidth = 0.2),
panel.grid.minor = element_blank(),
legend.text = element_text(size = 13),
legend.title = element_text(size = 13),
legend.title.align = 0.5,
strip.text.x = element_text(color = "#3B3B3B", size = 13),
axis.text.x = element_text(size = 13, color = "#3B3B3B"),
axis.text.y = element_text(size = 13, color = "#3B3B3B"),
axis.title = element_text(face = "bold", size = 13, color = "#3B3B3B")
) +
labs(
x = "회기",
y = "바람직한 행동(%)"
) +
guides(linetype="none") +
geom_vline(aes(xintercept = 3.5), linetype = "longdash", linewidth = 0.3, color = "grey10") +
geom_vline(aes(xintercept = 8.5), linetype = "longdash", linewidth = 0.3, color = "grey10") +
geom_vline(aes(xintercept = 12.5), linetype = "longdash", linewidth = 0.3, color = "grey10") +
annotate(geom = "text", x = 2, y = 95, label = "기초선", color = "#0000FF", fontface = 'bold', Size = 5.5) +
annotate(geom = "text", x = 6, y = 95, label = "중재", color = "#0000FF", fontface = 'bold', Size = 5.5) +
annotate(geom = "text", x = 10.5, y = 95, label = "기초선", color = "#0000FF", fontface = 'bold', Size = 5.5) +
annotate(geom = "text", x = 15, y = 95, label = "중재", color = "#0000FF", fontface = 'bold', Size = 5.5) +
annotate(geom = "text", x = 6, y = 25, label = "예측하기", color = 'red', fontface = 'bold', size = 5.5) +
annotate(geom = "text", x = 10.5, y = 5, label = "검증하기", color = 'red', fontface = 'bold', size = 5.5) +
annotate(geom = "text", x = 15, y = 75, label = "재현하기", color = 'red', fontface = 'bold', size = 5.5) +
annotate("rect", xmin = 3.8, xmax = 8.3, ymin = 0, ymax = 20, alpha = .2) +
annotate("rect", xmin = 8.8, xmax = 12.3, ymin = 60, ymax = 90, alpha = .2)
AB.plot %>% ggplotly() %>% layout(dragmode = "select", height=400)
```
------------------------------------------------------------------------
## `왜 종단 자료인가?`
::: columns
::: {.column width="60%"}
- 개인의 행동을 시간에 따라 반복적으로 측정
- 조각별 성장모형을 통하여 구간 간의 행동 변화를 측정
- *t* 시점의 관측치는 이전 시점의 관측치와 관련있음 (자기상관계수)
- 패널조사 등의 종단 연구와 다르게 집중적이고 빈번하게 데이터를 측정
- 반복측정에서 가까운 시점 간의 상관계수가 먼 시점 간의 상관계수보다
높음
:::
::: {.column width="40%"}
- 개인 간 변화(시간에 따라 변하지 않는 개별 특성)와 개인 내
변화(시간에 따라 변하는 변수)를 동시에 측정
[[(Hamaker외,
2021)](https://ellenhamaker.github.io/DSEM-book-chapter/MLM1to6.html#Multilevel_Model_1)]{style="font-size: 0.86em"}
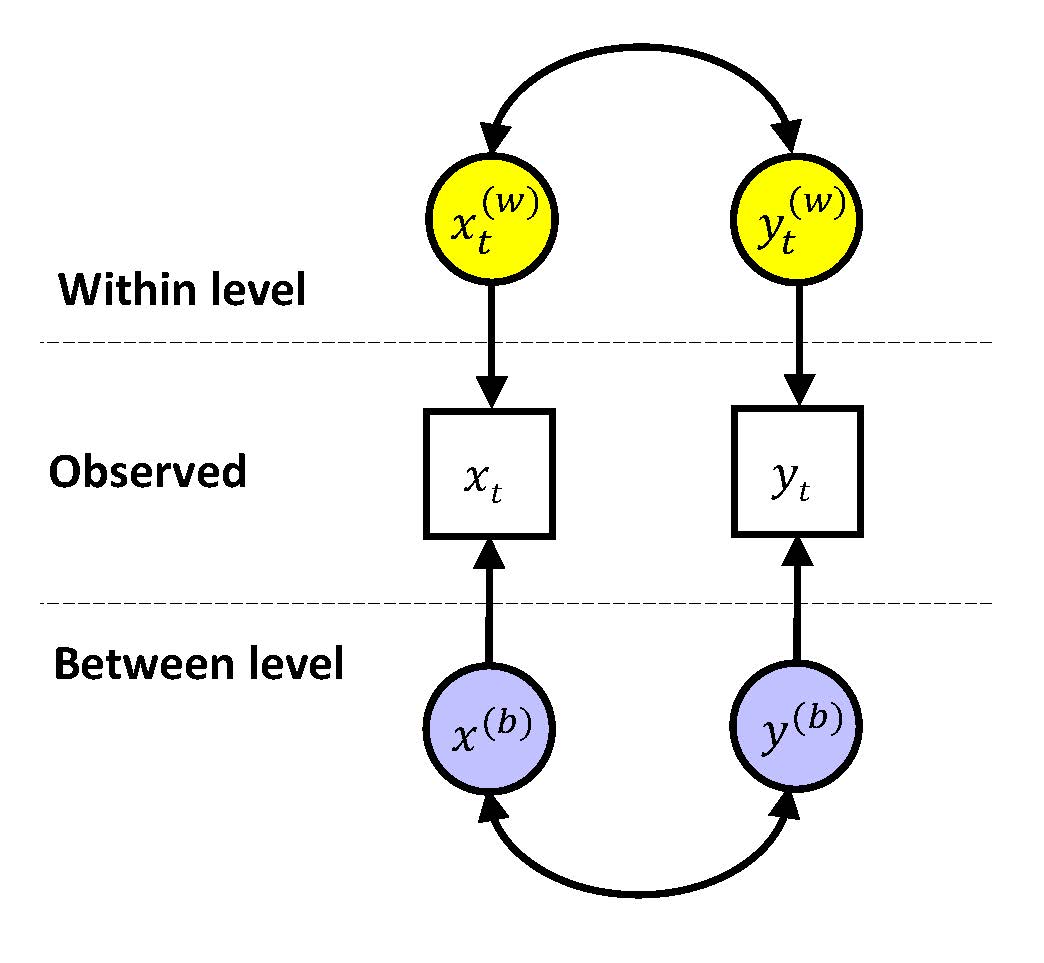{height="400"}
:::
:::
------------------------------------------------------------------------
## `다층 종단 자료 구조 및 코딩`
```{r}
Data1 <- read_csv("https://raw.githubusercontent.com/mshin77/2022ksse/main/data/Marsh.Cooke.csv", show_col_types = FALSE)
Data1_td <- Data1 %>%
kbl(align = "c") %>%
kable_styling(
bootstrap_options = c("striped","hover","condensed"),
full_width = F,
font_size = 16,
fixed_thead = T
) %>%
scroll_box(
height = "550px"
)
Data1_td
```
------------------------------------------------------------------------
## `대상자간 중다기초선 설계 그래프`
::: panel-tabset
## 그래프
```{r}
Data1$case <- paste0("학생 ", Data1$case, sep = "")
B1_v <- if(!is.null(Data1$Baseline)) {
Data1 %>%
filter(Baseline == 1) %>%
group_by(case) %>%
mutate(min_B1 = min(session)) %>%
mutate(max_B1 = max(session))
}
T1_v <- if(!is.null(Data1$Intervention)) {
Data1 %>%
filter(Intervention == 1) %>%
group_by(case) %>%
mutate(min_T1 = min(session)) %>%
mutate(max_T1 = max(session))
}
sced.plot <- Data1 %>%
ggplot(aes(session, outcome, color = phase, shape = phase)) +
facet_wrap(~ case, ncol = 1) +
geom_line(data = Data1 %>% filter(phase %in% c("Baseline", "Intervention")),
aes(group = phase), linewidth = 0.5) +
geom_point(size = 2.5) +
theme_minimal(base_size = 13) +
theme(
plot.title = element_text(face = "bold", size = 15),
legend.position ="top",
panel.grid.major = element_line(colour = "grey90", linewidth = 0.2),
panel.grid.minor = element_blank(),
legend.text = element_text(size = 13),
legend.title = element_text(size = 13),
legend.title.align = 0.5,
strip.text.x = element_text(color = "#3B3B3B", size = 13),
axis.text.x = element_text(size = 13, color = "#3B3B3B"),
axis.text.y = element_text(size = 13, color = "#3B3B3B"),
axis.title = element_text(face = "bold", size = 13, color = "#3B3B3B")
) +
labs(
x = "회기",
y = "정반응율(%)",
title = "Marsh & Cooke (1996)"
) +
guides(shape="none") +
guides(color = guide_legend(title = "Phase"), shape = guide_legend(title="Phase")) +
scale_shape_manual(values = 0:10) +
geom_vline(data = B1_v, aes(xintercept = B1_v$max_B1 + 0.5),
linetype = "longdash", linewidth = 0.3, color = "grey10") +
geom_vline(data = T1_v, aes(xintercept = T1_v$max_T1 + 0.5),
linetype = "longdash", linewidth = 0.3, color = "grey10")
sced.plot %>% ggplotly()
```
## `구간 별 선형회귀선`
```{r}
sced.plot <- sced.plot + stat_smooth(method = "lm", se = FALSE, color = "#3B3B3B", size = 0.5, alpha = 1, linetype="dashed")
sced.plot %>% ggplotly()
```
:::
------------------------------------------------------------------------
## `3수준 다층 모형`
- 단일대상 실험설계 데이터만 포함하여 한 단계로 메타분석 실시.
- 연구질문 1 "장애학생들을 위한 가상조작물을 활용한 수학 중재는 어떠한
`즉각적인 중재 효과` 및 중재 구간에서의 `변화 추세`를 보였는가?"
- 연구질문 2 "`장애학생` 및 `연구 수준의 특성`에 따라 즉각적인 중재
효과 및 중재 구간에서의 변화는 어떻게 달라지는가?
[Shin, M., Park, J., Grimes, R., & Bryant, D. P. (2021). Effects of
using virtual manipulatives for students with disabilities: Three-level
multilevel modeling for single-case data. *Exceptional Children, 87*(4),
418--437.]{style="font-size: 0.86em"}
[`r fontawesome::fa("code", "#777B7E")`](https://osf.io/wvtxg/files/osfstorage)
------------------------------------------------------------------------
- [1수준 ($i$ 반복 측정 자료)]{style="background-color: #FFB7B2"}
$$
\begin{aligned}
Y_{i j k}=& \beta_{0 j k}+\beta_{1 j k} \text { Intervention }_{i j k} \\
&+\beta_{2 j k} \text { Time }_{i j k}^{\prime} \times \text { Intervention }_{i j k}+e_{i j k}\\
& \text { with } e_{i j k} \sim N\left(0, \Sigma_e\right)
\end{aligned}
$$ [$Y_{i j k}$]{style="background-color: #FFB7B2"} $k$번 연구에서
$j$번째 학생$(j=1,2, \ldots J)$을 대상으로 $i$번째 측정된
$(I=0,1, \ldots I)$ 반복 측정된 수학 정확성(%) <br>
[${Time }_{i j k}^{\prime}$]{style="background-color: #FFB7B2"} 중재 첫
회기로 중심화 <br>
[${Intervention }_{i j k}$]{style="background-color: #FFB7B2"} 기초선 0,
중재구간 1 <br> [$\beta_{0 j k}$]{style="background-color: #FFB7B2"}
기초선 평균 수준(절편) <br>
[$\beta_{1 j k}$]{style="background-color: #FFB7B2"} 즉각적인 중재 효과
<br> [$\beta_{2 j k}$]{style="background-color: #FFB7B2"} 중재
구간에서의 변화 추세 <br>
[$e_{i j k}$]{style="background-color: #FFB7B2"} 잔차, 공분산 구조를
가지고 있음 <br> [$\Sigma_e$]{style="background-color: #FFB7B2"} 서로
독립적일 수도 있고, 자기상관관계를 가질 수 있음
------------------------------------------------------------------------
- [2수준 ($j$ 학생)]{style="background-color: #B5EAD7"}
$$
\left\{\begin{array}{l}
\beta_{0 j k}=\theta_{00 k}+u_{0 j k} \\
\beta_{1 j k}=\theta_{10 k}+u_{1 j k} \\
\beta_{2 j k}=\theta_{20 k}+u_{2 j k}
\end{array} \quad \text { with }\left[\begin{array}{l}
u_{0 j k} \\
u_{1 j k} \\
u_{2 j k}
\end{array}\right] \sim N\left(0, \Sigma_u\right)\right.
$$ [$\theta_{00 k}$]{style="background-color: #B5EAD7"} $k$번 연구의
평균 기초선 수준 <br>
[$\theta_{10 k}$]{style="background-color: #B5EAD7"} $k$번 연구의
즉각적인 중재 효과 <br>
[$\theta_{20 k}$]{style="background-color: #B5EAD7"} $k$번 연구의 중재
구간에서의 변화 추세 <br>
[$u_{0 j k}, u_{1 j k}, u_{2 j k}$]{style="background-color: #B5EAD7"}
2수준 공분산 행렬 <br> [$\Sigma_u$]{style="background-color: #B5EAD7"}
공분산은 0인 대각 행렬 또는 비구조적인 행렬 등
------------------------------------------------------------------------
- [3수준 ($k$ 연구)]{style="background-color: #C7CEEA"}
$$
\left\{\begin{array}{l}
\theta_{00 k}=\gamma_{000}+v_{00 k} \\
\theta_{10 k}=\gamma_{100}+v_{10 k} \\
\theta_{20 k}=\gamma_{200}+v_{20 k}
\end{array} \text { with }\left[\begin{array}{c}
v_{00 k} \\
v_{10 k} \\
v_{20 k}
\end{array}\right] \sim N\left(0, \Sigma_v\right)\right.
$$
[$\gamma_{000}$]{style="background-color: #C7CEEA"} 전체 연구 간 평균
기초선 수준 <br> [$\gamma_{100}$]{style="background-color: #C7CEEA"}
전체 연구 간 즉각적인 중재 효과 <br>
[$\gamma_{200}$]{style="background-color: #C7CEEA"} 전체 연구 간 중재
구간에서의 변화 추세 <br>
[$v_{00 k}, v_{10 k}, v_{20 k}$]{style="background-color: #C7CEEA"}
3수준 공분산 행렬 <br> [$\Sigma_v$]{style="background-color: #C7CEEA"}
공분산은 0인 대각 행렬 또는 비구조적인 행렬 등
------------------------------------------------------------------------
## `단일대상 실험설계 3수준 다층 모형`
::: panel-tabset
## Model.1
[`library(nlme)`](https://cran.r-project.org/web/packages/nlme){style="background-color: #f0f0f0"}
lme() 함수 <br> 조절 변수 포함하지 않음
```{r}
VM <- read_csv("https://raw.githubusercontent.com/mshin77/2022ksse/main/data/VM.csv")
library(nlme)
Model.1 <- lme(Outcome ~ 1 + Intervention + Intervention_Time, #고정 효과
random = ~ 1 + Intervention + Intervention_Time | Study/Case, #무선 효과
data = VM,
correlation = corAR1(form = ~ 1 | Study/Case/Intervention), #AR(1) 자기상관계수 모형
weights = varIdent(form = ~ 1 | Intervention), #개인 내 잔차 이질적 분산 고려
method = "REML",
na.action = "na.omit",
control = list(opt = "optim"))
```
<br>
## Model.1 결과
```{r}
intervals(Model.1)
```
<br>
## Model.2
조절 변수와 즉각적인 중재 효과 관계
```{r}
VM <- read_csv("https://raw.githubusercontent.com/mshin77/2022ksse/main/data/VM.csv")
Model.2 <- lme(Outcome ~ 1 + Intervention + Intervention_Time +
# case-level (student characteristics) moderators
Middle*Intervention + High*Intervention +
ID*Intervention + ASD*Intervention + EBD*Intervention + OHI*Intervention +
# study-level (intervention features) moderators
Devise.use*Intervention + Devise.use.instruct*Intervention +
Teacher.guided*Intervention + Teacher.led*Intervention +
Commercial*Intervention +
Computer*Intervention +
Single.represent*Intervention + Tutorial*Intervention + Game*Intervention +
Area*Intervention + Linear*Intervention + Base.ten*Intervention + Algebra*Intervention + Multi.model*Intervention,
random = ~ 1 + Intervention + Intervention_Time | Study/Case,
data = VM,
correlation = corAR1(form = ~ 1 | Study/Case/Intervention),
weights = varIdent(form = ~ 1 | Intervention),
method = "REML",
na.action = "na.omit",
control = list(opt = "optim"))
```
<br> <br> <br>
## Model.3
조절 변수와 중재구간에서의 중재 변화 추세와의 관계
```{r}
VM <- read_csv("https://raw.githubusercontent.com/mshin77/2022ksse/main/data/VM.csv")
Model.3 <- lme(Outcome ~ 1 + Intervention + Intervention_Time +
# case-level (student characteristics) moderators
Middle*Intervention_Time + High*Intervention_Time +
ID*Intervention_Time + ASD*Intervention_Time + EBD*Intervention_Time + OHI*Intervention_Time +
# study-level (intervention features) moderators
Devise.use*Intervention_Time + Devise.use.instruct*Intervention_Time +
Teacher.guided*Intervention_Time + Teacher.led*Intervention_Time +
Commercial*Intervention_Time +
Computer*Intervention_Time +
Single.represent*Intervention_Time + Tutorial*Intervention_Time + Game*Intervention_Time +
Area*Intervention_Time + Linear*Intervention_Time + Base.ten*Intervention_Time + Algebra*Intervention_Time + Multi.model*Intervention_Time,
random = ~ 1 + Intervention + Intervention_Time | Study/Case,
data = VM,
correlation = corAR1(form = ~ 1 | Study/Case/Intervention),
weights = varIdent(form = ~ 1 | Intervention),
method = "REML",
na.action = "na.omit",
control = list(opt = "optim"))
```
<br> <br> <br>
:::
------------------------------------------------------------------------
## `단일대상 실험설계 2수준 다층 모형`
{width="1000"}
::: panel-tabset
## 1단계
- 단일대상 데이터 원점수 혹은 표준화 변환 결과 변수로 2수준 다층 모형
실행
- [`library(nlme)`](https://cran.r-project.org/web/packages/nlme){style="background-color: #f0f0f0"}
lme() 함수
- [`library(lme4)`](https://cran.r-project.org/web/packages/lme4){style="background-color: #f0f0f0"}
lmer() 함수
- [`library(scdhlm)`](https://cran.r-project.org/web/packages/scdhlm/index.html){style="background-color: #f0f0f0"}
g_mlm() 함수. 연구설계 간 비교 가능한(design-comparable) Hedges' g
효과크기로 변환. 적은 표본 수를 위한 보정
## 2단계 (방법 1)
- 단일대상과 집단 연구의 효과크기로 함께 메타분석 실행\
- [`library(clubSandwich)`](https://cran.r-project.org/web/packages/clubSandwich/index.html){style="background-color: #f0f0f0"}
2개 이상의 종속변인 효과크기 간 상관관계. robust variance estimation
(RVE) 표준오차
- [`library(metafor)`](https://cran.r-project.org/web/packages/metafor/index.html){style="background-color: #f0f0f0"}
연구 수준의 조절 변수 고려
- [Kim, S. A., Bryant, D. P., Bryant, B. R., Shin, M., & Ok, M. W.
(2022). A multilevel meta-analysis of whole number computation
interventions for students with learning disabilities. *Remedial and
Special Education*. Advance online
publication.]{style="font-size: 0.86em"}
[`r fontawesome::fa("code", "#777B7E")`](https://osf.io/wuk5p/files/osfstorage)
## 2단계 (방법 2)
- [`library(robumeta)`](https://cran.r-project.org/web/packages/robumeta/index.html){style="background-color: #f0f0f0"}
robu() 함수
- 사례 단일대상 연구만 포함하여 2수준 다층 분석 후 메타분석
- [Shin, M., Bryant, D. P., Powell, S. R., Jung, P. G., Ok, M. W., &
Hou, F. (2021). A meta-analysis of single-case research on
word-problem instruction for students with learning disabilities.
*Remedial and Special Education, 42*(6),
398-411.]{style="font-size: 0.86em"}
[`r fontawesome::fa("code", "#777B7E")`](https://osf.io/xr58s/files/osfstorage)
:::
------------------------------------------------------------------------
## `오픈 소스 기반 무료 웹 애플리케이션`
::: columns
::: {.column width="45%"}
- **`MultiSCED`** http://34.251.13.245/MultiSCED
- [`library(lme4)`](https://cran.r-project.org/web/packages/lme4){style="background-color: #f0f0f0"}
lmer() 함수
- 예시 데이터 있음
- 1, 2, 3수준 모형 분석
- 원점수(결과 변수)를 표준화된 점수로 전환 가능
:::
::: {.column width="55%"}
- **`scdhlm`** https://jepusto.shinyapps.io/scdhlm
- [`library(nlme)`](https://cran.r-project.org/web/packages/nlme){style="background-color: #f0f0f0"}
lme() 함수
- 예시 데이터 있음
- 2수준 모형 분석
- 다양한 단일대상 실험설계 분석 가능
- 최근 자기상관계수 및 잔차 분산 이질성 모형 추가
- R 패키지 있음
:::
:::
------------------------------------------------------------------------
## `논의 및 추후 연구에 대한 시사점`
- 접근성이 쉬운 데이터 분석 웹 애플리케이션이 개발되고 공유되고 있음
<br>
- 단일대상 실험설계 데이터 및 그래프 시각화 웹 애플리케이션 소스 공유
<br>
- 시각적 분석 및 통계적인 접근법이 함께 고려되어야 함 <br>
- 데이터 분석 및 재현 연구를 통하여 연구 방법들이 지속적으로
검증되어야 함 <br>
- 오픈 소스 기반의 접근이 쉽고, 투명한 연구들이 협력적으로 이루어져야
함 <br>
{height="350"}