Setting hue in pairplot on a string column with only 1 item in a category throws exception: ValueError: dataset input should have multiple elements.
#1627
Comments
|
Would you be able to share either the dataset itself/the relevant code you've been using to get this error, or create a fake dataset and write a snippet that also reproduces the error? As of right now, my best guess is that one of the values in the "topic" column of your dataset only appears once. When the data then get subset by this column, you end up with an array that has 1 value, which is triggering the |
|
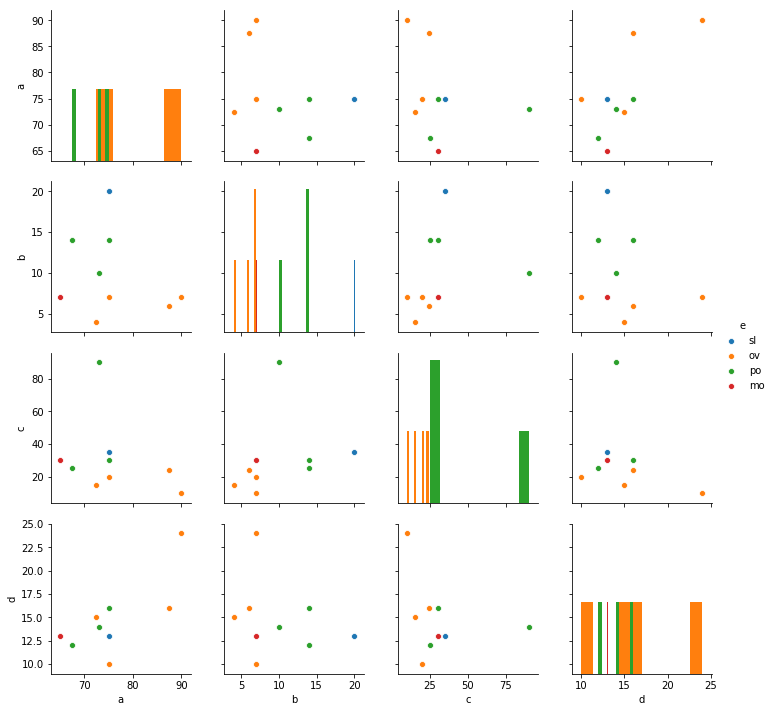
Yes, that's the problem that you have just described. It should still plot nonetheless, even if one category appears once only. Here is a full sample: Content of ce.csv:
|
I wouldn't agree with this statement. The issue here isn't with seaborn, the issue is with the underlying math. On the diagonal, the plot is attempting to draw a kernel density estimate (kde plot) to do this, it needs to calculate the kde- which is why the error trace back is from Since we can't plot a kde on the diagonal, you can tell pairplot to draw a histogram on the diagonal.
If I don't specify the |
I must have misread your argument because surely you aren't saying that a plotting library should throw a random exception from a third party library because it was asked to color in dots? You can throw a warning, saying that the diagram diagonal isn't using colours, because of whatever reason. You can throw an error, saying that 'kde' diagonal requires at least two elements in each group (for whatever reason), and say that you can use the 'hist' parameter to draw a histogram instead of kde. But what you cannot do is to let a third party library throw an arbitrary exception because seaborn didn't check the required parameters the library needs to do its thing.
Just like we cannot blame calling toString() on a null value, or blame sqrt() when passing in a negative value, we cannot blame a third party library when we are feeding in incorrect parameters. EDIT: With the .pairplot API the user never actually asked for a kde plot, only for a pair-plot, and seaborn decided to use a kde plot; it's difficult to reason that it is a user error either. The data can be plotted and colored in, so overall it would be hard to conclude that it is not a bug. |
100% agree with you here. I do agree that the error could be handled earlier, and be more informative for the user. What I was attempting to convey is that it shouldn't be silently and not draw a specific plot. I assumed this is what you meant by
However it seems I misinterpreted what you meant by that, but I think we're both on the same page here now. The pairplot does default to "auto", which simply means "if hue is None, plot a hist on the diagonal, else plot a kde". Maybe another check can go into this determination to check if any of the hue groupings have 1 datapoint? |
|
'auto' implies that it would do something meaningful so I would add an extra check, fall back to a plottable diagonal from kde (if / when necessary), and throw a warning. |
|
Duplicate of #1502 |
|
That was an odd move to close it down after discussing the problem and the solution @mwaskom |
|
Nevertheless, it’s the same issue, so there don’t need to be two separate threads about it. |
|
If it really is the same, why did it take days and half a dozen of comments to identify the problem and why is there a proposed solution here but not on the other bug, and why is the other bug talking about "LinAlgError: singular matrix" and this but about "ValueError: If it is the same, why people on the other bug claim that it works on Python 2 but not Python 3, indicating a totally unrelated issue to this? It might be the same in your eyes but I doubt anyone else would readily say this thread is talking about the same problem and same solutions as the other thread - because it does not. EDIT: just because two issues may have the same code fix, it doesn't mean they are the same, obviously. |
|
What are you trying to accomplish here, exactly? |
|
I thought it would be obvious: keep the issue open until someone wants to fix it (create a PR) or simply let other users discover the active issue by the keywords they would see and let them use them workaround @CRiddler used. |
|
Well, you've failed in that aim, but succeeded in irritating me to the point that I've moved this issue to the bottom of the stack of things I choose to spend time working on. Congrats! |
seaborn 0.9.0, installed via pip.
I have 10 rows, trying to create pairplot. The plot works fine until I set the hue to a string (object) column that has 4 categories with the breakdown of (4, 3, 2, 1).
Stack trace below:
The text was updated successfully, but these errors were encountered: