Skip to content
New issue

Have a question about this project? Sign up for a free GitHub account to open an issue and contact its maintainers and the community.

By clicking “Sign up for GitHub”, you agree to our terms of service and privacy statement. We’ll occasionally send you account related emails.

Already on GitHub? Sign in to your account

Pointplot option for hue_offset function #2528

Closed
MarHerf opened this issue Mar 28, 2021 · 8 comments
Closed

Pointplot option for hue_offset function #2528

MarHerf opened this issue Mar 28, 2021 · 8 comments

Comments

@MarHerf
Copy link

MarHerf commented Mar 28, 2021

For the _PointPlotter class it would be helpful to add the option to use the hue_offset function of _CategoricalPlotter instead of the custom hue_offset function. This way it would be easier to combine the pointplot with other plots.

@mwaskom
Copy link
Owner

mwaskom commented Mar 28, 2021

I'm afraid I don't understand the suggestion here. An example of what you're trying to do would help, along with specific references to code, etc...

@MarHerf
Copy link
Author

MarHerf commented Mar 28, 2021

I'm sorry for being so unclear.
I want to plot a similar plot as this example from the gallery:
https://seaborn.pydata.org/examples/jitter_stripplot.html
To my understanding the pointplot can only be vertically aligned with the swarmplot by trying different values for dodge. As far as I can see this is the case because the pointplot uses a different function then swarmplot to calculate the offset between the hue-levels.
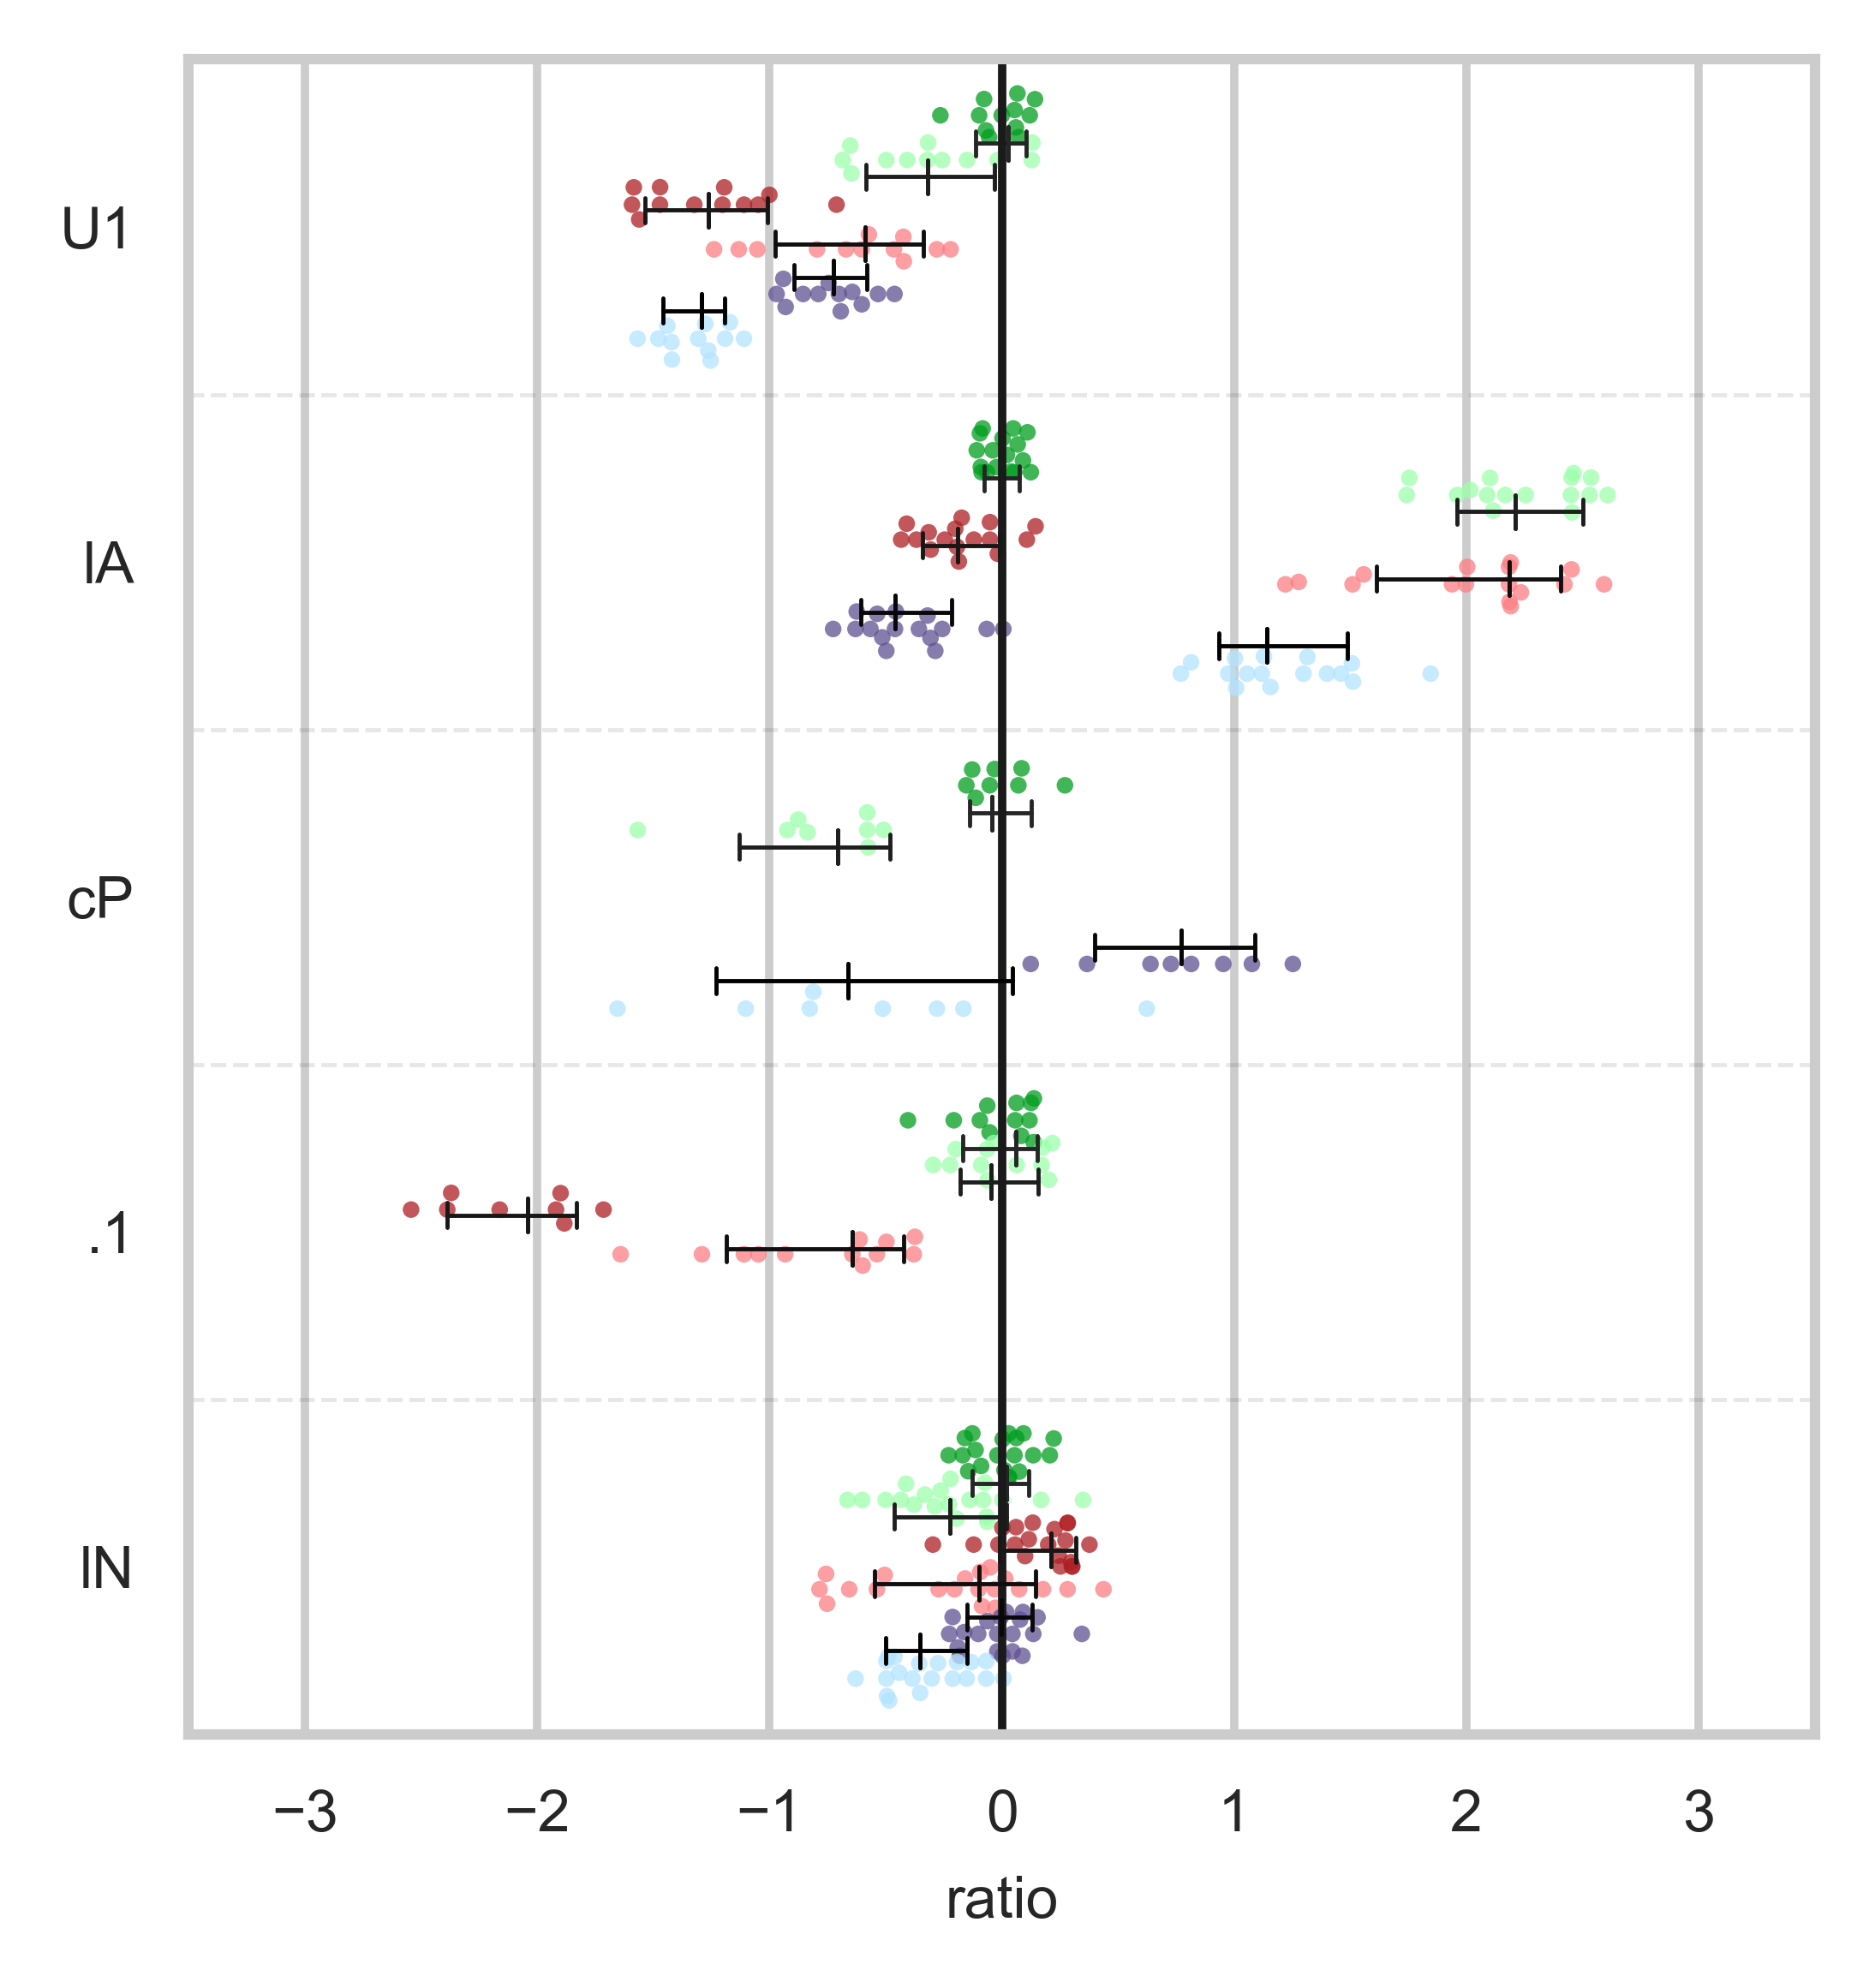
I attached two plots I generated using swarmplot and pointplot: The first image is the result of setting dodge in pointplot to 0.5 similar to the example from the gallery.
The second image results from commenting out the hue_offset function in _PointPlotter. To my understanding this leads to usage of the hue_offset function of _CategoricalPlotter and to a perfect alignment of swarmplot and pointplot.
Therefore I would suggest to add the option to use the second function to pointplot to make it easier to overlay on another categorical plot.
I hope this is clearer...

The hue_offset function from _PointlPlotter in categorical.py line 1688:

     def hue_offsets(self):
      """Offsets relative to the center position for each hue level."""
       if self.dodge:

            offset = np.linspace(0, self.dodge, len(self.hue_names))
            offset -= offset.mean()
        else:
            offset = np.zeros(len(self.hue_names))
        return offset

test_scatter2
The hue_offset function from _CategoricalPlotter in categorical.py line 327:

    def hue_offsets(self):
        """A list of center positions for plots when hue nesting is used."""
        n_levels = len(self.hue_names)
        if self.dodge:
            each_width = self.width / n_levels
            offsets = np.linspace(0, self.width - each_width, n_levels)
            offsets -= offsets.mean()
        else:
            offsets = np.zeros(n_levels)

        return offsets

test_scatter

@mwaskom
Copy link
Owner

mwaskom commented Mar 28, 2021

I think that what you want to accomplish can be achieved by setting dodge=.8 - .8 / len(hue_order).

This is non-obvious and perhaps annoying, but I don't think adding another parameter is the right answer.

@jhncls
Copy link

jhncls commented Mar 29, 2021

Wouldn't it make sense if the default dodge would be the same for all types of plots? Or do things look bad with low or high number of hue categories? Is this balancing between easy superimposing and good-looking defaults? (Of course, changing the default behavior might disturb old code.)

@MarHerf
Copy link
Author

MarHerf commented Mar 29, 2021

Your solution is very easy but I agree that it really is not obvious. Maybe instead of adding an option you could add the calculation to the documentation or to the example from the gallery. I'm sure I was not the first person encountering this problem.
Apart of that I would also think that the same default dodge behavior for all plots would be more intuitive. But I also understand that does not really fit to the default purpose of pointplot.

@mwaskom
Copy link
Owner

mwaskom commented Mar 29, 2021

By "default dodge behavior" do you mean what happens when you do dodge=True? (Technically, the "default" dodge is False). The special-casing of True is different in pointplot because if you're not superimposing on a stripplot or similar, dodging with that magnitude makes the plot hard to interpret, especially with the default join=True; usually you want dodge to just nudge points out of each others way. But also just because the parameters were added to the functions at different times with not enough consideration of consistency.

Demonstrating this as an API example in pointplot seems good ... it actually is demonstrated in the example gallery but the calculation is not made explicit. Changing that is probably the lowest hanging fruit.

Another option would be to add an option to do something like dodge="full", but that would take some deliberation.

@MarHerf
Copy link
Author

MarHerf commented Mar 29, 2021

Yes, that's what I meant. As I wrote I understand the special purpose of dodge for the pointplot and it totally makes sense to me.
To me making the calculation in the API example explicit would be sufficient.
Adding a keyword option also would have been my second suggestion. Then the default hue_offset function of pointplot could be used when provided a numeric parameter. The stripplot/swarmplot with which the pointplot probably would be superimposed most also don't have an option to set width.
Adding this to _PointPlotter.init would be sufficient to implement this:

if dodge is 'full' and self.hue_names is not None:
    dodge=.8 -.8/len(self.hue_names)

@mwaskom
Copy link
Owner

mwaskom commented Jun 12, 2021

Closed with #2548

@mwaskom mwaskom closed this as completed Jun 12, 2021
Sign up for free to join this conversation on GitHub. Already have an account? Sign in to comment
Projects
None yet
Development

No branches or pull requests

3 participants