This repository will contain a series of scripts and notebooks to help people get acclimated to using Python for scientific publications.
Follow me at: @naveen.venkatesan
-
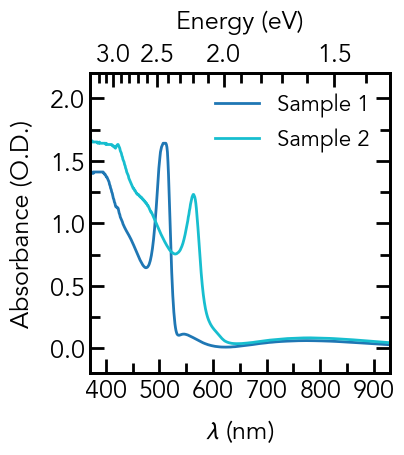
An Introduction to Making Scientific Publication Plots with Python
-
Visualizing Three-Dimensional Data - Heatmaps, Contours, and 3D Plots with Python
-
Intro to Dynamic Visualization with Python - Animations and Interactive Plots
-
Generate Easily Reproducible Scientific Figures with Pylustrator
-
Intro to Comparing and Analyzing Multiple Unevenly Spaced Time-Series Signals
Link to Article: https://towardsdatascience.com/an-introduction-to-making-scientific-publication-plots-with-python-ea19dfa7f51e
Notebook: python-plotting-intro.ipynb
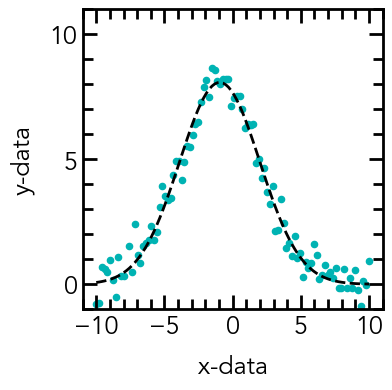
Link to Article: https://towardsdatascience.com/basic-curve-fitting-of-scientific-data-with-python-9592244a2509
Notebook: curve-fitting-tutorial.ipynb
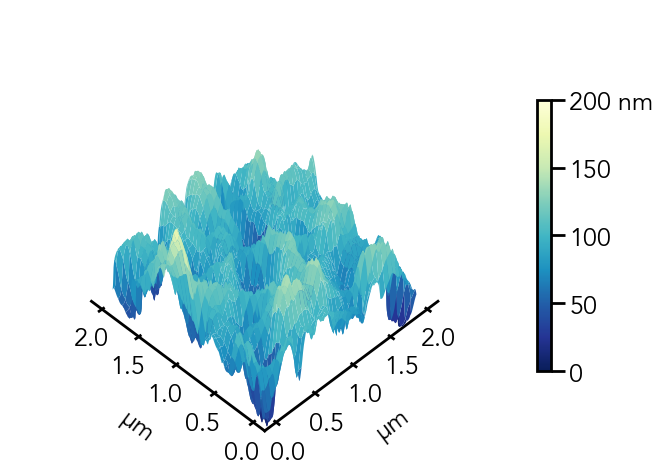
Link to Article: https://towardsdatascience.com/visualizing-three-dimensional-data-heatmaps-contours-and-3d-plots-with-python-bd718d1b42b4
Notebook: heatmaps.ipynb
Link to Article: https://towardsdatascience.com/intro-to-dynamic-visualization-with-python-animations-and-interactive-plots-f72a7fb69245
Notebook: animation.ipynb

Link to Article: https://towardsdatascience.com/a-guide-to-creating-and-using-your-own-matplotlib-style-30de6c60bac0
Style File: scientific.mplstyle
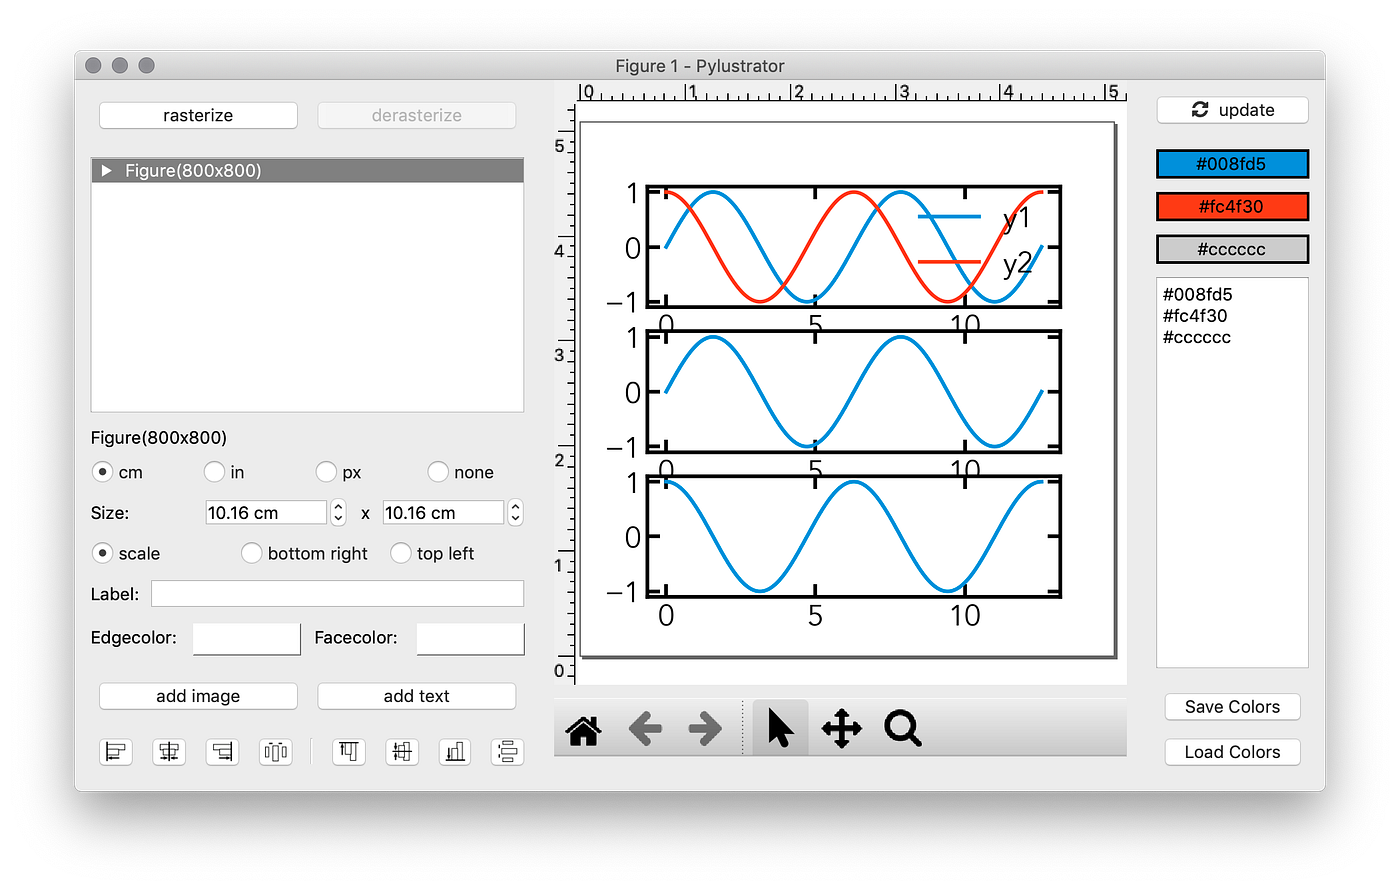
Link to Article: https://towardsdatascience.com/generate-easily-reproducible-scientific-figures-with-pylustrator-9426292e07a4
Python Script: plot.py

Link to Article: https://towardsdatascience.com/create-panel-figure-layouts-in-matplotlib-with-gridspec-7ec79c218df0
Notebook: gridspec.ipynb
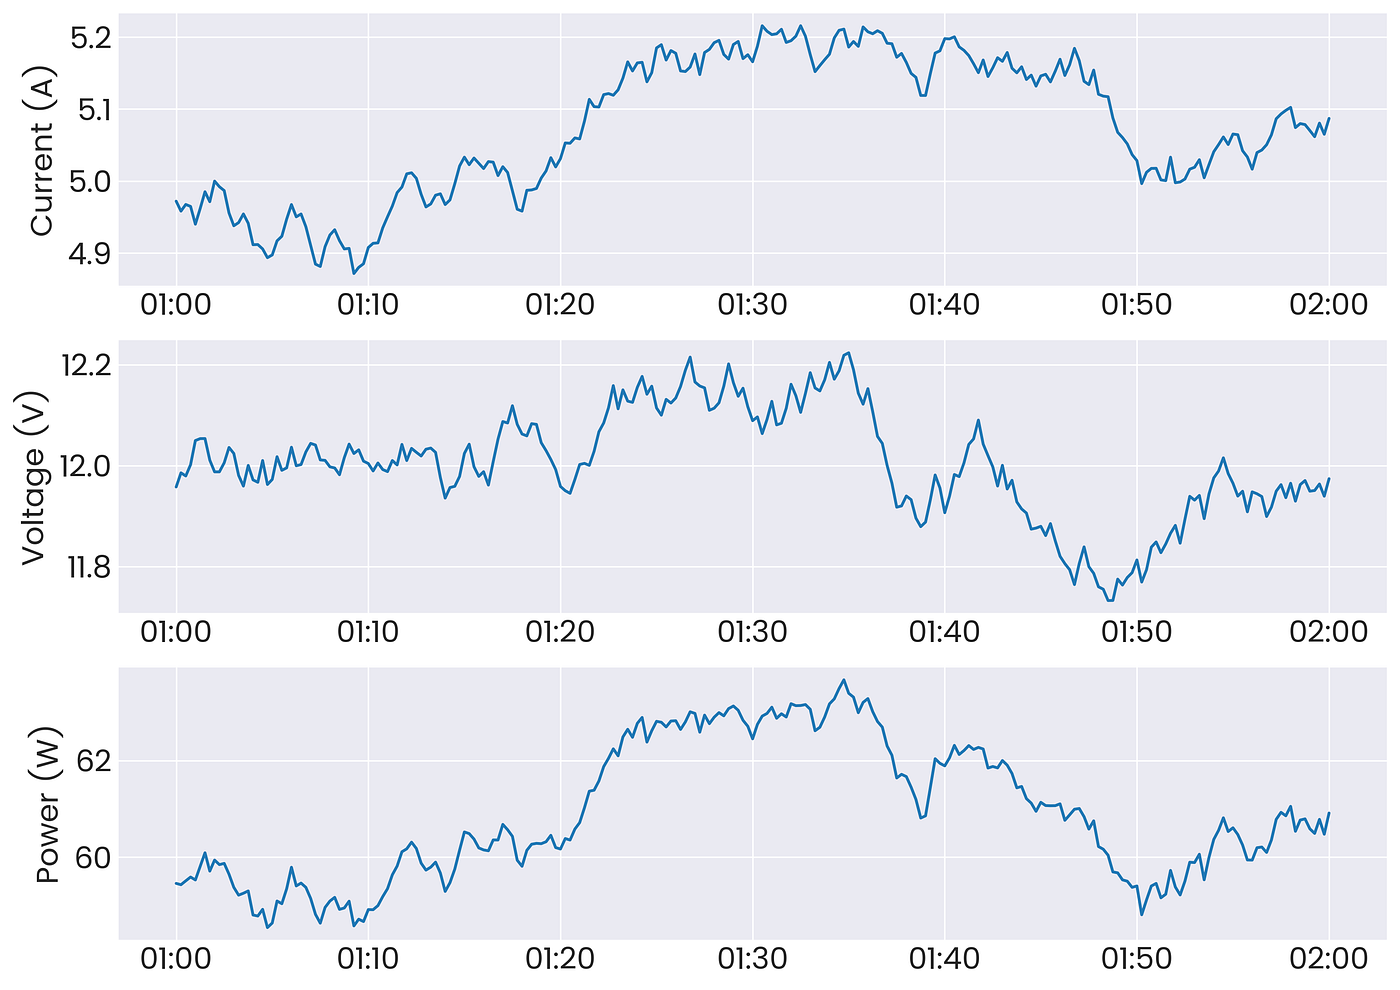
Link to Article: https://towardsdatascience.com/intro-to-comparing-and-analyzing-multiple-unevenly-spaced-time-series-signals-e46b2347972a#9512-73cf3e25e1a0
Notebook: time_series.ipynb

Link to Article: https://towardsdatascience.com/an-introduction-to-plotly-for-matplotlib-users-9f4f0d2113bc
Notebook: plotly.ipynb

Link to Article: https://towardsdatascience.com/creating-various-plot-types-and-subplots-with-plotly-bd727f808262
Notebook: plotly-charts.ipynb