Skip to content

open source business intelligence technologies and explore data using open source technologies like D3.js, DC.js, Nodejs and MongoDB.

License

Notifications You must be signed in to change notification settings

NavpreetSamra/Analytics-Dashboard


Folders and files

NameName
Last commit message
Last commit date

Latest commit


History

7 Commits


Repository files navigation

E-commerce Comparison with data visualization using d3.js, dc.js, node.js and mongodb

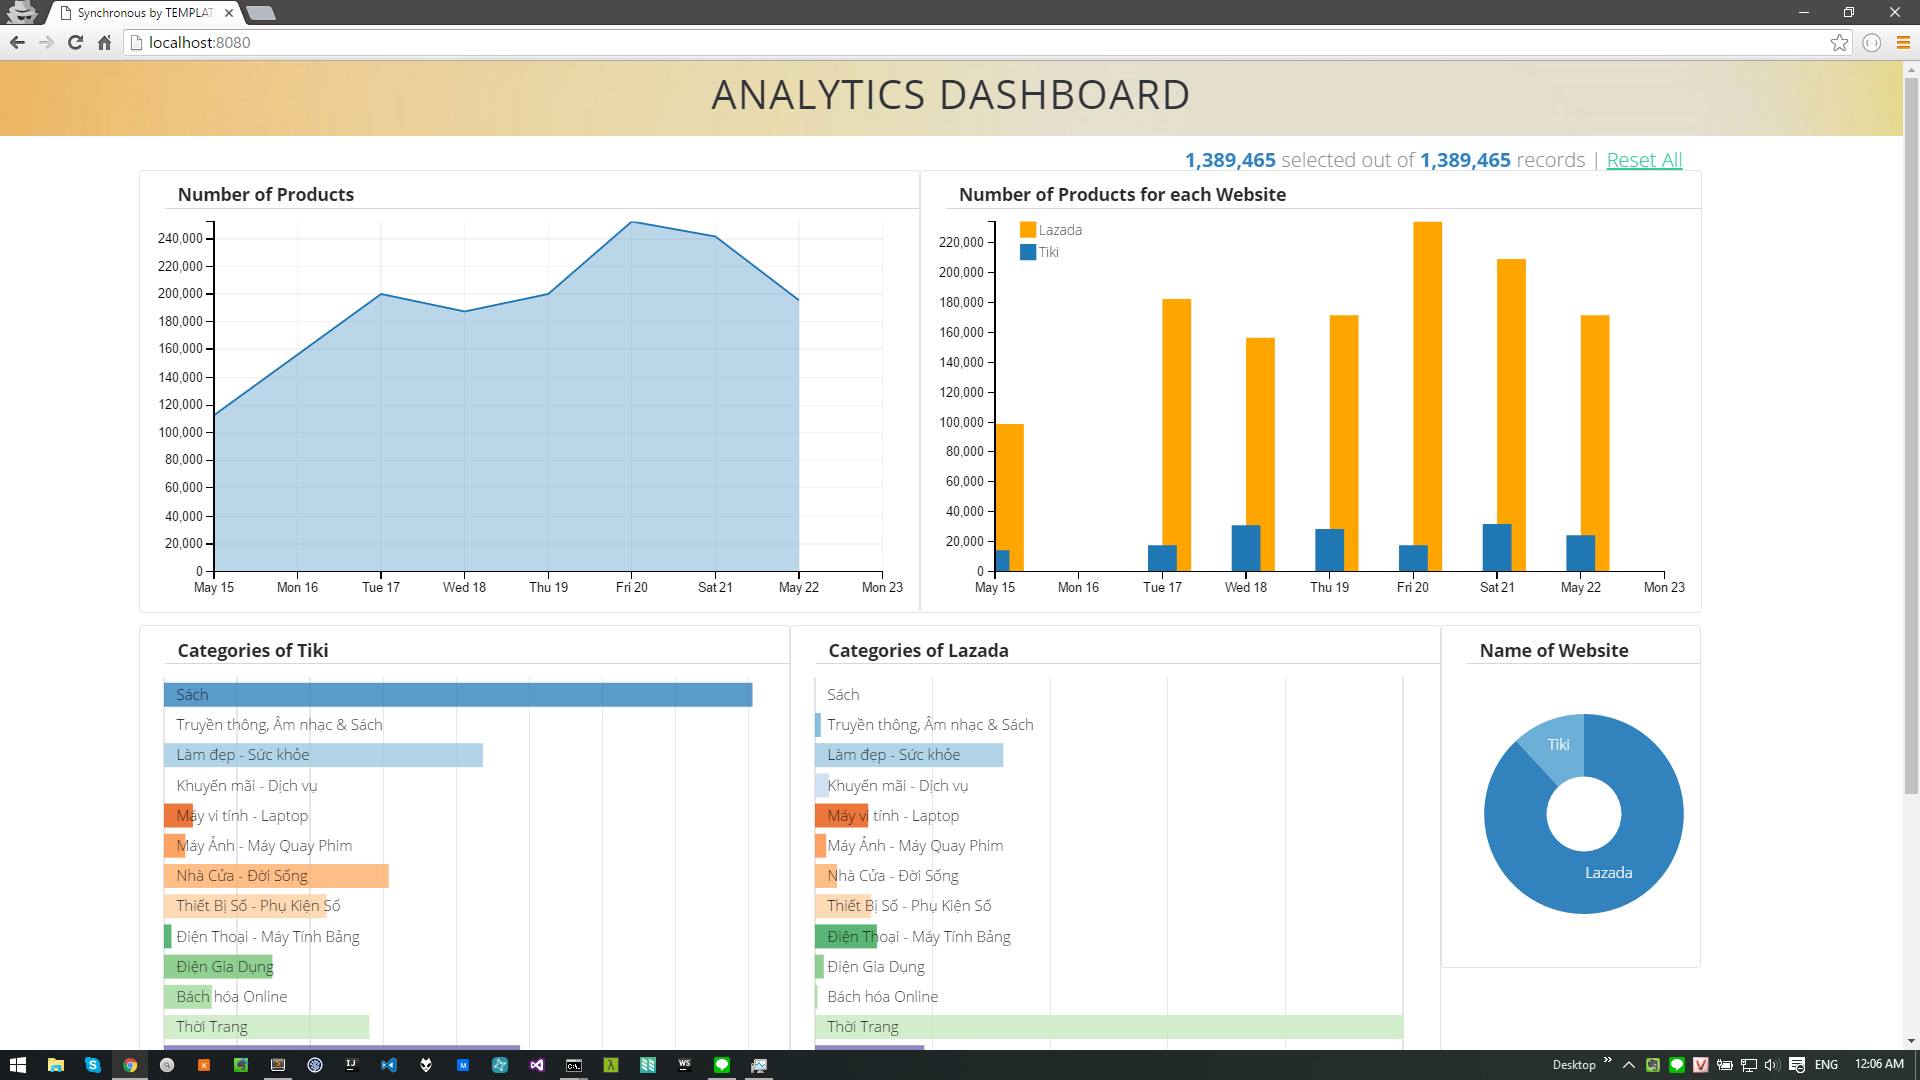
Simple demo site: HERE

Full screenshot

Required Components:
D3.js
Dc.js
Node.js
Crossfilter.js
Jquery
MongoDB

Steps for successful execution:

  1. Install MongoDB
  2. Insert the data into mongoDB as given in the blog
  3. Install Nodejs and NPM
  4. Navigate to the Analytics-Dashboard directory using command prompt and run npm install , this will install the dependencies
  5. Navigate to the Analytics-Dashboard directory using command prompt and run npm start
  6. In your browser go to localhost:8080

Feedback, issues, etc. are more than welcome!

Tutorial:

About

open source business intelligence technologies and explore data using open source technologies like D3.js, DC.js, Nodejs and MongoDB.

Resources

License

Stars

Watchers

Forks

Releases

No releases published

Packages

No packages published

Languages

  • JavaScript 86.4%
  • CSS 12.5%
  • HTML 1.1%