Skip to content
New issue

Have a question about this project? Sign up for a free GitHub account to open an issue and contact its maintainers and the community.

By clicking “Sign up for GitHub”, you agree to our terms of service and privacy statement. We’ll occasionally send you account related emails.

Already on GitHub? Sign in to your account

Forever stuck on "File change detected. Starting incremental compilation..." #10849

Closed
2 of 15 tasks
Hareloo opened this issue Jan 10, 2023 · 7 comments
Closed
2 of 15 tasks
Labels
needs triage This issue has not been looked into

Comments

@Hareloo
Copy link

Hareloo commented Jan 10, 2023

Is there an existing issue for this?

  • I have searched the existing issues

Current behavior

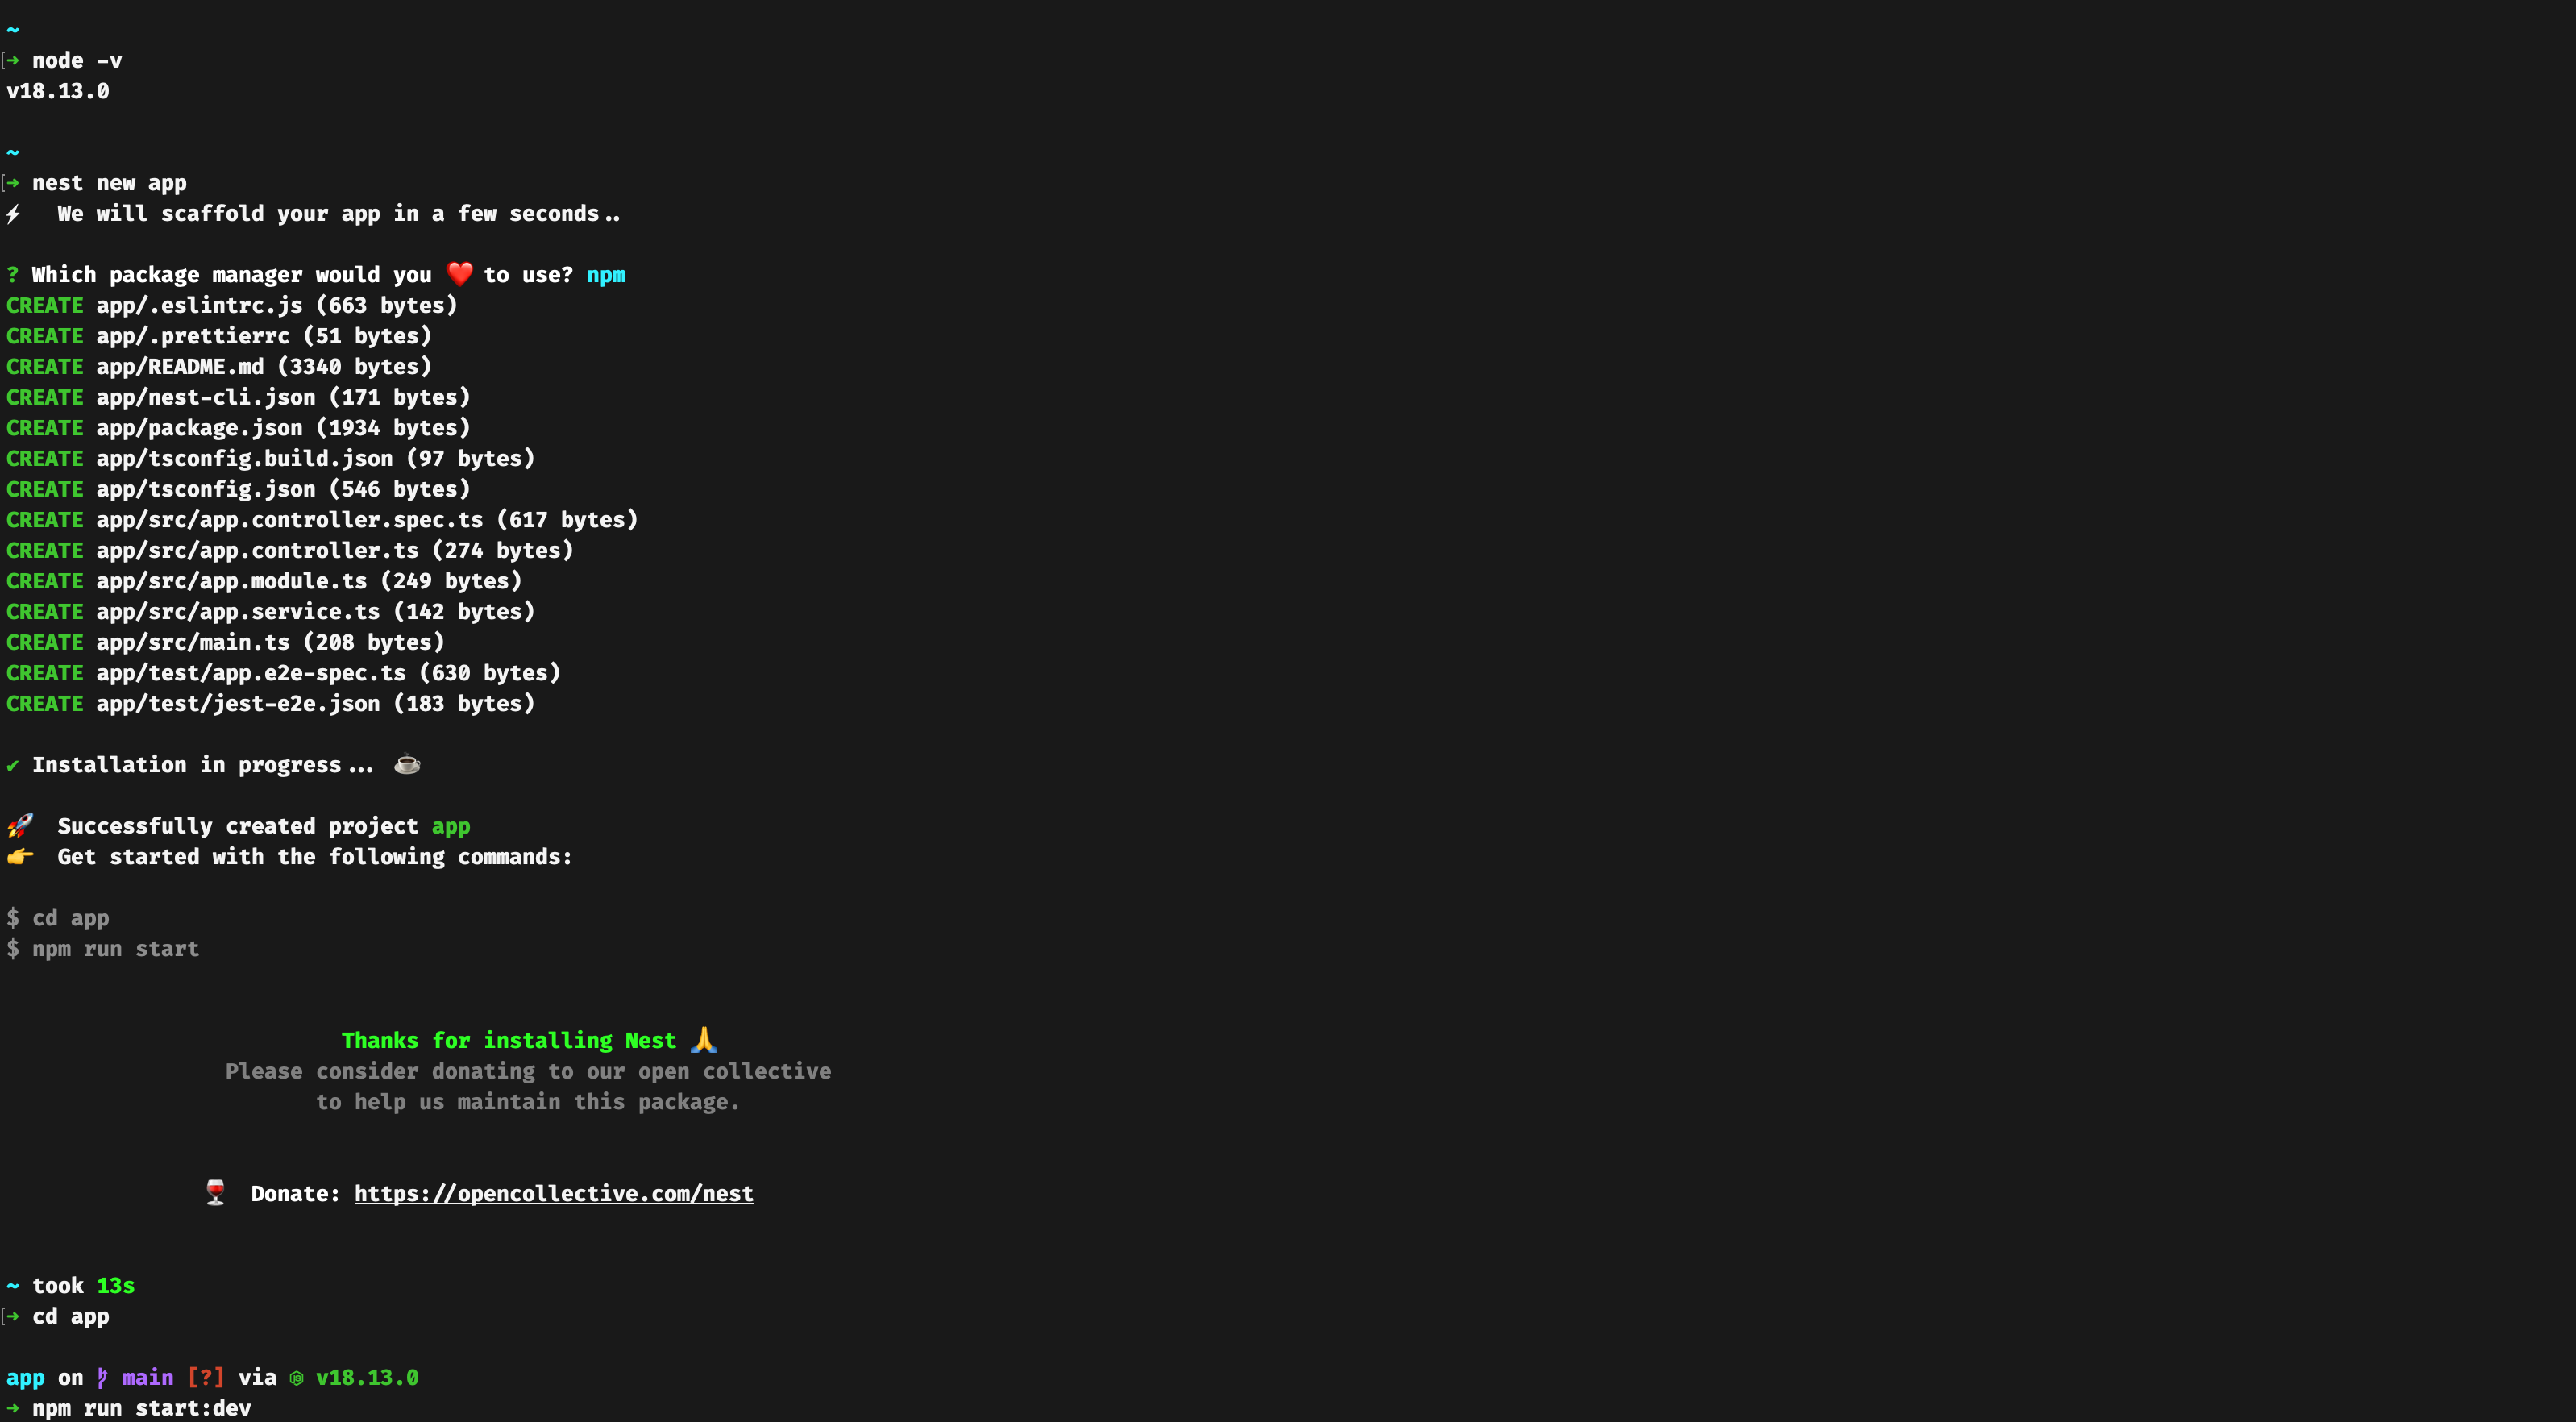
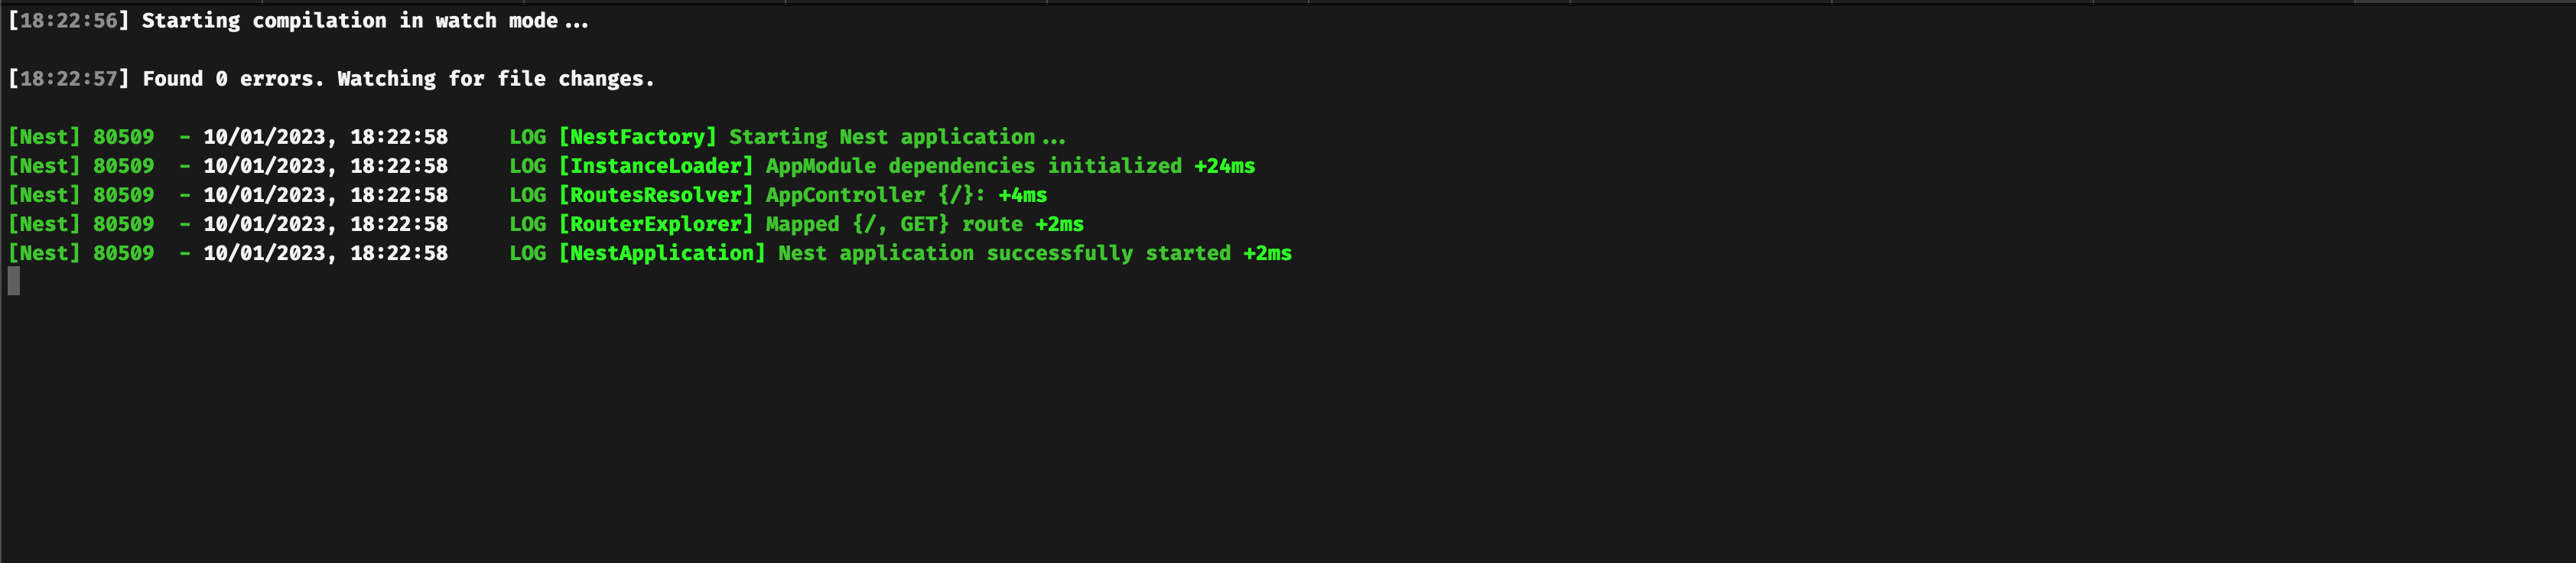
I generated an empty project using nest new projName and then ran the command npm run start:dev.
The result is it constantly shows:

File change detected. Starting incremental compilation...
Found 0 errors. Watching for file changes.

Then it just clears the terminal and starts over again.

Minimum reproduction code

none

Steps to reproduce

No response

Expected behavior

Run the project in watch mode.

Package

  • I don't know. Or some 3rd-party package
  • @nestjs/common
  • @nestjs/core
  • @nestjs/microservices
  • @nestjs/platform-express
  • @nestjs/platform-fastify
  • @nestjs/platform-socket.io
  • @nestjs/platform-ws
  • @nestjs/testing
  • @nestjs/websockets
  • Other (see below)

Other package

No response

NestJS version

9.0.0

Packages versions

{
  "name": "orders-nest",
  "version": "0.0.1",
  "description": "",
  "author": "",
  "private": true,
  "license": "UNLICENSED",
  "scripts": {
    "build": "nest build",
    "format": "prettier --write \"src/**/*.ts\" \"test/**/*.ts\"",
    "start": "nest start",
    "start:dev": "nest start --watch",
    "start:debug": "nest start --debug --watch",
    "start:prod": "node dist/main",
    "lint": "eslint \"{src,apps,libs,test}/**/*.ts\" --fix",
    "test": "jest",
    "test:watch": "jest --watch",
    "test:cov": "jest --coverage",
    "test:debug": "node --inspect-brk -r tsconfig-paths/register -r ts-node/register node_modules/.bin/jest --runInBand",
    "test:e2e": "jest --config ./test/jest-e2e.json"
  },
  "dependencies": {
    "@nestjs/common": "^9.0.0",
    "@nestjs/core": "^9.0.0",
    "@nestjs/platform-express": "^9.0.0",
    "reflect-metadata": "^0.1.13",
    "rxjs": "^7.2.0"
  },
  "devDependencies": {
    "@nestjs/cli": "^9.0.0",
    "@nestjs/schematics": "^9.0.0",
    "@nestjs/testing": "^9.0.0",
    "@types/express": "^4.17.13",
    "@types/jest": "29.2.4",
    "@types/node": "18.11.18",
    "@types/supertest": "^2.0.11",
    "@typescript-eslint/eslint-plugin": "^5.0.0",
    "@typescript-eslint/parser": "^5.0.0",
    "eslint": "^8.0.1",
    "eslint-config-prettier": "^8.3.0",
    "eslint-plugin-prettier": "^4.0.0",
    "jest": "29.3.1",
    "prettier": "^2.3.2",
    "source-map-support": "^0.5.20",
    "supertest": "^6.1.3",
    "ts-jest": "29.0.3",
    "ts-loader": "^9.2.3",
    "ts-node": "^10.0.0",
    "tsconfig-paths": "4.1.1",
    "typescript": "^4.7.4"
  },
  "jest": {
    "moduleFileExtensions": [
      "js",
      "json",
      "ts"
    ],
    "rootDir": "src",
    "testRegex": ".*\\.spec\\.ts$",
    "transform": {
      "^.+\\.(t|j)s$": "ts-jest"
    },
    "collectCoverageFrom": [
      "**/*.(t|j)s"
    ],
    "coverageDirectory": "../coverage",
    "testEnvironment": "node"
  }
}

Node.js version

18.13.0

In which operating systems have you tested?

  • macOS
  • Windows
  • Linux

Other

No response

@Hareloo Hareloo added the needs triage This issue has not been looked into label Jan 10, 2023
@Tony133
Copy link
Contributor

Tony133 commented Jan 10, 2023

Have you tried reinstalling the NestJS CLI ?

@Hareloo
Copy link
Author

Hareloo commented Jan 10, 2023

Have you tried reinstalling the NestJS CLI ?

Yes, didn't work sadly.

@Tony133
Copy link
Contributor

Tony133 commented Jan 10, 2023

Very strange because it works perfectly for me, It will be a problem with Windows, on Unix it works.

Screenshot 2023-01-10 alle 18 22 54

Screenshot 2023-01-10 alle 18 23 08

Try proposing this problem in the Discord support channel, maybe other people use them Windows as a local development environment.

@kienfssc
Copy link

kienfssc commented Jan 10, 2023

I have the same error too, in my desktop computer (not update for months) it still running, but in same repository running in my new installed laptop it not work.
My OS:
Ubuntu 20.04 LTS
My node version
First I use node 19 then I reinstall node 18 but it still not work

<--- Last few GCs --->

[3843:0x66e69f0] 94447 ms: Scavenge 4052.4 (4124.1) -> 4046.1 (4125.3) MB, 6.0 / 0.0 ms (average mu = 0.543, current mu = 0.409) allocation failure;
[3843:0x66e69f0] 94473 ms: Scavenge 4053.5 (4125.3) -> 4047.0 (4142.1) MB, 8.5 / 0.0 ms (average mu = 0.543, current mu = 0.409) allocation failure;
[3843:0x66e69f0] 96394 ms: Mark-sweep 4063.2 (4143.1) -> 4048.3 (4144.2) MB, 1873.4 / 0.0 ms (average mu = 0.404, current mu = 0.217) allocation failure; scavenge might not succeed

<--- JS stacktrace --->

FATAL ERROR: Reached heap limit Allocation failed - JavaScript heap out of memory
1: 0xb6b850 node::Abort() [node]
2: 0xa806a6 [node]
3: 0xd52140 v8::Utils::ReportOOMFailure(v8::internal::Isolate*, char const*, bool) [node]
4: 0xd524e7 v8::internal::V8::FatalProcessOutOfMemory(v8::internal::Isolate*, char const*, bool) [node]
5: 0xf2fbe5 [node]
6: 0xf420cd v8::internal::Heap::CollectGarbage(v8::internal::AllocationSpace, v8::internal::GarbageCollectionReason, v8::GCCallbackFlags) [node]
7: 0xf1c7ce v8::internal::HeapAllocator::AllocateRawWithLightRetrySlowPath(int, v8::internal::AllocationType, v8::internal::AllocationOrigin, v8::internal::AllocationAlignment) [node]
8: 0xf1db97 v8::internal::HeapAllocator::AllocateRawWithRetryOrFailSlowPath(int, v8::internal::AllocationType, v8::internal::AllocationOrigin, v8::internal::AllocationAlignment) [node]
9: 0xefed6a v8::internal::Factory::NewFillerObject(int, v8::internal::AllocationAlignment, v8::internal::AllocationType, v8::internal::AllocationOrigin) [node]
10: 0x12c265f v8::internal::Runtime_AllocateInYoungGeneration(int, unsigned long*, v8::internal::Isolate*) [node]
11: 0x16ef479 [node]
Aborted (core dumped)

@Tony133
Copy link
Contributor

Tony133 commented Jan 10, 2023

I have the same error too, in my desktop computer (not update for months) it still running, but in same repository running in my new installed laptop it not work. My OS: Ubuntu 20.04 LTS My node version First I use node 19 then I reinstall node 18 but it still not work

<--- Last few GCs --->

[3843:0x66e69f0] 94447 ms: Scavenge 4052.4 (4124.1) -> 4046.1 (4125.3) MB, 6.0 / 0.0 ms (average mu = 0.543, current mu = 0.409) allocation failure; [3843:0x66e69f0] 94473 ms: Scavenge 4053.5 (4125.3) -> 4047.0 (4142.1) MB, 8.5 / 0.0 ms (average mu = 0.543, current mu = 0.409) allocation failure; [3843:0x66e69f0] 96394 ms: Mark-sweep 4063.2 (4143.1) -> 4048.3 (4144.2) MB, 1873.4 / 0.0 ms (average mu = 0.404, current mu = 0.217) allocation failure; scavenge might not succeed

<--- JS stacktrace --->

FATAL ERROR: Reached heap limit Allocation failed - JavaScript heap out of memory 1: 0xb6b850 node::Abort() [node] 2: 0xa806a6 [node] 3: 0xd52140 v8::Utils::ReportOOMFailure(v8::internal::Isolate*, char const*, bool) [node] 4: 0xd524e7 v8::internal::V8::FatalProcessOutOfMemory(v8::internal::Isolate*, char const*, bool) [node] 5: 0xf2fbe5 [node] 6: 0xf420cd v8::internal::Heap::CollectGarbage(v8::internal::AllocationSpace, v8::internal::GarbageCollectionReason, v8::GCCallbackFlags) [node] 7: 0xf1c7ce v8::internal::HeapAllocator::AllocateRawWithLightRetrySlowPath(int, v8::internal::AllocationType, v8::internal::AllocationOrigin, v8::internal::AllocationAlignment) [node] 8: 0xf1db97 v8::internal::HeapAllocator::AllocateRawWithRetryOrFailSlowPath(int, v8::internal::AllocationType, v8::internal::AllocationOrigin, v8::internal::AllocationAlignment) [node] 9: 0xefed6a v8::internal::Factory::NewFillerObject(int, v8::internal::AllocationAlignment, v8::internal::AllocationType, v8::internal::AllocationOrigin) [node] 10: 0x12c265f v8::internal::Runtime_AllocateInYoungGeneration(int, unsigned long*, v8::internal::Isolate*) [node] 11: 0x16ef479 [node] Aborted (core dumped)

The latter, are errors that relate more to Node than to the NestJS CLI.

@kienfssc
Copy link

kienfssc commented Jan 11, 2023

I have the same error too, in my desktop computer (not update for months) it still running, but in same repository running in my new installed laptop it not work. My OS: Ubuntu 20.04 LTS My node version First I use node 19 then I reinstall node 18 but it still not work
<--- Last few GCs --->
[3843:0x66e69f0] 94447 ms: Scavenge 4052.4 (4124.1) -> 4046.1 (4125.3) MB, 6.0 / 0.0 ms (average mu = 0.543, current mu = 0.409) allocation failure; [3843:0x66e69f0] 94473 ms: Scavenge 4053.5 (4125.3) -> 4047.0 (4142.1) MB, 8.5 / 0.0 ms (average mu = 0.543, current mu = 0.409) allocation failure; [3843:0x66e69f0] 96394 ms: Mark-sweep 4063.2 (4143.1) -> 4048.3 (4144.2) MB, 1873.4 / 0.0 ms (average mu = 0.404, current mu = 0.217) allocation failure; scavenge might not succeed
<--- JS stacktrace --->
FATAL ERROR: Reached heap limit Allocation failed - JavaScript heap out of memory 1: 0xb6b850 node::Abort() [node] 2: 0xa806a6 [node] 3: 0xd52140 v8::Utils::ReportOOMFailure(v8::internal::Isolate*, char const*, bool) [node] 4: 0xd524e7 v8::internal::V8::FatalProcessOutOfMemory(v8::internal::Isolate*, char const*, bool) [node] 5: 0xf2fbe5 [node] 6: 0xf420cd v8::internal::Heap::CollectGarbage(v8::internal::AllocationSpace, v8::internal::GarbageCollectionReason, v8::GCCallbackFlags) [node] 7: 0xf1c7ce v8::internal::HeapAllocator::AllocateRawWithLightRetrySlowPath(int, v8::internal::AllocationType, v8::internal::AllocationOrigin, v8::internal::AllocationAlignment) [node] 8: 0xf1db97 v8::internal::HeapAllocator::AllocateRawWithRetryOrFailSlowPath(int, v8::internal::AllocationType, v8::internal::AllocationOrigin, v8::internal::AllocationAlignment) [node] 9: 0xefed6a v8::internal::Factory::NewFillerObject(int, v8::internal::AllocationAlignment, v8::internal::AllocationType, v8::internal::AllocationOrigin) [node] 10: 0x12c265f v8::internal::Runtime_AllocateInYoungGeneration(int, unsigned long*, v8::internal::Isolate*) [node] 11: 0x16ef479 [node] Aborted (core dumped)

The latter, are errors that relate more to Node than to the NestJS CLI.

I tried to run Vue.js app, and a Vanilla NodeJS app (with express), it's still good to go

@kamilmysliwiec
Copy link
Member

Please, use our Discord channel (support) for such questions. We are using GitHub to track bugs, feature requests, and potential improvements.

@nestjs nestjs locked and limited conversation to collaborators Jan 11, 2023
Sign up for free to subscribe to this conversation on GitHub. Already have an account? Sign in.
Labels
needs triage This issue has not been looked into
Projects
None yet
Development

No branches or pull requests

4 participants