[Bug]: eBPF integration with apps.plugin is causing excessive CPU/memory usage growing with time #12719
Comments
|
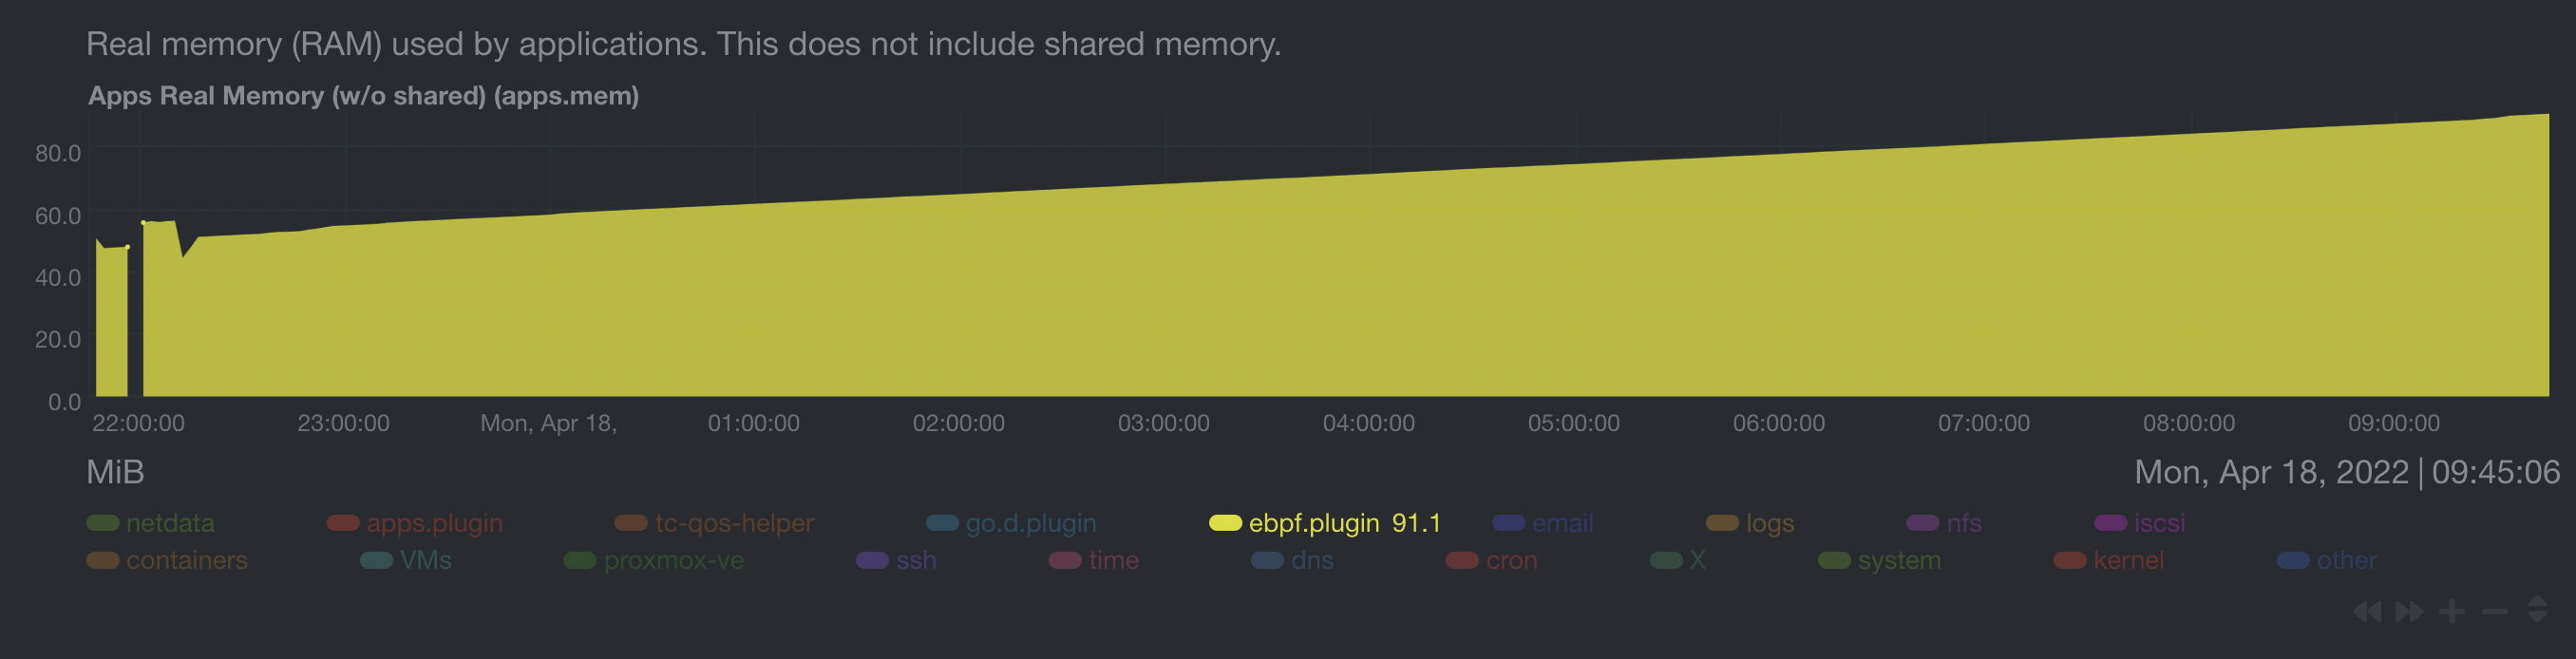
@vobruba-martin hi, did you check memory usage? Does it grow too? I noticed it a few days ago on my server, the memory usage is constantly growing.
|
|
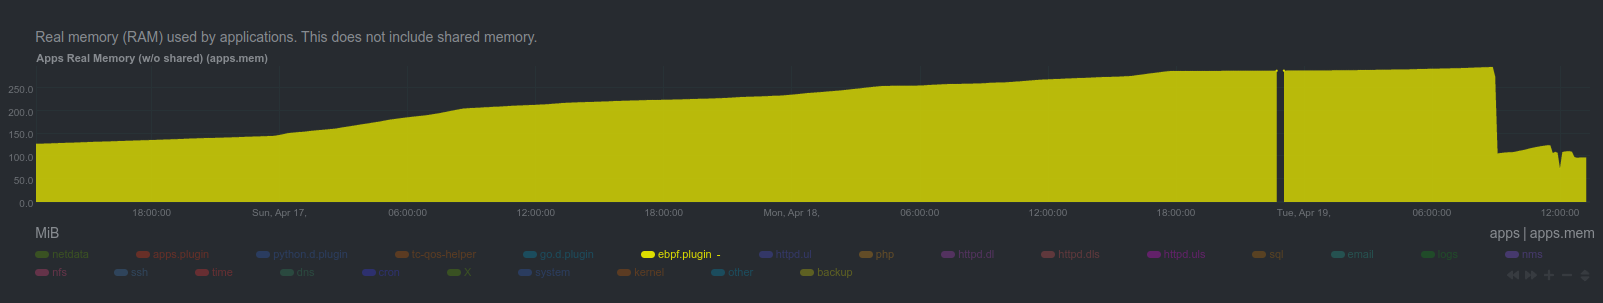
@ilyam8 Yes, memory usage seems growing With |
|
Hello @vobruba-martin , I have only one more question, because this will be my priority for today. Are you using default configuration for plugin? Or did you change your configuration? Best regards! |
|
Hi @thiagoftsm , I'm running with all ebpf programs set to yes. See my ebpf.d.conf#
# Global options
#
# The `ebpf load mode` option accepts the following values :
# `entry` : The eBPF collector only monitors calls for the functions, and does not show charts related to errors.
# `return : In the `return` mode, the eBPF collector monitors the same kernel functions as `entry`, but also creates
# new charts for the return of these functions, such as errors.
#
# The eBPF collector also creates charts for each running application through an integration with the `apps.plugin`
# or `cgroups.plugin`.
# If you want to disable the integration with `apps.plugin` or `cgroups.plugin` along with the above charts, change the setting
# `apps` and `cgroups` to 'no'.
#
# The `update every` option defines the number of seconds used to read data from kernel and send to netdata
#
# The `pid table size` defines the maximum number of PIDs stored in the application hash tables.
#
[global]
ebpf load mode = entry
apps = yes
cgroups = no
update every = 5
pid table size = 32768
#
# eBPF Programs
#
# The eBPF collector enables and runs the following eBPF programs by default:
#
# `cachestat` : Make charts for kernel functions related to page cache.
# `dcstat` : Make charts for kernel functions related to directory cache.
# `disk` : Monitor I/O latencies for disks
# `fd` : This eBPF program creates charts that show information about file manipulation.
# `mdflush` : Monitors flush counts for multi-devices.
# `mount` : Monitor calls for syscalls mount and umount
# `filesystem`: Monitor calls for functions used to manipulate specific filesystems
# `hardirq` : Monitor latency of serving hardware interrupt requests (hard IRQs).
# `oomkill` : This eBPF program creates a chart that shows which process got OOM killed and when.
# `process` : This eBPF program creates charts that show information about process life.
# `shm` : Monitor calls for syscalls shmget, shmat, shmdt and shmctl.
# `socket` : This eBPF program creates charts with information about `TCP` and `UDP` functions, including the
# bandwidth consumed by each.
# `softirq` : Monitor latency of serving software interrupt requests (soft IRQs).
# `sync` : Montitor calls for syscall sync(2).
# `swap` : Monitor calls for internal swap functions.
# `vfs` : This eBPF program creates charts that show information about process VFS IO, VFS file manipulation and
# files removed.
[ebpf programs]
cachestat = yes
dcstat = yes
disk = yes
fd = yes
filesystem = yes
hardirq = yes
mdflush = yes
mount = yes
oomkill = yes
process = yes
shm = yes
socket = yes
softirq = yes
sync = yes
swap = yes
vfs = yes
network connections = yes |
|
Hello @vobruba-martin , The behavior that you and @ilyam8 described is happening, mainly because I agree with you that we have room to improve the way the plugin is working right now, and I agreed with product team to work with this issue in the next days. As soon the PR is merged, I will return here with more details about how you can enable the new feature, that won't be used by default. 🤝 best regards! |
Does it explain constant CPU/mem increasing (no decreasing)? |
Yes. Every time you require a kernel a specific area, it tries to allocate more memory than you have required. When you have a big sample of connections or other actions on your host from different processes/threads, it can increase both data, because you are requiring more effort from kernel to allocate data. Now about the "decreasing", I am reviewing all codes related to allocating with this PR I am working right now. I am not discarding that for a specific thread, we did not clean data until the thread ends. :/ |
|
BTW today I had to set |

|
Hello @vobruba-martin , The PR was initially created last night, but I was missing few threads to finish it. Now that the PR blocking the fix was merged, I am working with it today, and tomorrow it will be ready for reviewers, I expect to merge the final solution until Friday. Best regards! |
|
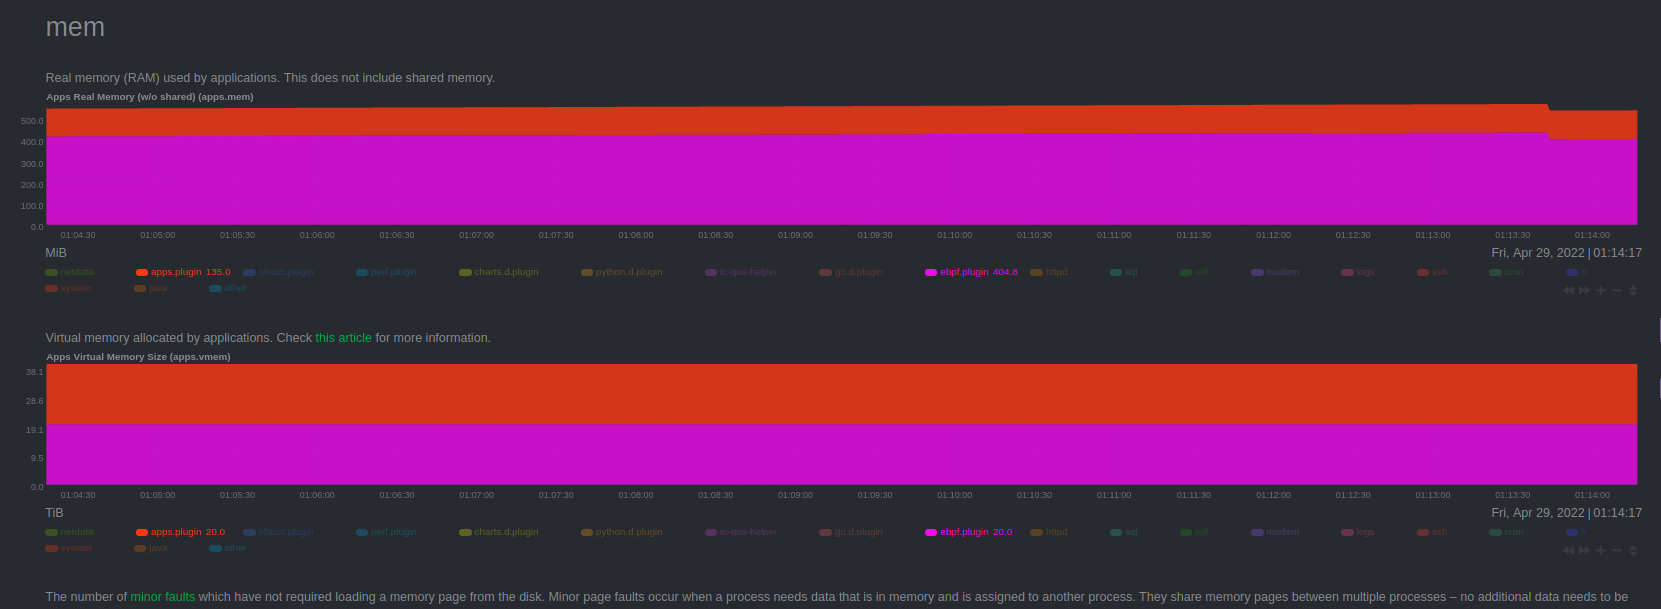
Hello guys, An update, I am finishing the description of the PR that fixed the majority of the problems right now. As you can see in the next image, when the PR is merged, the eBPF.plugin will use less CPU than apps:
And it will also use less memory:
The memory usage won't be static yet, because the functions Best regards! |

|
@thiagoftsm is this issue fixed/you r working on/can't reproduce/etc? @vobruba-martin it's been a while and @thiagoftsm added some changes to the ebpf plugin. Can you check the latest (nightly) Netdata? |
|
Hello @ilyam8 , This is fixed and will be available in next stable-release, but the nightly already have the code merged. |
|
Hello @thiagoftsm @ilyam8 , Do you plan to release the next stable in near future? I have bad experiences with nightlies so I'd rather wait for the stable release. |
@vobruba-martin are you on nightly and the problem is not fixed? Can you show your Netdata Agent version? |
|
@ilyam8 No, I run current stable version and I'd like to wait for the next stable release to test if this issue is fixed. |
Hello @vobruba-martin , We had an internal talk about this yesterday, and we expect to have next release in the first weeks of October. |
Bug description
You can see that %sys CPU usage is growing with time. This is happening only if I have
apps = yesinebpd.d.conf.I don't see Netdata directly causing this issue. It seems to be caused by Apache httpd processes bun only if
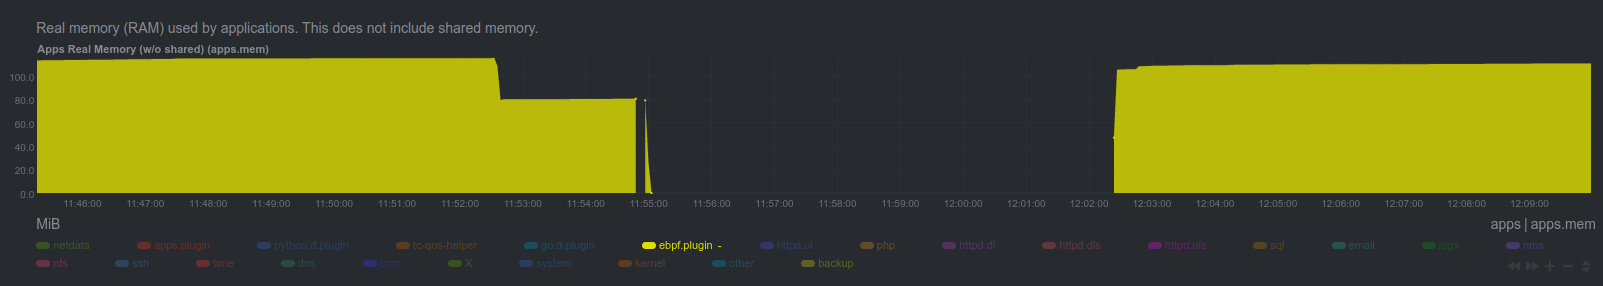
apps = yes.From ~11:48 to ~11:53 I killed eBPF plugin several times to find the cause.
~11:55 Netdata was restarted with
apps = noinebpd.d.conf.~12:02 Netdata was restarted with
apps = yesinebpd.d.conf.After further investigation I can tell that
socket = noalso helps to avoid this issue.Expected behavior
I expect higher CPU usage but it should be constant and not to grow with time.
Steps to reproduce
I can reproduce this issue only by running Netdata along with several Apache httpd instances on Ubuntu 20.04. For example MySQL instance, which is also accepting a lot of network connections (but not from so many sources), doesn't seem to affected.
Installation method
kickstart.sh
System info
Netdata build info
Additional info
No response
The text was updated successfully, but these errors were encountered: